Abstract
Purpose
To create two matched short forms of the Philadelphia Naming Test (PNT) that yield similar results to the PNT for measuring anomia.
Methods
Study 1: We first used archived naming data from 94 aphasic individuals to identify which PNT items should be included in the short forms, and the two constructed sets of 30 items, PNT30-A and PNT30-B, were validated using archived data from a separate group of 56 aphasic individuals. Study 2: We then evaluated the reliability of the PNT, PNT30-A, and PNT30-B across independent test administrations with a new group of 25 aphasic individuals selected to represent the full range of naming impairment.
Results
Study 1: PNT30-A and PNT30-B were found to be internally consistent; and accuracy scores on these subsets of items were highly correlated with the full PNT. Study 2: PNT accuracy was extremely reliable over the span of one week; and independent administrations of PNT30-A and PNT30-B produced similar results to the PNT and to each other.
Conclusions
The short forms can be used to reliably estimate PNT performance, and the results can be compared to the provided norms. The two matched tests allow for measurement of change in naming ability.
Keywords: Aphasia, Assessment, Speech production, Stroke
Introduction
Research on picture naming in aphasia has contributed invaluable information about how words are accessed from the mental lexicon. The Philadelphia Naming Test (PNT; Roach, Schwartz, Martin, Grewal, & Brecher, 1996) was developed for research purposes, and it has provided a wealth of empirical data around which theoretical and computational models of aphasic naming have been developed and debated (e.g., Abel, Huber, & Dell, 2009; Dell, Martin, & Schwartz, 2007; Martin, Dell, Saffran, & Schwartz, 1994; Shapiro & Caramazza, 2003). This paper presents a short form PNT, called PNT30, which is tailored more to the goals of the clinic. We describe the development of the PNT30, present evidence of its validity and reliability, and derive percentile norms based on archived data from a large group of individuals with diverse presentations of aphasia.
Lexical Access in Picture Naming
Although healthy individuals perform the task of picture naming with apparent ease, it is widely agreed by scientists in the field that naming is a complex cognitive process that involves several ordered steps. First, the target is conceptualized as a lexical-semantic entity; next, the concept is mapped to a known word; and finally the word’s phonological constituents (syllables, phonemes) are retrieved and ordered (Butterworth, 1989; Dell, 1986; Garrett, 1980; Levelt, Roelofs, & Meyer, 1999). There are alternative theories of the computational processes involved and how they are impacted by aphasia (Rapp & Goldrick, 2000). Glossing over the differences, we can say that aphasia alters the activation strength of the signal (i.e., the target representation), relative to various sources of noise in the system (including competition from other, related representations), thereby reducing the likelihood of a successful retrieval attempt. As judged by the distribution of different types of naming errors, it is characteristic of some individuals, and some clinically defined subtypes, that their deficit is greater at one stage of retrieval than others (e.g., Caplan, Vanier, & Baker, 1986; Caramazza & Hillis, 1990; Schwartz, Dell, Martin, Gahl, & Sobel, 2006). However, since a deficit at any stage compromises retrieval accuracy, and the vast majority of individuals with aphasia have deficits at multiple stages, it is apparent why accuracy scores are almost invariably depressed in individuals with aphasia, relative to their age-matched controls.
Clinicians are frequently motivated to diagnose the severity of a patient’s naming deficit, either as a prelude to treating the deficit, or because naming scores can provide a simple metric of the functional impact of aphasia (e.g., Herbert, Hickin, Howard, Osborne, & Best, 2008). In the next section, we describe the PNT and demonstrate that accuracy on this test correlates with global measures of aphasia severity, and, equally important, is insensitive to age, education, and other demographic variables.
The PNT
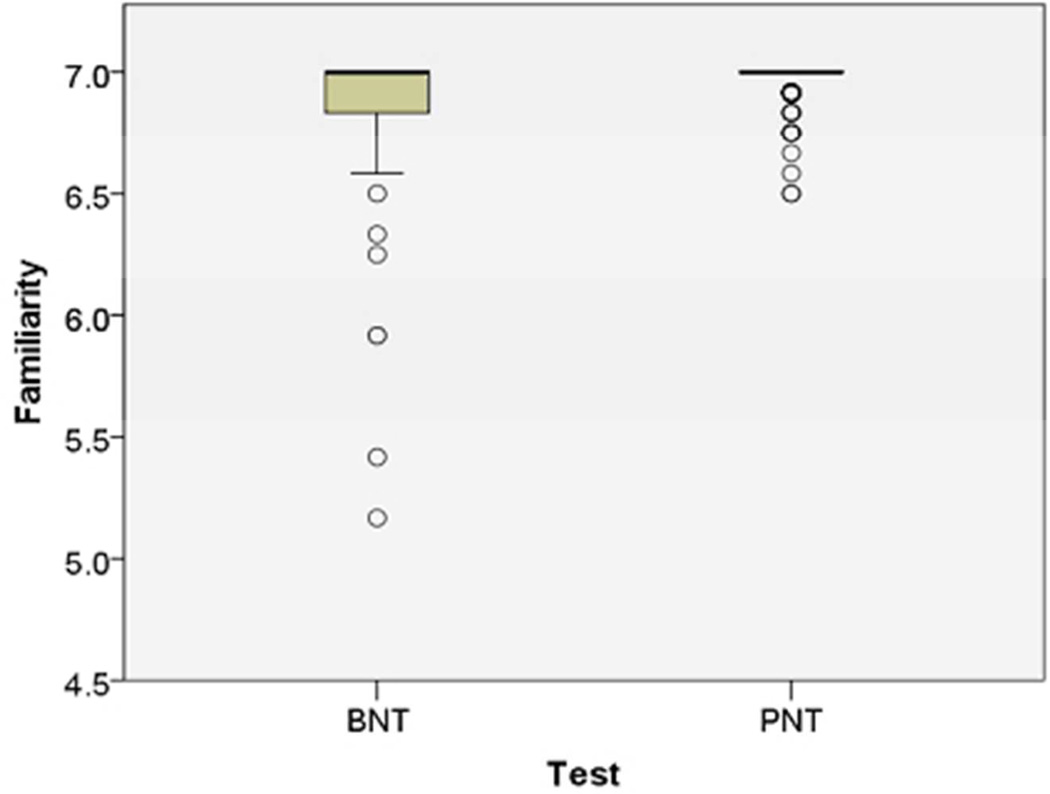
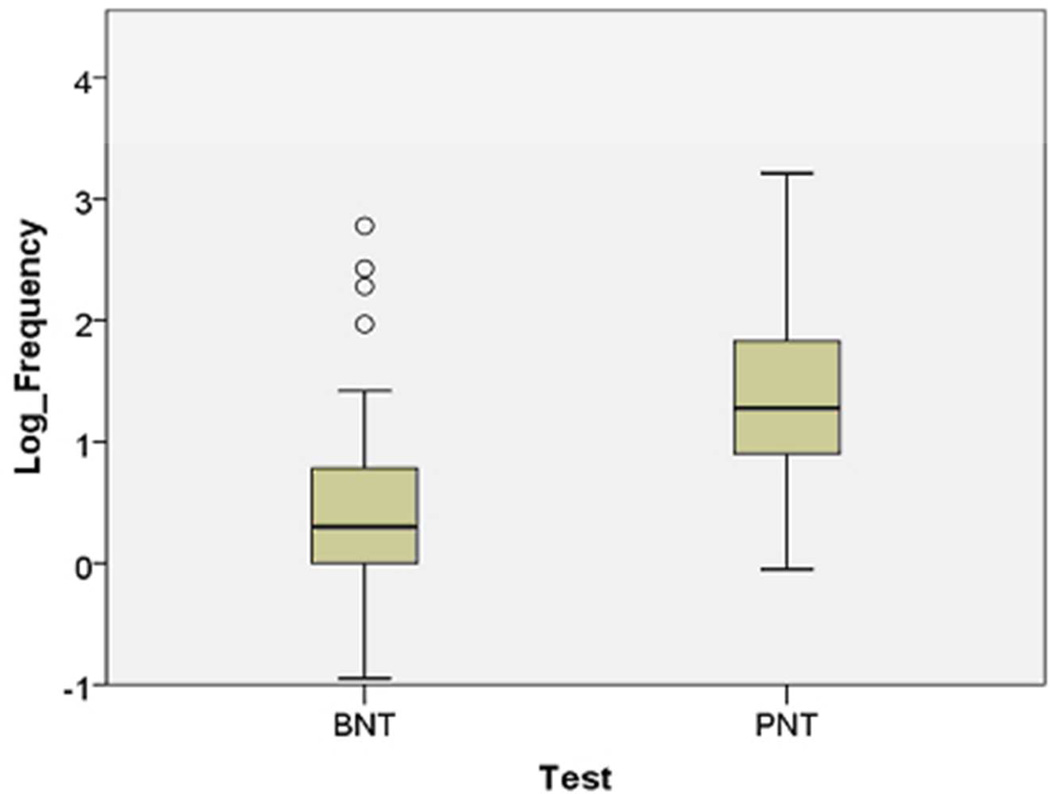
The PNT is a 175-item test of picture naming. Items are line-drawn exemplars of animate and inanimate objects (all non-unique, i.e., no famous people or landmarks). Target properties (familiarity, frequency, name agreement, length) are appropriate to a test designed to measure retrieval of known words; see Figure 1, where the PNT is compared to another well-known naming test. On each trial, the first complete response is categorized according to a detailed scoring scheme. Additional details about administration and scoring are provided later, as they become relevant. The complete PNT, including target properties and scoring guidelines, is available for download at http://www.mrri.org/. At the Moss Rehabilitation Research Institute, the PNT has been administered to over 240 research participants with stroke aphasia. The archival data reported in this paper were drawn from this group, which is comprised of mostly chronic aphasics, unselected for severity or subtype. These and other data are published online in the Moss Aphasia Psycholinguistics Project Database (MAPPD) (http://www.mappd.org; Mirman et al., 2010).
Figure 1.
These boxplots compare ratings of the items on the Boston Naming Test (Kaplan et al., 1983) and Philadelphia Naming Test (Roach et al., 1996) for: A) Familiarity (1–7 Likert scale ratings from http://neighborhoodsearch.wustl.edu/Neighborhood/Home.asp; this source provided ratings for 48/60 BNT items and 150/175 PNT items); and B) Frequency (log frequency values provided for all items by the CELEX database; Baayen et al., 1993). As seen in these boxplots, the PNT items are designed to test known words (i.e., familiar and frequent). The center bar is the median rating, the box is the interquartile range (IQR), and outliers (greater than 1.5 times the IQR) are shown as circles.
From a clinical standpoint, an important property of the PNT is that it is highly correlated with measures of aphasia severity and weakly correlated with demographic variables. Table 1 presents new evidence to this effect, derived from clinical and behavioral scores published in the MAPPD. The 86 participants with aphasia who contributed to this analysis comprise all who were in the MAPPD at the time of this writing for whom we also had computerized CT or MRI brain scans from which to derive lesion volume estimates.1 Table 2 reports demographic and clinical data for all the cohorts that we investigated, including these 86 participants (designated Group 1). The correlational analysis of Group 1, summarized in Table 1, revealed that Aphasia Quotient, derived from the Western Aphasia Battery (Kertesz, 1982), and stroke lesion volume, estimated from radiological imaging, were both significantly correlated with PNT accuracy, while age, education, gender, and race were all unrelated to PNT results.
Table 1.
Pearson correlations between PNT accuracy and various clinical and demographic variables.
Table 2.
Demographic and clinical data for all groups of patients, selected from the web-based MAPPD. Cell values represent counts of patients when a single value is displayed, or they represent the group mean with the range displayed in parentheses. If the means and ranges were not derived from the total count in the group due to missing data, the n used for calculation is also displayed in parentheses. Aphasia classification was determined by the Westeren Aphasia Battery (Kertesz, 1982) when possible, otherwise by clinical reports.
| Group 1 | Group 2 | Group 3 | Group 4 | Group 5 | |
|---|---|---|---|---|---|
| Purpose | Motivate clinical use of PNT | Construction of PNT30 | Virtual validation of PNT30 | Independent administrations of PNT and PNT30 |
Construction of percentile norms |
| Selection criteria |
MAPPD participants; with radiological imaging |
MAPPD participants; studied in Schwartz et al. (2006) |
All MAPPD participants not in Schwartz et al. (2006) cohort |
PNT performance ranged over the full scale |
All participants in MAPPD |
| Demographics | |||||
| Total N | 86 | 94 | 66 | 25 | 213 |
| Male | 33 | 56 | 32 | 14 | 126 |
| Female | 53 | 38 | 24 | 11 | 87 |
| Caucasian | 47 | 57 | 32 | 15 | 121 |
| African American | 37 | 37 | 23 | 10 | 88 |
| Hispanic | 1 | 0 | 1 | 0 | 3 |
| Asian | 1 | 0 | 0 | 0 | 1 |
| Age | 58 (26–79) | 59 (22–86) | 59 (28–79) | 60 (45–75) | 59 (22–86) |
| Education | 14.2 (10–21) | 13.5 (7–21) | 13.5 (8–21) | 14.8 (12–21) | 13.6 (7–22) |
| Mos. post-stroke | 57.9 (1–381) | 37.5 (1–195) | 21.2 (1–130) | 67.5 (7–252) | 32.3 (1–381) |
| Clinical Dx | |||||
| Anomic | 42 | 29 | 19 | 7 | 87 |
| Broca's | 24 | 31 | 8 | 11 | 50 |
| Conduction | 15 | 18 | 15 | 4 | 39 |
| Wernicke's | 4 | 14 | 13 | 2 | 32 |
| TCM | 1 | 0 | 0 | 0 | 1 |
| TCS | 0 | 2 | 1 | 1 | 3 |
| WAB AQ | 76.2 (27.2–97.6) | 71.2 (45.2–92.7) (n=38) | 73.9 (33.1–97.6) (n=32) | 64.1 (27.2–95.2) | 74.1 (27.2–97.9) (n=131) |
| BDAE Severity | N/A | 2.7 (0–5) (n=51) | 2.9 (1–4) (n=23) | N/A | 2.8 (1–5) (n=71) |
| Lesion volume | 108.3 (8.0–376.1) | N/A | N/A | N/A | N/A |
The test design of the PNT provides the clinician with different information than what is currently available from other clinical naming tests. For comparison, the Boston Naming Test (BNT; Kaplan, Goodglass, & Weintraub, 1983) is designed to estimate naming ability relative to control norms. The BNT is a popular and widely researched test, but its scores have been shown to correlate with demographic variables unrelated to neurological symptoms, in both healthy controls (Hawkins & Bender, 2002; Zec, Burkett, Markwell, & Larsen, 2007) and cognitively impaired groups (Ross, Lichtenberg, & Christensen, 1995). Stratified normative data may offset this complication to the extent that normative samples represent the test-taker, but there are at present no such norms for aphasic performance on the BNT. As noted above, PNT scores are not related to demographic factors in the large and diverse MAPPD aphasia sample. Therefore, its results may be usefully compared to those of other test-takers with aphasia. While there are well-documented applications for the BNT and its short forms in classifying aphasic deficits with respect to healthy populations (e.g., del Toro et al., 2011), the PNT seeks to inform the clinician about aphasic deficits with respect to other aphasic patients. This novel approach to describing anomic symptoms is intended to supplement rather than supplant current practices.
While the target properties and contributing factors of the PNT are well suited to clinical application, its length renders it impractical to administer in most clinical settings. We therefore sought to reduce its length to a more clinically manageable 30 items2, with the following constraints: first, the new PNT30 should maintain the favorable properties of the PNT; and, second, it should predict the PNT score with very high accuracy, thereby making it possible to utilize norms based on the full PNT. In addition, we sought to create two equivalent PNT30 tests that could be used to measure spontaneous or treatment-related change. With these aims in mind, we conducted two studies. In Study 1, we determined which PNT items should be included in the short forms; in Study 2, we measured the reliability of the PNT and the short forms across independent test administrations. The methods and results of our studies are presented below, followed by a general discussion.
Study 1 – PNT30 Construction and Virtual Validation
We describe here the process by which the PNT30 item sets were selected from the PNT, and the virtual validation study we carried out using PNT data archived in the MAPPD. We use the term "virtual validation" to denote that these comparisons are not independent; due to the use of archived data, the responses to the PNT30 items are a subset of the PNT responses.
Methods
Participants
All the participants were recruited from the Neuro-Cognitive Rehabilitation Research Patient Registry at the Moss Rehabilitation Research Institute (Schwartz, Brecher, Whyte, & Klein, 2005). Each had confirmed left hemisphere stroke, and currently or initially presented with clinically apparent aphasia. All were right handed (Oldfield, 1971), spoke English as their primary language, and had adequate vision and hearing (Ventry & Weinstein, 1983) without or with correction. None of the participants had major psychiatric or neurologic co-morbidities. All were living in the community at time of testing. They gave informed consent under protocols approved by the Institutional Review Board at Albert Einstein Medical Center and they were paid for their participation. Aphasic individuals who could not understand directions or who could not name at least one item correctly on the PNT were excluded. These were the only language-related exclusion criteria.
The first phase of Study 1 (PNT30 Construction) used MAPPD-archived data from the 94 participants previously reported in Schwartz et al. (2006). We elected to use their data for PNT30 construction because the 2006 study had identified reliable response patterns that we sought to preserve in the short forms. In Table 2, which summarizes demographic and clinical data for all participant groups, these 94 are designated Group 2.
The second phase of Study 1 (Virtual Validation) used archived data from a new sample of 56 participants with similar characteristics (Table 2, Group 3). This group comprised all of the participants that existed in the MAPPD at the time of the short form construction who were not in the Schwartz et al. (2006) cohort.
Constructing the PNT30
Large-scale studies of aphasic performance on the PNT have revealed a reliable severity-by-error type interaction: Phonological error rates are highest among individuals with low naming scores and they show a steep drop off as correctness gets higher. In contrast, semantic errors bear a weaker, curvilinear relation to correctness, being more likely in moderately impaired individuals than in those at the ends of the severity continuum (Dell, Schwartz, Martin, Saffran, & Gagnon, 1997). The severity-error type interaction instantiated in PNT performance features importantly in the semantic-phonological model of aphasic naming (Schwartz et al., 2006), and we therefore aspired to preserve this property in the short form. Thus, in constructing the PNT30, our first goal was to select items that individually instantiated the empirically-derived PNT severity-by-error type interaction. Moreover, since error rates and error-type probabilities are known to be influenced by the lexical properties of targets (e.g., longer words are more likely to elicit phonological errors) (Kittredge, Dell, Verkuilen, & Schwartz, 2008; Nickels & Howard, 1995), we had as a second goal to have the selected item set match the distributional properties of the full PNT. The test construction process proceeded in two steps, corresponding to these two goals.
Step 1: Item Analysis
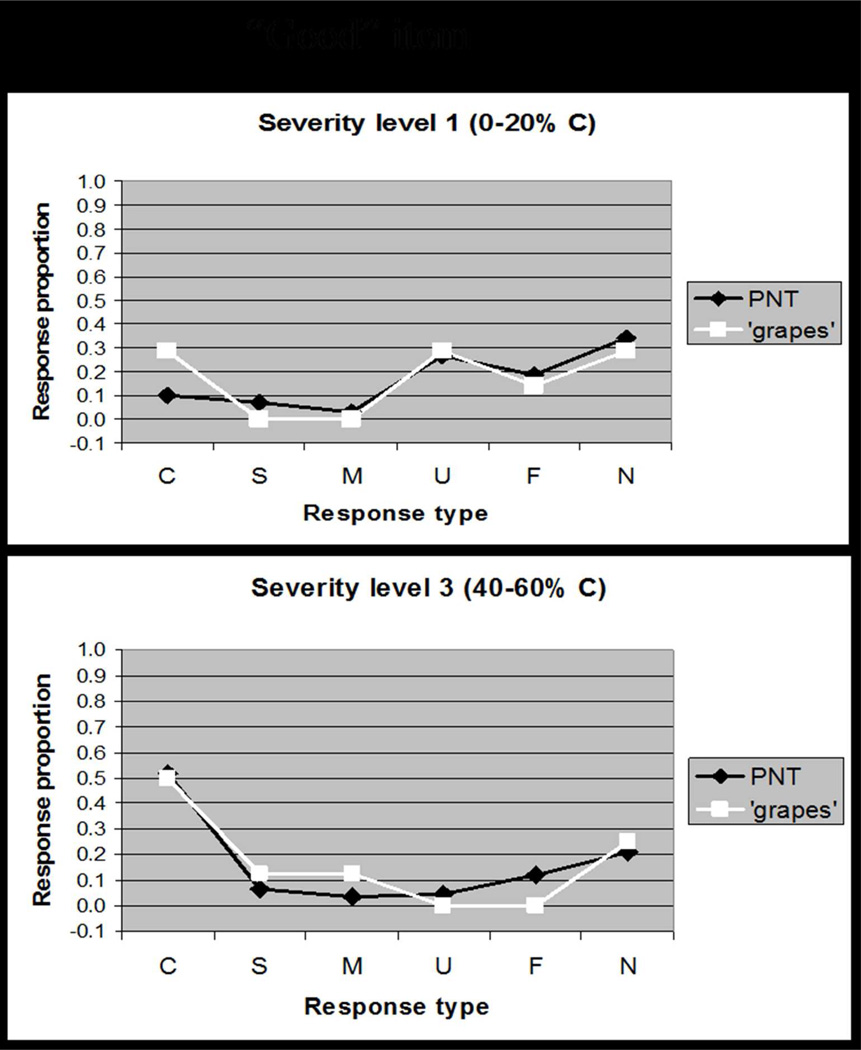
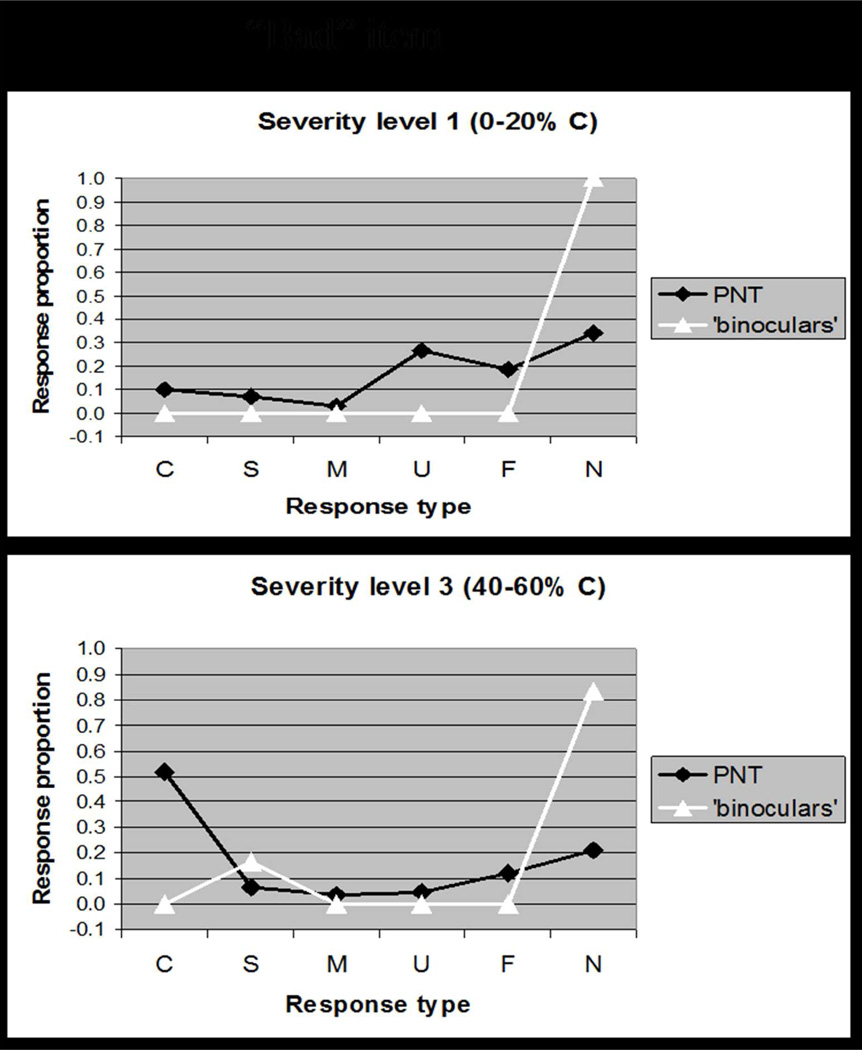
Overall accuracy (i.e. difficulty) is a commonly used dimension for rating test items; however, because our goal was to capture interactions between accuracy and error type, the single dimension that we used to rate items was rather a response-type distribution that captured both accuracy and error scores. Details of the rating procedure are provided in Appendix 1. A concrete example illustrates how a “good” item (e.g., GRAPES, Figure 2A) was determined to elicit the typical response pattern at different levels of severity, whereas a “bad” item (e.g., BINOCULARS, Figure 2B) elicits responses that deviate from the typical pattern. Our item analysis yielded a rating for each item along a single dimension that captured the goodness of the item.
Figure 2.
Based on data reported in Schwartz et al. (2006), these plots comparing the distribution of response types (Correct, Semantic, Mixed, Unrelated, Formal, Neologism) for a single item to the distribution of response types on the full PNT. Figure 2A shows how a "good" item, GRAPES, elicits responses that are typical of patients at different levels of severity. By contrast, Figure 2B shows how a "bad" item, BINOCULARS, elicits responses that deviate from the typical response pattern. Our Item Response Analysis procedure quantified the discrepancy in response distributions to rank items for selection (see Appendix 1).
Step 2: Target Lexical Properties
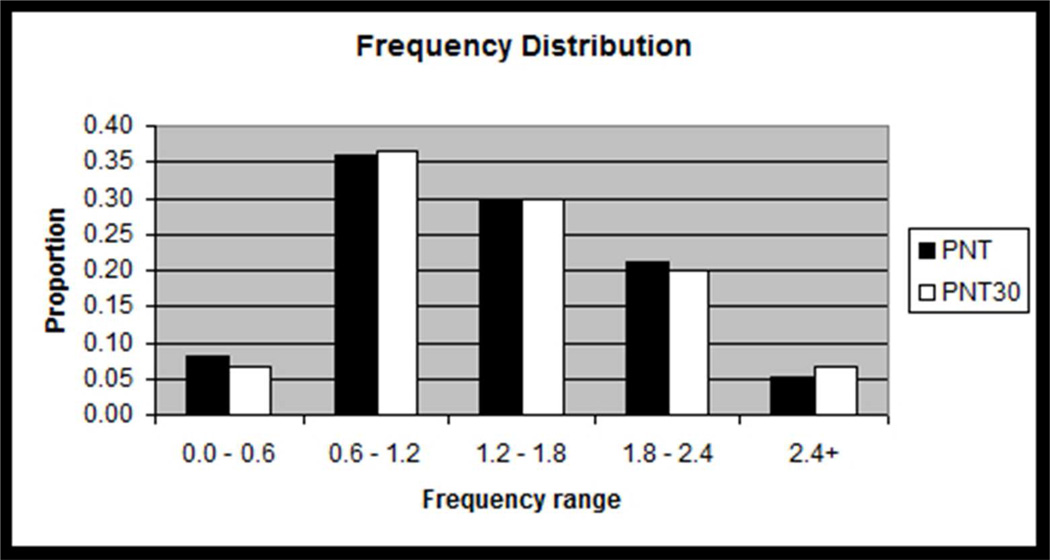
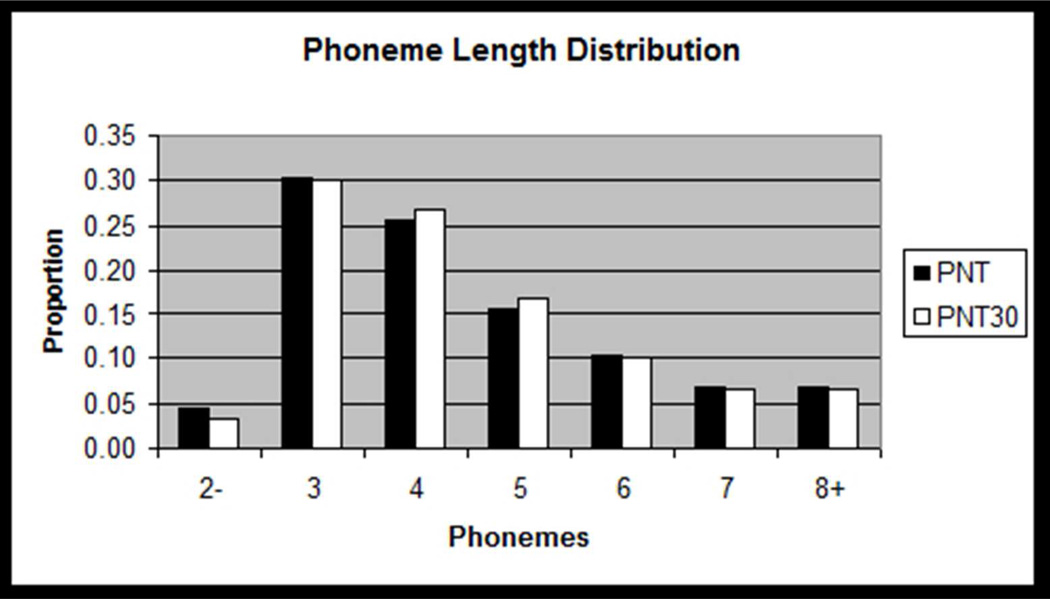
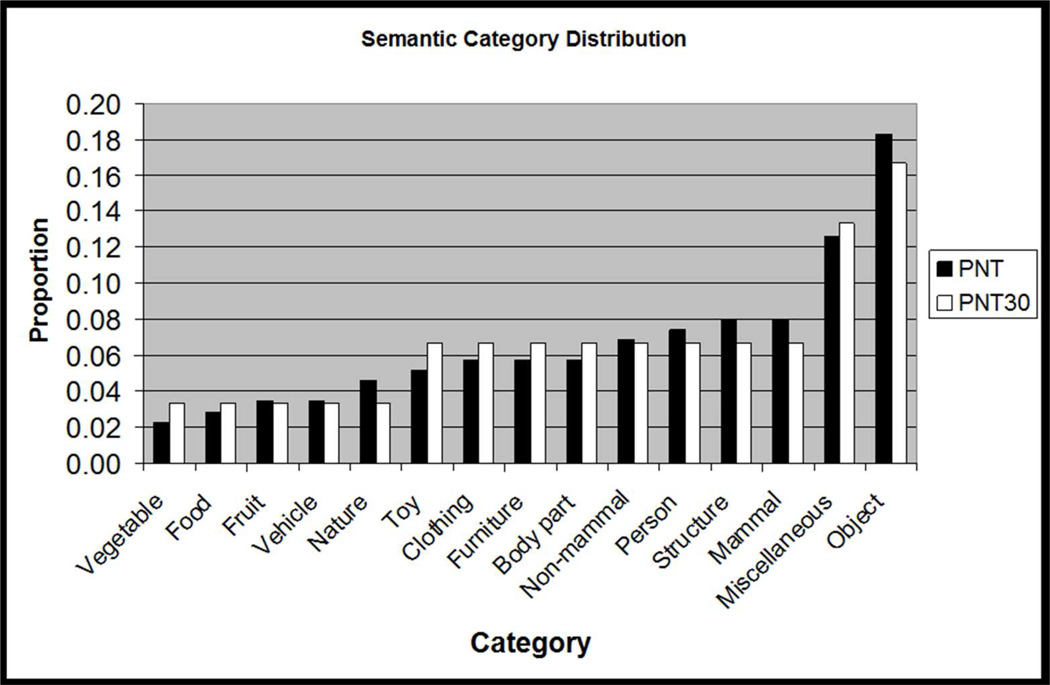
We further constrained item selection to preserve the PNT’s distributions of important target lexical properties. For each PNT target, the number of phonemes, the CELEX log frequency (Baayen, Piepenbrock, & Van Rijn, 1993), and the semantic category was determined. Using histograms of these properties (see Figure 3), we calculated the requisite number of each type of item (e.g., items in a particular frequency range) needed to preserve the distribution in the PNT30. Then, the items with the highest rankings from the item analysis were selected to fill the lexical property distribution requirements. The items for PNT30-A and PNT30-B were selected simultaneously to ensure that the sets’ item rankings were matched. The items of PNT30-A and PNT30-B are presented in Appendix 2.
Figure 3.
Histograms showing how the distributions of target lexical properties for the PNT30 items were matched to those of the full PNT. Frequency data are log frequency values from the CELEX database (Baayen et al., 1993), with bins representing approximately 1 standard deviation of log frequency values on the PNT.
Virtual Validation Study
For the virtual validation study, we analyzed archived PNT data from 56 participants to determine how performance on the selected item sets, PNT30-A and PNT30-B, compared to the full PNT and to each other. Although we analyzed both accuracy scores and errors, we will present only results for the accuracy analysis, which we believe will provide the most immediate benefit to clinicians. We will return to error-type data briefly in the Discussion section. To accommodate the fact that accuracy scores are dichotomous (right/wrong) and scale between 0% and 100%, the summed accuracy scores were transformed to the empirical logit, with the addition of 0.5 to avoid division by 0, for the purpose of statistical calculations (McCullagh & Nelder, 1989). The logit has a relatively straightforward interpretation as the log-odds of an item being named correctly.
Results
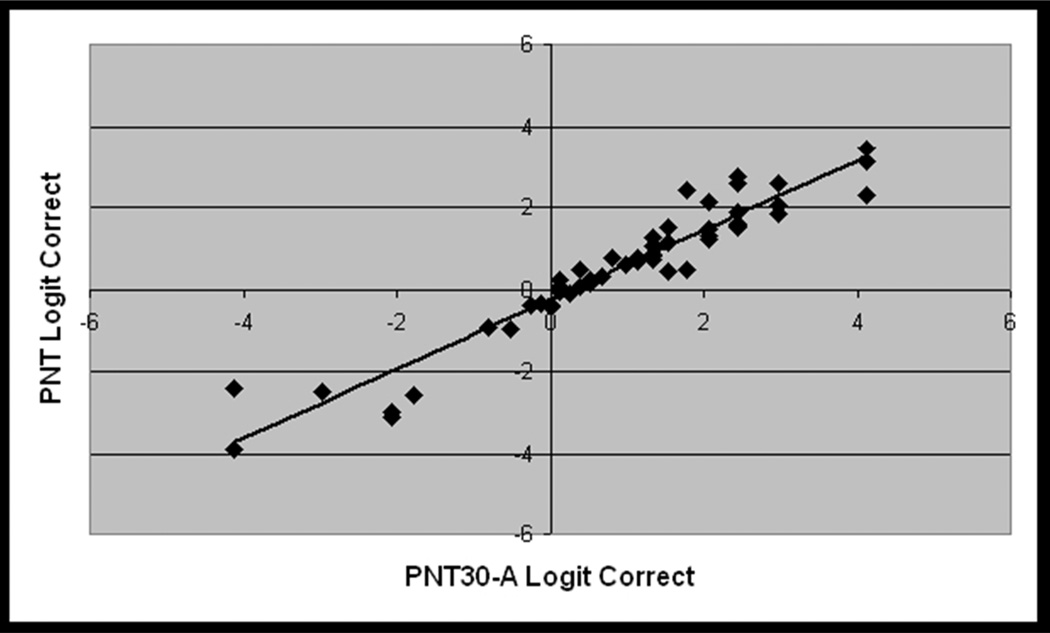
PNT accuracy scores spanned nearly the full range of performance (2% – 97%), but were negatively skewed, with more participants in the upper portion of the range (avg. = 63%, std. dv. = 27%, skewness = −0.9). The subsets of items corresponding to PNT30-A and PNT30-B were internally consistent (Cronbach’s alpha = .94 for both), indicating high intercorrelations among the test items, and the logit-transformed summed accuracy scores were highly correlated with the full test (r = .95 and .97, respectively; see Figure 4). Paired t-tests revealed that both short forms produced slightly higher accuracy scores than the full test, with an average increase of 6 and 3 percentage points for PNT30-A and PNT30-B, respectively (t = 7.9 and 4.0; df = 55, p(2-tailed) < .001 for both). A possible explanation is that, as described in Appendix 1, our procedure for selecting items for the short forms eliminated items that we had reason to believe might have less than optimal recognizability or name agreement. This small but reliable difference in accuracy shows up again in the validation study with new data (Study 2) and, as will be described, is accounted for by a statistical prediction model used to construct the norms.
Figure 4.
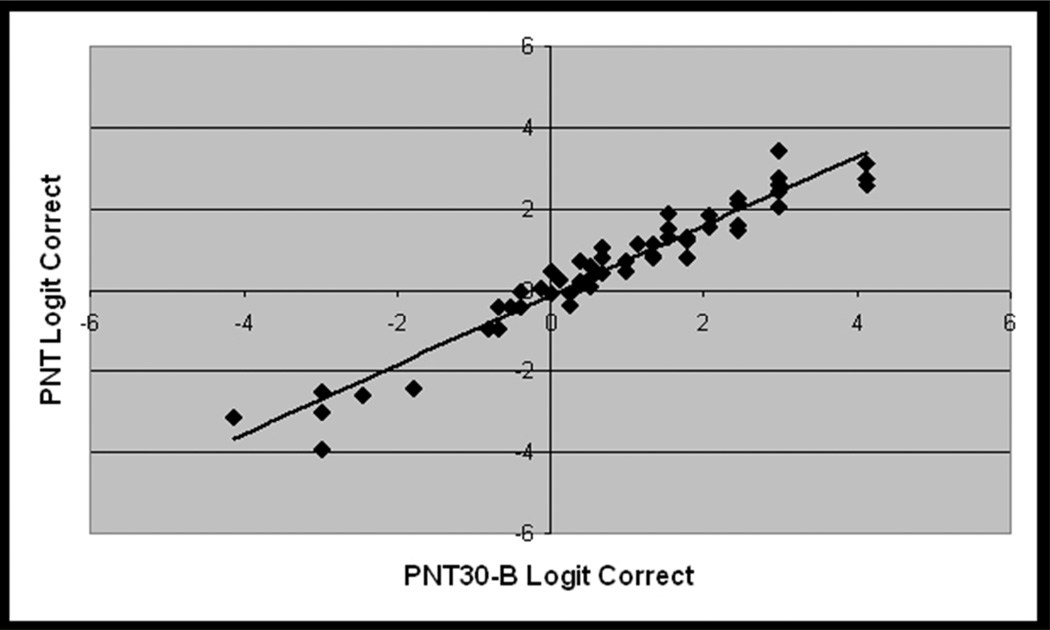
From the virtual validation study (Study 1, n = 56), scatterplots showing the linear association between logit-transformed accuracy scores for the full PNT and each PNT30 item subset. Pearson correlations were very high for both comparisons (r=.95 for PNT30 A, r=.97 for PNT30 B).
Study 2 – Validation of the Short Forms with New Data
Study 2 had multiple goals. The first was to evaluate each short form when performed as a complete, 30-item test, using administration procedures appropriate to the clinic. The second goal was to collect data on the full PNT, including its test-retest reliability, when these same new administration procedures were in use. Using the test-retest data as a reliability standard, we could then compare each short form to the full PNT, and each to the other. A product of this analysis was a prediction model that derives the full PNT score from a PNT30 score. Based on this prediction model, we constructed percentile norms that enable the clinician to compare a patient’s score on the PNT30 to the PNT performance of the large, diverse aphasia cohort represented in the MAPPD. Finally, we measured the variability in difference scores on PNT30-A versus PNT30-B within an aphasic reference group and used the results to construct preliminary norms for determining whether an observed change is real or due to chance.
Methods
Participants
For the validation study with new data, twenty-five individuals with aphasia were recruited from the MRRI Neuro-Cognitive Rehabilitation Research Patient Registry who met the inclusion and exclusion criteria outlined in Study 1. Additional conditions for enrollment were that each participant had performed the PNT at least 6 months earlier and that, for the group, PNT accuracy scores spanned evenly across the full range. In particular, we made a special effort to include very poor namers to better represent the full severity range. Demographic and clinical data are summarized in Table 2 (Group 4). Compared to the other cohorts in the table, Group 4 had lower mean AQ and proportionally fewer individuals who qualify as anomic. All participants gave informed consent under a protocol approved by the Institutional Review Board at Albert Einstein Medical Center and were paid for their participation.
For the calculation of percentile norms, we drew on the records of all participants in the MAPPD with complete demographic information and at least one PNT (n=213). For those with more than one PNT, only the first was used. Table 2 (Group 5) provides demographic and clinical information for this normative group.
Procedures
Two changes were made to the standard PNT administration procedures to bring them more in line with clinical application: The 30 second deadline to respond was replaced by a 10 second deadline; and the trial-by-trial feedback was eliminated, so that participants were not told the correct response but were simply given general encouraging feedback throughout the test (e.g., “You’re doing fine”). 3
Each participant performed both short forms within one week, and each performed the full PNT twice, also within one week, with a month intervening between the short and full form administrations. Half the participants performed the short forms before the PNT; and the order of the short forms, A and B, was also counterbalanced.
Results
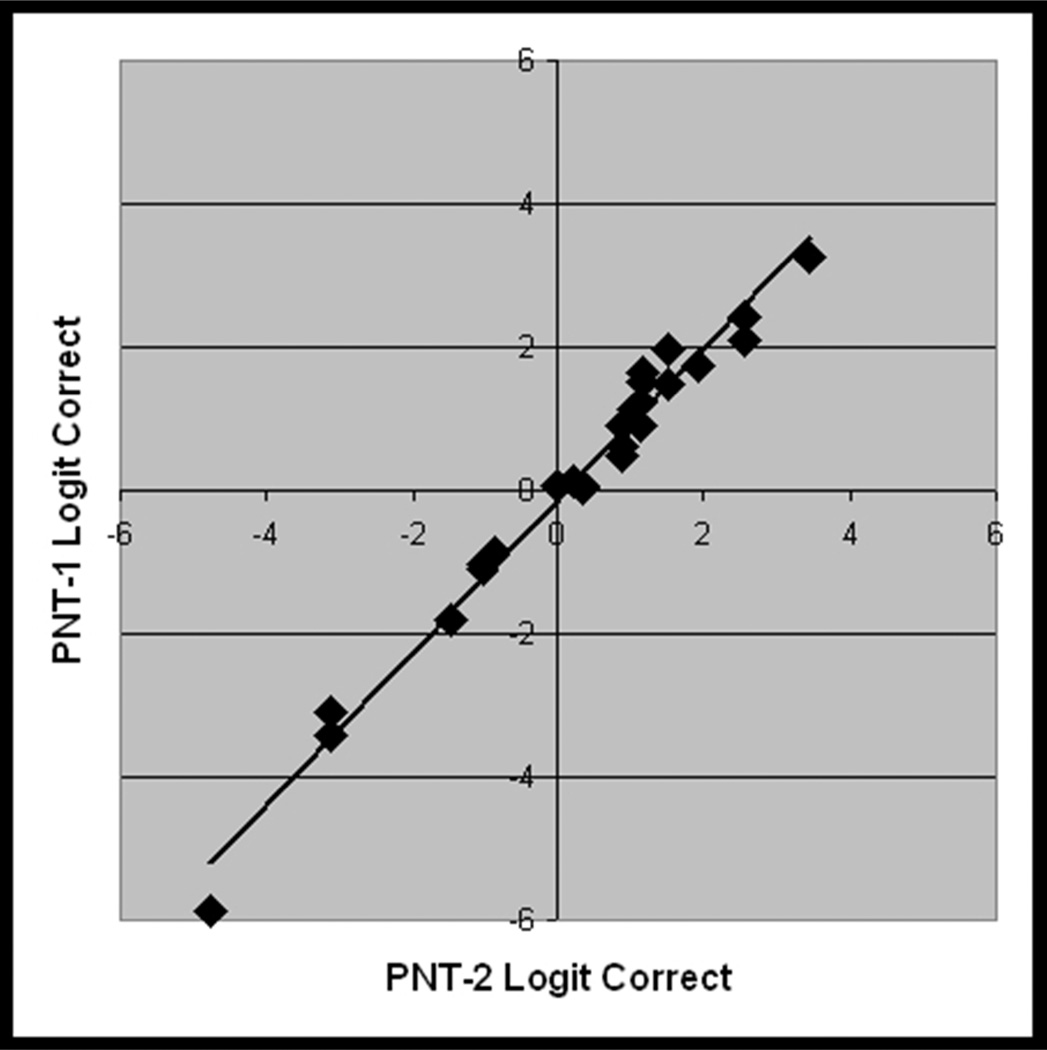
Considering first the results for the full PNT, accuracy scores on the first administration ranged from 0% – 97%, (avg. = 57%, std dv. = 31%, skewness = −0.6). The PNT test-retest correlations were nearly perfect (r = 0.99, Figure 5a), and a paired t-test showed no significant difference in PNT scores over the interval of one week (t = 1.3; df = 24; p(2-tailed) = .21).
Figure 5.
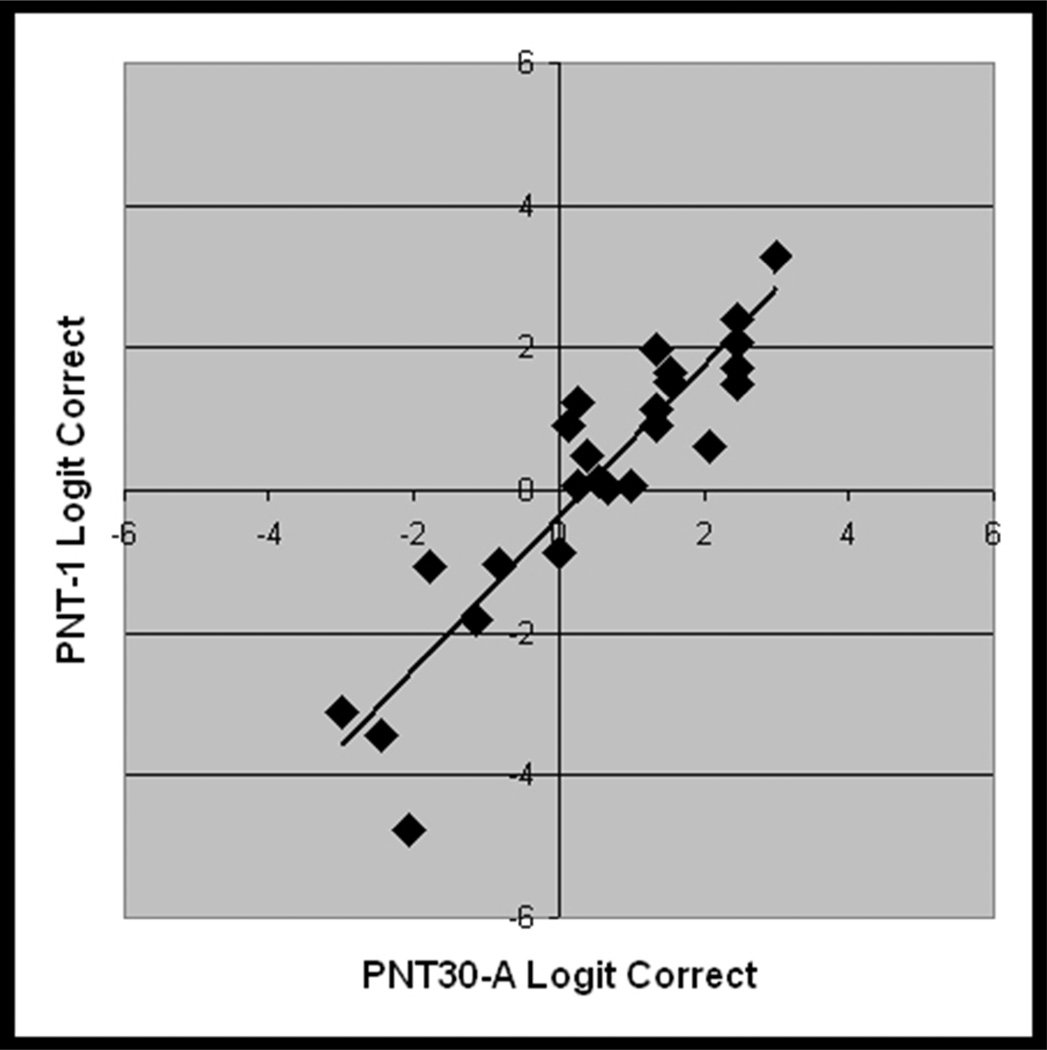
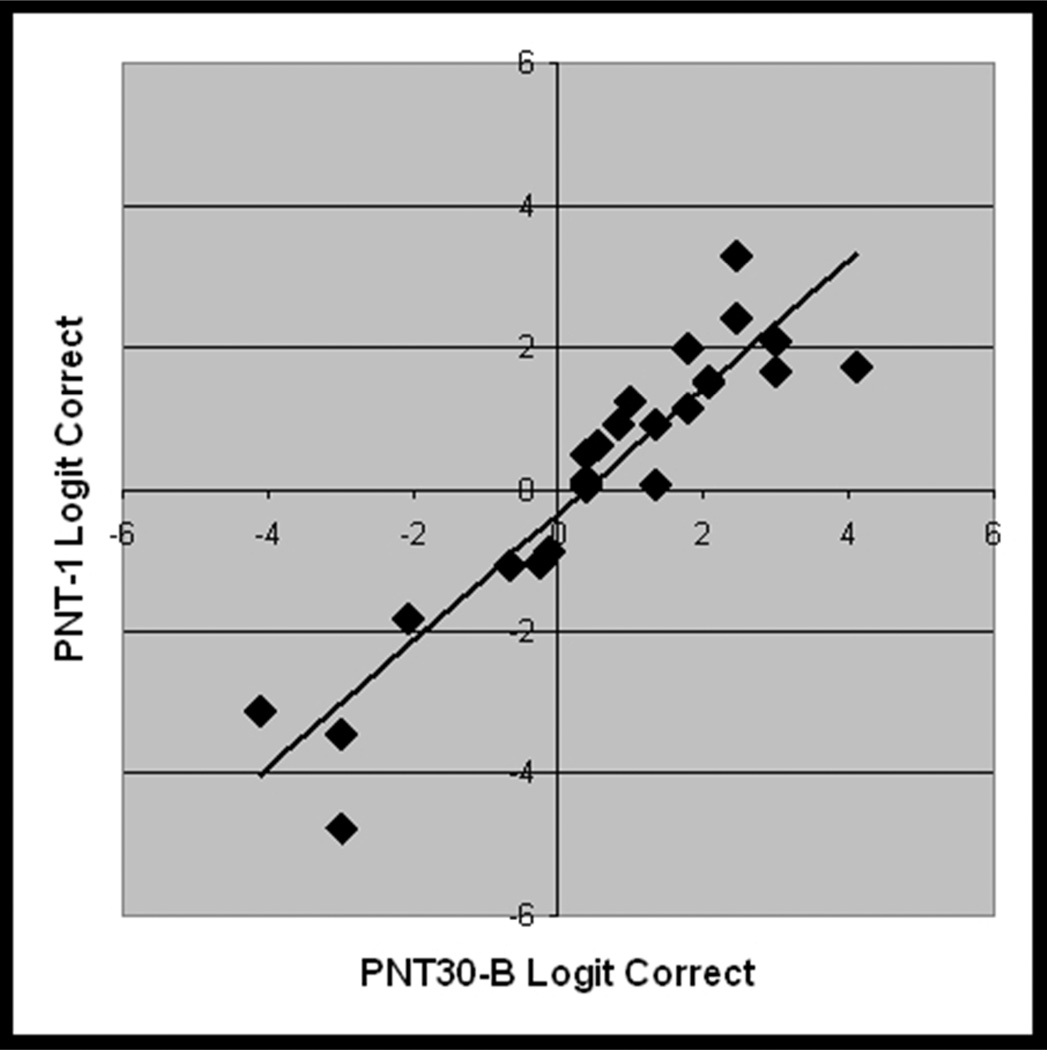
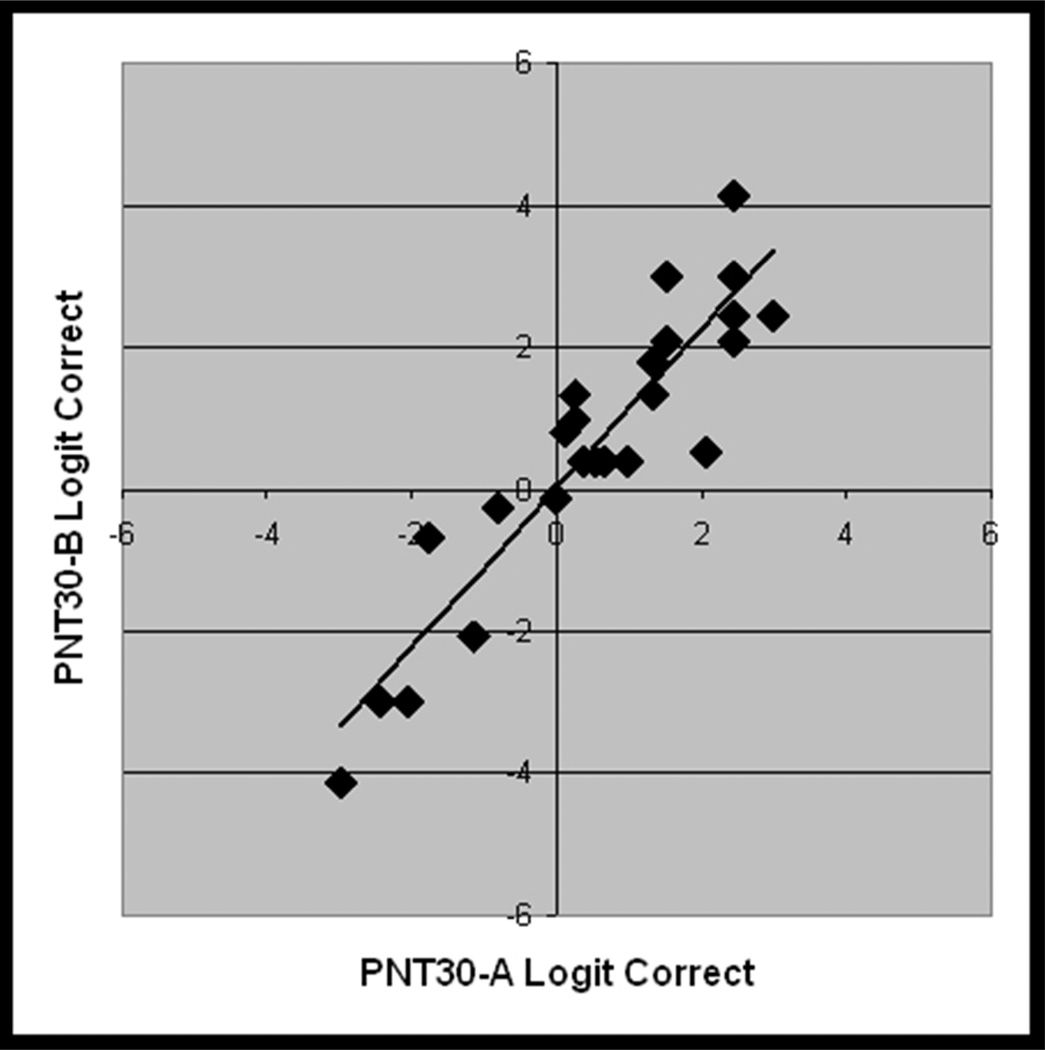
From the validation study with new data (Study 2, n = 25), scatterplots showing the linear association between logit transformed accuracy scores on independent administrations of A) PNT (i.e., test-retest), B) PNT30-A and PNT, C) PNT30-B and PNT, and D) PNT30-A and PNT30-B.
PNT30-A and PNT30-B were internally consistent (Cronbach’s alpha = .95 and .96) and, as before, each correlated highly with the full PNT (r = .93 and .98; see Figure 5b and 5c). Table 3 provides summary statistics for the logit-transformed scores on the independent test administrations. Levene's test for homogeneity of variance revealed no significant difference between the forms. As had been observed in Study 1, mean accuracy was higher for the short forms than for the PNT (61% and 63%, compared to 57%). One-tailed paired t-tests performed on the logit-transformed scores confirmed that the differences in accuracy were significant (t = 1.8 and 3.6; df = 24; p < .04).
Table 3.
Summary statistics for the logit-transformed scores on independent administrations of the PNT and the short forms (n=25). Levene's test for homogeneity of variance indicates that the three forms did not produce significantly different variances in scores. Pairwise t-tests indicate that both short forms produced a significantly higher score on average than the PNT (t = 1.8 and 3.6; 1-tailed p < .04), but they did not produce significantly different scores from each other (t = 0.8; 2-tailed p = .43).
| Avg. logit | StDev. logit | |
|---|---|---|
| PNT | 0.18 | 2.06 |
| PNT30-A | 0.55 | 1.65 |
| PNT30-B | 0.64 | 201 |
| Levene test | F=.23, p=.79 |
In the next step, we derived a formula that would mathematically convert a PNT30 score to a full PNT score, taking account of the high covariance between the tests as well as the difference in accuracy. A linear regression analysis run on the logit-transformed scores yielded a model that predicts the first PNT score from either PNT30 with R2 = .81. The equation expressing this model (y=1.006x−0.4189) can be used to convert any PNT30 score to its PNT equivalent. The PNT equivalent score can then be interpreted in relation to percentile norms derived from the MAPPD corpus. Table 4 enables this to be done by lookup. For example, the table shows that a PNT30 score of 15 items, or 50%, has a PNT equivalent score of 40%, which puts the test-taker in the 21st percentile (i.e., better than 21 percent of the aphasia normative group). We discuss the limitations of this novel way to describe aphasic naming deficits in the General Discussion.
Table 4.
The first column, PNT30 #C, is the number of correctly named items on either PNT30-A or PNT30-B. The second column, PNT %C, provides the corresponding percent correct on the full PNT. The third column provides a percentile score based on the full MAPPD cohort (n = 213; See Table 2, Group 5).
| PNT30 #C | PNT %C | Percentile (n = 213) |
|---|---|---|
| 0 | 0 | 0 |
| 1 | 3 | 2 |
| 2 | 5 | 5 |
| 3 | 7 | 6 |
| 4 | 10 | 7 |
| 5 | 12 | 9 |
| 6 | 15 | 10 |
| 7 | 17 | 12 |
| 8 | 20 | 13 |
| 9 | 22 | 13 |
| 10 | 25 | 14 |
| 11 | 28 | 15 |
| 12 | 31 | 17 |
| 13 | 34 | 18 |
| 14 | 37 | 19 |
| 15 | 40 | 21 |
| 16 | 43 | 23 |
| 17 | 46 | 25 |
| 18 | 49 | 29 |
| 19 | 53 | 31 |
| 20 | 56 | 36 |
| 21 | 60 | 40 |
| 22 | 64 | 44 |
| 23 | 67 | 47 |
| 24 | 71 | 52 |
| 25 | 75 | 58 |
| 26 | 80 | 63 |
| 27 | 84 | 71 |
| 28 | 88 | 82 |
| 29 | 93 | 92 |
| 30 | 98 | 99 |
Accuracy scores on PNT30-A and PNT30-B were highly correlated with each other (r = .93; see Figure 5d); a paired t-test showed no significant difference between them (t = 0.8; df = 24; 2-tailed p = .43). This was expected, based on how closely the sets were matched. The finding justifies use of the two versions as alternative forms to measure change. To assist in the interpretation of change scores, we used the data from this group of 25 to estimate the probability of an observed change, assuming that the null hypothesis is true and the change is due only to chance.
To begin with, we assumed that in the reference group, differences between the short forms were simply due to chance. More specifically, we assumed that difference scores (PNT30-A minus PNT30-B) in the reference group constitute a random variable, normally distributed around zero, an assumption that is consistent with our data (logit-transformed Mn = 0.085, sample std. dv. = 0.81; p = .90, Anderson-Darling normality test).
For every possible difference score, we determined its probability (p) under the null hypothesis of no real change. This involved transforming each score between 0 and 30 to the empirical logit4 and calculating the absolute difference for each combination of scores. Each logit-transformed difference score was then transformed to a z-score (assuming Mn. = 0, SD = .81, the sample SD) and its likelihood under the null hypothesis was estimated by consulting a table of the area under the normal curve. This gave us a (two-tailed) p-value for each difference score, i.e., the probability of seeing a difference this large or larger under the assumption that the null hypothesis is true. The complement of p, 1-p, tells us the probability of seeing a score smaller than the observed score. For clinical purposes, 1-p may be more useful. 1-p captures the intuition that “bigger is better”; the larger the value of 1-p the more one is justified in rejecting the null hypothesis (no real change), in favor of the alternative (real change). Table 5 presents values of 1-p for all possible combinations of scores on the alternative short forms. A note of caution: with small samples such as ours, using the sample standard deviation to estimate the population parameter, as we did here, can introduce bias in the form of overestimation of the rarity of an observed score (Crawford & Howell, 1998).5 Thus, the data in Table 5 should be considered preliminary and used cautiously.
Table 5.
This confidence table displays the probability that an observed difference in PNT30 scores reflects a real change in naming ability (i.e., is not a result of chance.) Probabilities are based on an aphasic normative sample (n = 25; See Table 2, Group 4). Shaded cells represent approximately one standard deviation of change expected due to chance.
| Measurement #2 (PNT30-B) | ||||||||||||||||||||||||||||||||
|---|---|---|---|---|---|---|---|---|---|---|---|---|---|---|---|---|---|---|---|---|---|---|---|---|---|---|---|---|---|---|---|---|
| 0 | 1 | 2 | 3 | 4 | 5 | 6 | 7 | 8 | 9 | 10 | 11 | 12 | 13 | 14 | 15 | 16 | 17 | 18 | 19 | 20 | 21 | 22 | 23 | 24 | 25 | 26 | 27 | 28 | 29 | 30 | ||
| Measurement #1 (PNT30-A) | 0 | 84 | 96 | 99 | 100 | 100 | 100 | 100 | 100 | 100 | 100 | 100 | 100 | 100 | 100 | 100 | 100 | 100 | 100 | 100 | 100 | 100 | 100 | 100 | 100 | 100 | 100 | 100 | 100 | 100 | 100 | |
| 1 | 84 | 50 | 62 | 86 | 93 | 96 | 98 | 99 | 99 | 100 | 100 | 100 | 100 | 100 | 100 | 100 | 100 | 100 | 100 | 100 | 100 | 100 | 100 | 100 | 100 | 100 | 100 | 100 | 100 | 100 | ||
| 2 | 96 | 50 | 35 | 58 | 73 | 83 | 91 | 93 | 95 | 97 | 98 | 99 | 100 | 100 | 100 | 100 | 100 | 100 | 100 | 100 | 100 | 100 | 100 | 100 | 100 | 100 | 100 | 100 | 100 | 100 | ||
| 3 | 99 | 62 | 35 | 27 | 48 | 63 | 74 | 82 | 37 | 91 | 94 | 96 | 97 | 98 | 99 | 99 | 100 | 100 | 100 | 100 | 100 | 100 | 100 | 100 | 100 | 100 | 100 | 100 | 100 | 100 | ||
| 4 | 100 | 86 | 58 | 27 | 23 | 42 | 56 | 67 | 76 | 83 | 87 | 91 | 94 | 96 | 97 | 99 | 98 | 99 | 100 | 100 | 100 | 100 | 100 | 100 | 100 | 100 | 100 | 100 | 100 | 100 | ||
| 5 | 100 | 93 | 73 | 48 | 23 | 20 | 37 | 51 | 62 | 71 | 79 | 84 | 88 | 92 | 93 | 96 | 97 | 98 | 99 | 99 | 100 | 100 | 100 | 100 | 100 | 100 | 100 | 100 | 100 | 100 | ||
| 6 | 100 | 96 | 83 | 63 | 42 | 20 | 18 | 34 | 47 | 58 | 67 | 75 | 81 | 86 | 90 | 93 | 95 | 97 | 93 | 99 | 99 | 100 | 100 | 100 | 100 | 100 | 100 | 100 | 100 | 100 | ||
| 7 | 100 | 98 | 91 | 74 | 56 | 37 | 18 | 17 | 31 | 44 | 55 | 64 | 72 | 79 | 84 | 88 | 91 | 94 | 96 | 97 | 98 | 99 | 100 | 100 | 100 | 100 | 100 | 100 | 100 | 100 | ||
| 8 | 100 | 99 | 93 | 82 | 67 | 51 | 34 | 17 | 15 | 29 | 42 | 53 | 62 | 70 | 77 | 33 | 87 | 91 | 94 | 96 | 97 | 98 | 99 | 100 | 100 | 100 | 100 | 100 | 100 | 100 | ||
| 9 | 100 | 99 | 95 | 87 | 76 | 62 | 47 | 31 | 15 | 14 | 28 | 40 | 51 | 60 | 69 | 75 | 81 | 86 | 90 | 93 | 96 | 97 | 98 | 99 | 100 | 100 | 100 | 100 | 100 | 100 | ||
| 10 | 100 | 100 | 97 | 91 | 83 | 71 | 58 | 44 | 29 | 14 | 14 | 27 | 38 | 49 | 59 | 67 | 75 | 81 | 36 | 90 | 93 | 96 | 97 | 99 | 99 | 100 | 100 | 100 | 100 | 100 | ||
| 11 | 100 | 100 | 98 | 94 | 87 | 79 | 67 | 55 | 42 | 28 | 14 | 14 | 26 | 38 | 48 | 58 | 67 | 74 | 81 | 86 | 90 | 94 | 96 | 98 | 99 | 100 | 100 | 100 | 100 | 100 | ||
| 12 | 100 | 100 | 99 | 96 | 91 | 84 | 75 | 64 | 53 | 40 | 27 | 14 | 13 | 25 | 37 | 48 | 58 | 66 | 74 | 81 | 86 | 91 | 94 | 97 | 98 | 99 | 100 | 100 | 100 | 100 | ||
| 13 | 100 | 100 | 99 | 97 | 94 | 88 | 81 | 72 | 62 | 51 | 38 | 26 | 13 | 13 | 25 | 37 | 48 | 58 | 67 | 75 | 81 | 87 | 91 | 95 | 97 | 98 | 100 | 100 | 100 | 100 | ||
| 14 | 100 | 100 | 100 | 98 | 96 | 92 | 86 | 79 | 70 | 60 | 49 | 38 | 25 | 13 | 13 | 25 | 37 | 48 | 58 | 67 | 75 | 83 | 88 | 93 | 96 | 99 | 99 | 100 | 100 | 100 | ||
| 15 | 100 | 100 | 100 | 99 | 97 | 93 | 90 | 84 | 77 | 69 | 59 | 48 | 37 | 25 | 13 | 13 | 25 | 37 | 43 | 59 | 69 | 77 | 84 | 90 | 93 | 97 | 99 | 100 | 100 | 100 | ||
| 16 | 100 | 100 | 100 | 99 | 98 | 96 | 93 | 88 | 83 | 75 | 67 | 58 | 48 | 37 | 25 | 13 | 13 | 25 | 38 | 49 | 60 | 70 | 79 | 86 | 92 | 96 | 98 | 100 | 100 | 100 | ||
| 17 | 100 | 100 | 100 | 100 | 99 | 97 | 95 | 91 | 87 | 81 | 75 | 67 | 58 | 48 | 37 | 25 | 13 | 13 | 26 | 38 | 51 | 62 | 72 | 81 | 88 | 94 | 97 | 99 | 100 | 100 | ||
| 18 | 100 | 100 | 100 | 100 | 99 | 98 | 97 | 94 | 91 | 86 | 81 | 74 | 66 | 58 | 48 | 37 | 25 | 13 | 14 | 27 | 40 | 53 | 64 | 75 | 84 | 91 | 96 | 99 | 100 | 100 | ||
| 19 | 100 | 100 | 100 | 100 | 100 | 99 | 98 | 96 | 94 | 90 | 86 | 81 | 74 | 67 | 58 | 48 | 38 | 26 | 14 | 14 | 28 | 42 | 55 | 67 | 79 | 87 | 94 | 98 | 100 | 100 | ||
| 20 | 100 | 100 | 100 | 100 | 100 | 99 | 99 | 97 | 96 | 93 | 90 | 86 | 81 | 75 | 67 | 59 | 49 | 38 | 27 | 14 | 14 | 29 | 44 | 58 | 71 | 83 | 91 | 97 | 100 | 100 | ||
| 21 | 100 | 100 | 100 | 100 | 100 | 100 | 99 | 98 | 97 | 96 | 93 | 90 | 86 | 81 | 75 | 69 | 60 | 51 | 40 | 28 | 14 | 15 | 31 | 47 | 62 | 76 | 87 | 95 | 99 | 100 | ||
| 22 | 100 | 100 | 100 | 100 | 100 | 100 | 100 | 99 | 98 | 97 | 96 | 94 | 91 | 87 | 83 | 77 | 70 | 62 | 53 | 42 | 29 | 15 | 17 | 34 | 51 | 67 | 82 | 93 | 99 | 100 | ||
| 23 | 100 | 100 | 100 | 100 | 100 | 100 | 100 | 100 | 99 | 98 | 97 | 96 | 94 | 91 | 88 | 84 | 79 | 72 | 64 | 55 | 44 | 31 | 17 | 18 | 37 | 56 | 74 | 91 | 98 | 100 | ||
| 24 | 100 | 100 | 100 | 100 | 100 | 100 | 100 | 100 | 100 | 99 | 99 | 98 | 97 | 95 | 93 | 90 | 86 | 81 | 75 | 67 | 58 | 47 | 34 | 18 | 20 | 42 | 63 | 83 | 96 | 100 | ||
| 25 | 100 | 100 | 100 | 100 | 100 | 100 | 100 | 100 | 100 | 100 | 99 | 99 | 98 | 97 | 96 | 93 | 92 | 88 | 64 | 79 | 71 | 62 | 51 | 37 | 20 | 23 | 48 | 73 | 93 | 100 | ||
| 26 | 100 | 100 | 100 | 100 | 100 | 100 | 100 | 100 | 100 | 100 | 100 | 100 | 99 | 99 | 98 | 97 | 96 | 94 | 91 | 87 | 83 | 76 | 67 | 56 | 42 | 23 | 27 | 58 | 86 | 100 | ||
| 27 | 100 | 100 | 100 | 100 | 100 | 100 | 100 | 100 | 100 | 100 | 100 | 100 | 100 | 100 | 99 | 99 | 98 | 97 | 96 | 94 | 91 | 87 | 82 | 74 | 63 | 48 | 27 | 35 | 62 | 99 | ||
| 28 | 100 | 100 | 100 | 100 | 100 | 100 | 100 | 100 | 100 | 100 | 100 | 100 | 100 | 100 | 100 | 100 | 100 | 99 | 99 | 98 | 97 | 95 | 93 | 91 | 83 | 73 | 53 | 35 | 50 | 96 | ||
| 29 | 100 | 100 | 100 | 100 | 100 | 100 | 100 | 100 | 100 | 100 | 100 | 100 | 100 | 100 | 100 | 100 | 100 | 100 | 100 | 100 | 100 | 99 | 99 | 98 | 96 | 93 | 86 | 62 | 50 | 84 | ||
| 30 | 100 | 100 | 100 | 100 | 100 | 100 | 100 | 100 | 100 | 100 | 100 | 100 | 100 | 100 | 100 | 100 | 100 | 100 | 100 | 100 | 100 | 100 | 100 | 100 | 100 | 100 | 100 | 99 | 96 | 84 | ||
An example will help explain Table 5. Suppose that a clinician wants to measure change in naming before and after a 3-week treatment program. The clinician administers PNT30-A before treatment, and PNT30-B after treatment, and finds that the score improves from 15 to 21. Table 5 shows that these scores intersect in a cell whose value is 69, indicating that 1-p = .69 (and therefore p is .31). Now imagine that the observed improvement is greater, say from 15 to 26. The corresponding value in the table is 97, indicating that 1-p = .97 (and therefore p is .03). Whereas before, the clinician could be 69% confident that the null hypothesis was false, and hence the change real, now she or he can be 97% confident. We selected these examples to make a point: 97% exceeds the 95% confidence level researchers typically set as the criterion for rejecting the null hypothesis. 95% represents change approximately at the level of 2 standard deviations from the mean of the reference population; 69% represents change at about the 1 SD level. We believe that the 1 SD level represents a potentially useful reference point, and for this reason we have shaded these cells in the table. We will return to this issue in the General Discussion.
General Discussion
There is great interest within the scientific community in translating research tools into clinical practice; and in the case of aphasic naming impairments, the Philadelphia Naming Test offers just such an opportunity. The PNT was constructed to represent the types of concrete nouns most commonly used in everyday speech, with most targets having high frequency and few phonemes. Importantly, all targets have high familiarity and are expected to fall within a subject’s pre-morbid naming vocabulary. Moreover, the existence of large PNT research datasets allows for the evaluation of individual scores against the data from a substantial aphasia cohort. The major impediment to this test’s clinical usage has been its considerable length, and so we developed short forms. Using archived data from a large patient sample, we identified two 30-item subsets of the PNT that provide very similar results to the full test, and we then demonstrated the reliability of these measures across independent test administrations.
PNT scores correlate highly with other clinical diagnostic measures. For example, the measured correlation between WAB AQ (.85; see Table 1) corresponds to an R2 of .73, meaning that the two measures share 73% of their variance. This strong relationship was not simply driven by the object naming portion of the WAB; in a stepwise multiple linear regression analysis, the comprehension and fluency subscores of the WAB were both significantly related to PNT accuracy, together accounting for 56% of the variance. We also found a significant relationship between PNT and stroke lesion volume, with 17% shared variance. Importantly, in this large and diverse sample of patients, PNT did not correlate with age, education, gender, or race. After controlling for lesion volume with regression, these combined variables accounted for only 2% additional variance in PNT scores, without significantly improving the model.6 Essentially, we found that the PNT specifically measures damage to neurological language systems in aphasia, regardless of the pre-morbid demographic factors examined within the scope of this study.
In order for clinicians to capitalize on the PNT’s potential, we constructed two shorter versions of the test. Our investigations demonstrated that accuracy scores on the short forms can be used to reliably estimate PNT scores, which can then be translated into percentile rankings relative to a large cohort of aphasic research participants. We provided a table (Table 4) that allows one to look up these estimates for all possible scores on PNT30.
There are several limitations that should be kept in mind when using the norms. It is important to remember that the normative group, while highly diverse, is not all-encompassing. The group consists of aphasic individuals who volunteered to participate in research after a stroke, who were mostly in the chronic stage and capable of naming at least one PNT item correctly. Acute and hyperacute patients are not represented in the sample, and neither are chronic patients at the extremes of the severity scale (i.e., the most severely impaired do not meet the inclusion criteria, while those who have recovered fully do not tend to participate in research). Finally, naming deficits that do not arise from stroke-related aphasia are not represented. Therefore, the values presented in the norms should be interpreted cautiously. For example, an acute patient who scores 15 on one of the short forms is in the 21st percentile for the chronic sample that yielded the norms (see Table 4). One can assume that the percentile rank would be higher (better) if this patient’s performance were evaluated against that of other acute patients. We hope that this study will spawn future research that expands the norms to other currently underrepresented patients.
The careful selection of item sets succeeded in producing short form versions of the PNT that correlated highly with each other and with the full PNT in both the virtual and live tests. In particular, the data obtained in Study 2 justified the assumption that differences between PNT30-A and PNT30-B are normally distributed around zero within the chronic population. Consequently, we were able to estimate the likelihood of any measured difference under the null hypothesis of no real change. The likelihood estimates displayed in Table 5 are meant to help guide research and clinical decisions. The caveat here is that estimates were derived from a small group (n = 25), albeit one that represented the full range of naming severity.
The shading of 1 SD cells in Table 5 is meant only as a reference point for those interested in using 1 SD as a criterion for rejecting the null hypothesis, in favor of the alternative (real change). While this criterion is less conservative than the traditional 95% confidence level, the relaxation of control for Type I errors (i.e., false positives) may be appropriate for clinical purposes (Crawford & Howell, 1998). Specifically, a clinician may feel that it is better to overestimate the efficacy of treatment (Type I error) and continue treating individuals who are not actually responding, rather than underestimate efficacy (Type II error) and stop treatment for those who actually are responding. Moreover, one might choose to adopt the more lenient confidence level to partially adjust for the use of 2-tailed p-values, which may be overly conservative in treatment contexts that carry a clear expectation for the direction of change. It should be appreciated, however, that Table 5 does not in any way constrain the choice of criterion confidence level, i.e., the table’s shading can simply be ignored.
To this point, our focus has been entirely on accuracy scores, which is the type of data most often used by clinicians to assess naming. The standard PNT scoring scheme additionally codes for various types of naming errors, and this provides useful information for clinical as well as research purposes. At the heart of the scoring scheme is the widely-recognized distinction between semantic errors, which are related to the target by meaning, and phonological errors, which are related to it by sound. We collapsed the semantic and mixed categories from the PNT taxonomy to produce a measure of semantically related errors (S), and we collapsed the formal and nonword categories to produce a measure of phonologically related errors (P). We found that the rates of S and P (logit transformed) were quite consistent across PNT administrations (r = .88 and .87 for semantic and phonological errors, respectively). However, because there tend to be many fewer responses coded as S or as P, compared to correct responses, the reduction in items on the short form had much greater impact on the reliability of these effects. For S, the value of the Pearson correlation between the short forms and PNT was .49 and .54 for PNT30-A and PNT30-B, respectively (p < .013 for both). For P, the respective values were .57 and .86 (p < .003 for both). The stronger correlations for P probably reflect the fact that these occur at higher rates than S in our sample, and therefore are more robust. While the short forms may provide an adequate screening for strongly biased error patterns, for detailed analyses of errors, the full PNT is recommended.
In conclusion, this study generated two alternative short form PNT tests, along with norms that can be used to diagnose the severity of a naming deficit and measure spontaneous or treatment-related change. It is our hope these tools will prove useful to the clinical community and will foster more and larger normative studies, and more research on the treatment of lexical access disorders in aphasia and other clinical populations.
Acknowledgements
We would like to thank Rachel Jacobson and Jennifer Gallagher, who recruited patients and collected data, and Gary S. Dell and Daniel Mirman, who provided us with thoughtful suggestions regarding data analysis and publication. This research was supported by a grant from the NIH/NIDCD #DC000191-29 (M. Schwartz, PI).
Appendix 1. Item Analysis Methods
Transforming a 175-item test into one with only 30 items inevitably entails a reduction in sensitivity, so prior to the item analysis, we eliminated from contention items that we considered imperfect in some respect. Thirty-three items were eliminated because they yielded high rates of omissions in the group of 94 participants (Table 2, Group2). Since omission errors were not treated as a separate error category in the creation of response distributions (see below; and for discussion, Dell, Lawler, Harris, & Gordon, 2004), frequent omissions could introduce some distortion in profile. An additional 22 items were eliminated because the responses of some control subjects suggested that they perceived there was a reasonable alternative to the target. [Note: Insofar as this identifies a problem in recognizability or name agreement, it constitutes a very conservative criterion. We know from previous work that every PNT item passed an 85% accuracy cut-off (Roach et al., 1996) and that healthy control participants averaged around .97 correct on the overall test (Kittredge et al., 2008)].
The remaining 120 PNT items were subjected to further analysis based on their response distributions. For a given item, the response distribution is the proportion of participants who responded with the correct name (C) and with each of five error types: semantic (S), formal (F), mixed (M), unrelated (U), nonword (N). For a given participant, the response profile is the proportion of PNT responses in each of these six categories, relative to the sum of the responses in those categories (i.e., the “normalized” response proportion; see Dell et al., 2004). As discussed in the text, the motivation for the item response distribution analysis is the finding that naming accuracy has a reliable impact on the types of errors that are produced (Dell et al., 1997; Schwartz et al., 2006). We therefore aimed to select items for the short form that preserved the response profile at different levels of accuracy.
The 94 participants were stratified into 5 groups based on PNT accuracy, with 8, 12, 8, 30, and 36 patients per group, from lowest to highest accuracy. The uneven group sizes resulted from our limited sampling ability; however, there were enough participants in each group to provide at least some estimate of each item's value. Item by item, we generated a response distribution for each of the 5 accuracy groups, by calculating the proportion of group participants whose response to that item was a C, S, F, etc. In addition, a response profile was created for each group by averaging response profiles across the group’s participants. We then compared each item response distribution to the group response profile, with the discrepancy quantified by root mean square deviation (RMSD). This yielded 5 RMSD values per item, one for each accuracy group. RMSD values were converted to z-scores within each accuracy group, and then each item’s standardized RMSD values were averaged to produce a value representing an item’s overall tendency to elicit the typical responses of the 5 groups. The average RMSD statistic effectively measured the amount of discrepancy between the item's responses and the full test's responses, allowing us to quantify the effect that is qualitatively labeled in Figure 2, as "good" to "bad”. This single parameter was the final product of our item analysis, and it was used to rank items for selection.
APPENDIX 2
| PNT30-A | ||||
|---|---|---|---|---|
| ITEM | WORD | FREQ7 | PHON | CATEGORY |
| 1 | wagon | 1.0414 | 5 | toy |
| 2 | monkey | 1.2553 | 5 | mammal |
| 3 | spoon | 1.1761 | 4 | object |
| 4 | ring | 1.6902 | 3 | miscellaneous |
| 5 | hammer | 1.0414 | 5 | object |
| 6 | crown | 1.3802 | 4 | miscellaneous |
| 7 | ghost | 1.4914 | 4 | miscellaneous |
| 8 | turkey | 0.699 | 5 | non-mammal |
| 9 | hat | 1.8325 | 3 | clothing |
| 10 | pumpkin | 0.301 | 7 | vegetable |
| 11 | baby | 2.4116 | 4 | person |
| 12 | scissors | 0.6021 | 6 | object |
| 13 | tent | 1.6435 | 4 | structure |
| 14 | squirrel | 0.7782 | 7 | mammal |
| 15 | foot | 2.5132 | 3 | body part |
| 16 | candle | 1.2041 | 6 | furnishing |
| 17 | leaf | 1.9085 | 3 | nature |
| 18 | pillow | 1.2788 | 4 | furnishing |
| 19 | bread | 1.8692 | 4 | food |
| 20 | owl | 0.8451 | 2 | non-mammal |
| 21 | hair | 2.2989 | 3 | body part |
| 22 | clown | 0.6021 | 4 | person |
| 23 | hose | 0.6021 | 3 | object |
| 24 | kitchen | 2.0453 | 5 | structure |
| 25 | strawberries | 0.7782 | 8 | fruit |
| 26 | calendar | 0.9031 | 8 | miscellaneous |
| 27 | bus | 1.8976 | 3 | vehicle |
| 28 | sock | 1.2553 | 3 | clothing |
| 29 | dice | 0.301 | 3 | toy |
| 30 | basket | 1.3802 | 6 | object |
| PNT30-B | ||||
| ITEM | WORD | FREQ | PHON | CATEGORY |
| 1 | thermometer | 0.7782 | 10 | object |
| 2 | piano | 1.4314 | 5 | miscellaneous |
| 3 | queen | 1.7243 | 4 | person |
| 4 | butterfly | 1 | 8 | non-mammal |
| 5 | sandwich | 1 | 7 | food |
| 6 | bone | 1.8388 | 3 | body part |
| 7 | king | 1.9956 | 3 | person |
| 8 | vest | 0.8451 | 4 | clothing |
| 9 | skull | 1.3222 | 4 | body part |
| 10 | horse | 2.1206 | 4 | mammal |
| 11 | rake | 0.301 | 3 | object |
| 12 | drum | 1.2041 | 4 | toy |
| 13 | table | 2.3711 | 5 | furnishing |
| 14 | pig | 1.6335 | 3 | mammal |
| 15 | camera | 1.5563 | 6 | object |
| 16 | flower | 1.9685 | 6 | nature |
| 17 | cane | 1 | 3 | miscellaneous |
| 18 | house | 2.7825 | 3 | structure |
| 19 | duck | 1.1461 | 3 | non-mammal |
| 20 | apple | 1.4771 | 4 | fruit |
| 21 | skis | 0.9031 | 3 | miscellaneous |
| 22 | door | 2.5866 | 3 | structure |
| 23 | carrot | 0.9031 | 5 | vegetable |
| 24 | whistle | 0.9542 | 5 | toy |
| 25 | tractor | 1.0414 | 7 | vehicle |
| 26 | glove | 1.2788 | 4 | clothing |
| 27 | desk | 1.959 | 4 | furnishing |
| 28 | saw | 0 | 2 | object |
| 29 | anchor | 0.7782 | 5 | miscellaneous |
| 30 | pencil | 1.2788 | 6 | object |
Footnotes
Currently, the web-based MAPPD only provides psycholinguistic measures and does not provide data from medical imaging.
The number of items (30) was determined to satisfy constraints imposed by both administration time and measurement accuracy. With a presentation rate of 1 item per 10 seconds, the test can be administered in approximately 5 minutes. In addition, the procedure used to construct the PNT30 required enough items to maintain the distributions of multiple item parameters, and we found that 30 items was sufficient for this purpose.
The PNT scoring guidelines call for the scoring of the first complete response, and our experience suggested that in the vast majority of cases, these occur well within a 10 second window. To confirm this, we evaluated the impact of the shortened naming deadline in 11 aphasic participants with characteristics similar to the MAPPD cohort. Of the responses that were scored correct at the 30 second deadline, 98.5% on average (range: 94.6–100%) were correct at 10 seconds.
For dichotomous data, variance is lower on the ends of the scale and higher in the middle. The logit transformation provides a simple way to homogenize variance across the scale; however, because this transformation involves an assumption about the distribution of variance, it is possible that significance is overestimated near the ends of the scale and underestimated in the middle.
With small normative samples, Crawford and Howell (1998) recommend using modified t-scores in place of z. Applying their formula, we recalculated all the probabilities in Table 5 and found that virtually nothing changed. Since the standard procedure is more familiar, we have chosen to present it here for the sake of simplicity.
Months post-stroke by itself was not significantly correlated with PNT scores; however, after controlling for lesion volume with regression, it accounted for 5% additional variance, representing a significant improvement to the model. Thus, recovery was present but contributed weakly to PNT scores over a span of 1 to 381 months. In our smaller, longitudinal sample of 25 patients who, for selection purposes, performed the PNT at least 6 months apart, mild recovery was also observed over the interval prior to enrollment (paired t = 2.3, 2-tailed p = .03). In both cases, it is unknown whether recovery was spontaneous or therapy-driven, as this information was not collected; however, the important point for the purpose of normative comparison is that no significant changes were detected in PNT accuracy over the test-retest interval of one week.
Log frequency values from the CELEX database (Baayen et al., 1993).
References
- Abel S, Huber W, Dell GS. Connectionist diagnosis of lexical disorders in aphasia. Aphasiology. 2009;23(11):1–26. [Google Scholar]
- Baayen RH, Piepenbrock R, Van Rijn H. The CELEX lexical database. Philadelphia: University of Pennsylvania, Linguistic Data Consortium; 1993. [Google Scholar]
- Butterworth B. Lexical access in speech production. In: Marslen-Wilson W, editor. Lexical representation and process. Cambridge, MA: MIT Press; 1989. pp. 108–135. [Google Scholar]
- Caplan D, Vanier M, Baker C. A case study of reproduction conduction aphasia: I. Word production. Cognitive Neuropsychology. 1986;3(1):99–128. [Google Scholar]
- Caramazza A, Hillis AE. Where do semantic errors come from? Cortex. 1990;26(1):95–122. doi: 10.1016/s0010-9452(13)80077-9. [DOI] [PubMed] [Google Scholar]
- Crawford JR, Howell DC. Comparing an individual's test score against norms derived from small samples. The Clinical Neuropsychologist. 1998;12(4):482–486. [Google Scholar]
- Dell GS. A spreading-activation theory of retrieval in sentence production. Psychological Review. 1986;93(3):283–321. [PubMed] [Google Scholar]
- Dell GS, Lawler EN, Harris HD, Gordon JK. Models of errors of omission in aphasic naming. Cognitive Neuropsychology. 2004;21(2–4):125–145. doi: 10.1080/02643290342000320. [DOI] [PubMed] [Google Scholar]
- Dell GS, Martin N, Schwartz MF. A case-series test of the interactive two-step model of lexical access: Predicting word repetition from picture naming. Journal of Memory and Language. 2007;56(4):490–520. doi: 10.1016/j.jml.2006.05.007. [DOI] [PMC free article] [PubMed] [Google Scholar]
- Dell GS, Schwartz MF, Martin N, Saffran EM, Gagnon DA. Lexical access in aphasic and nonaphasic speakers. Psychological Review. 1997;104:801–838. doi: 10.1037/0033-295x.104.4.801. [DOI] [PubMed] [Google Scholar]
- del Toro CM, Bislick LP, Comer M, Velozo C, Romero S, Gonzales Rothi LJ, et al. Development of a short form of the Boston Naming Test for individuals with aphasia. Journal of Speech, Language, and Hearing Research. 2011;54:1089–1100. doi: 10.1044/1092-4388(2010/09-0119). [DOI] [PubMed] [Google Scholar]
- Garrett MF. Levels of processing in sentence production. In: Butterworth B, editor. Language Production. Vol. 1. London: Academic Press; 1980. pp. 177–220. [Google Scholar]
- Hawkins KA, Bender S. Norms and the relationship of Boston Naming Test performance to vocabulary and education; A review. Aphasiology. 2002;16(12):1143–1153. [Google Scholar]
- Herbert R, Hickin J, Howard D, Osborne F, Best W. Do picture-naming tests provide a valid assessment of lexical retrieval in conversation in aphasia? Aphasiology. 2008;22(2):184–203. [Google Scholar]
- Kaplan E, Goodglass H, Weintraub S. The Boston Naming Test. Philadelphia: Lea & Febiger; 1983. [Google Scholar]
- Kittredge AK, Dell GS, Verkuilen J, Schwartz MF. Where is the effect of frequency in word production? Insights from aphasic picture naming errors. Cognitive Neuropsychology. 2008;25(4):463–492. doi: 10.1080/02643290701674851. [DOI] [PMC free article] [PubMed] [Google Scholar]
- Kertesz A. Western Aphasia Battery. New York: Grune & Stratton; 1982. [Google Scholar]
- Levelt WJM, Roelofs A, Meyer AS. A theory of lexical access in speech production. Behavioral and Brain Sciences. 1999;22:1–75. doi: 10.1017/s0140525x99001776. [DOI] [PubMed] [Google Scholar]
- Martin N, Dell GS, Saffran EM, Schwartz MF. Origins of paraphasias in deep dysphasia – Testing the consequences of a decay impairment to an interactive spreading activation model of lexical retrieval. Brain and Language. 1994;47(4):609–660. doi: 10.1006/brln.1994.1061. [DOI] [PubMed] [Google Scholar]
- McCullagh P, Nelder J. Generalized linear models. London: Chapman and Hall; 1989. [Google Scholar]
- Mirman D, Strauss TJ, Brecher A, Walker GM, Sobel P, Dell GS, et al. A large, searchable, web-based database of aphasic performance on picture naming and other tests of cognitive function. Journal of Cognitive Neuropsychology. 2010;27(6):495–504. doi: 10.1080/02643294.2011.574112. [DOI] [PMC free article] [PubMed] [Google Scholar]
- Nickels L, Howard D. Aphasic naming: What matters? Neuropsychologia. 1995;33(10):1281–1303. doi: 10.1016/0028-3932(95)00102-9. [DOI] [PubMed] [Google Scholar]
- Oldfield RC. The assessment and analysis of handedness: The Edinburgh Inventory. Neuropsychologia. 1971;9(1):97–113. doi: 10.1016/0028-3932(71)90067-4. [DOI] [PubMed] [Google Scholar]
- Rapp BC, Goldrick M. Discreteness and interactivity in spoken word production. Psychological Review. 2000;107(3):460–499. doi: 10.1037/0033-295x.107.3.460. [DOI] [PubMed] [Google Scholar]
- Roach A, Schwartz MF, Martin N, Grewal RS, Brecher A. The Philadelphia Naming Test: Scoring and rationale. Clinical Aphasiology. 1996;24:121–133. [Google Scholar]
- Ross TP, Lichtenberg PA, Christensen BK. Normative data on the Boston Naming Test for elderly adults in a demographically diverse medical sample. The Clinical Neuropsychologist. 1995;9(4):321–325. [Google Scholar]
- Schwartz MF, Brecher A, Whyte JW, Klein MG. A patient registry for cognitive rehabilitation research: A strategy for balancing patients' privacy rights with researchers' need for access. Archives of Physical Medicine and Rehabilitation. 2005;86(9):1807–1814. doi: 10.1016/j.apmr.2005.03.009. [DOI] [PubMed] [Google Scholar]
- Schwartz MF, Dell GS, Martin N, Gahl S, Sobel P. A case-series test of the interactive two-step model of lexical access: Evidence from picture naming. Journal of Memory and Language. 2006;54:228–264. doi: 10.1016/j.jml.2006.05.007. [DOI] [PMC free article] [PubMed] [Google Scholar]
- Shapiro K, Caramazza A. Grammatical processing of nouns and verbs in left frontal cortex? Neuropsychologia. 2003;41(9):1189–1198. doi: 10.1016/s0028-3932(03)00037-x. [DOI] [PubMed] [Google Scholar]
- Ventry IM, Weinstein BE. Identification of elderly people with hearing problems. American Speech Language Hearing Association. 1983;25:37–42. [PubMed] [Google Scholar]
- Zec RF, Burkett NR, Markwell SJ, Larsen DL. A cross-sectional study of the effects of age, education, and gender on the Boston Naming Test. The Clinical Neuropsychologist. 2007;21:587–616. doi: 10.1080/13854040701220028. [DOI] [PubMed] [Google Scholar]


