

Abstract
The connection between membrane inhomogeneity and the structural basis of lipid rafts has sparked interest in the lateral organization of model lipid bilayers of two and three components. In an effort to investigate anisotropic lipid distribution in mixed bilayers, a self-consistent mean-field theoretical model is applied to palmitoyloleoylphosphatidylcholine (POPC)–palmitoyl sphingomyelin (PSM)–cholesterol mixtures. The compositional dependence of lateral organization in these mixtures is mapped onto a ternary plot. The model utilizes molecular dynamics simulations to estimate interaction parameters and to construct chain conformation libraries. We find that at some concentration ratios the bilayers separate spatially into regions of higher and lower chain order coinciding with areas enriched with PSM and POPC, respectively. To examine the effect of the asymmetric chain structure of POPC on bilayer lateral inhomogeneity, we consider POPC-lipid interactions with and without angular dependence. Results are compared with experimental data and with results from a similar model for mixtures of dioleoylphosphatidylcholine, steroyl sphingomyelin, and cholesterol.
I. INTRODUCTION
The membranes of cells are composed of a variety of amphipathic lipids that spontaneously form bilayers in the presence of water. In nature, the lipids of typical plasma membranes vary by head group, chain length, and chain saturation. The exact composition, as well as external factors such as temperature and pressure, strongly affect the properties of the membrane, so many experiments have been aimed at characterizing model lipid bilayers of different compositions as a function of these external factors [1–28]. In particular, the lateral organization of ternary-component mixtures has been of recent interest because they contain essential ingredients for the formation of lipid rafts under the right conditions. Lipid rafts have been the subject of a number of reviews [29–35], where they are described as nanometer-scale sphingolipid and cholesterol-enriched domains whose importance ranges from signal transduction to organization of bioactivity in cell membranes.
Bilayers composed of a single lipid type can undergo a main-chain phase transition between a liquid disordered phase lα and a gel phase s0 as a phase transition temperature Tm, unique to the lipid type, is traversed. The lα phase is characterized by highly mobile lipids with disordered chains, while in the s0 state the lipids are much less mobile and their chains are more ordered.
A side-by-side comparison of two bilayers of nearly identical composition, with only a minor difference such as the presence of a double bond in one of the lipid chains, can underscore the complex nature of real cell membranes. For example, dioleoylphosphatidylcholine (DOPC) has two monounsaturated 18-carbon fatty acid chains, while in palmitoyloleoylphosphatidylcholine (POPC) one of those chains is replaced by a 16-carbon saturated chain. As a result, the DOPC main-chain phase transition temperature is lower than that of the POPC temperature by 26°C. Additionally, the area per lipid of POPC bilayers, 65Å2 [36], is significantly lower than that of DOPC bilayers, 72Å2 [37]. The presence or absence of the double bond clearly plays a role in how well neighboring lipids pack with each other, which in turn determines the physical properties of the bilayer.
Binary mixtures of low-Tm phosphatidylcholines and high-Tm phosphatidylcholines or sphingomyelin (SM) can exhibit phase separation between the lα phase and s0 phase at temperatures intermediate to their respective melting points [1,27,38,39]. The phase coexistence depends on the relative concentrations of each lipid type and can be observed directly in fluorescence microscopy experiments [1,38].
Cholesterol (CHOL), another major membrane lipid, has a strong and complex effect on bilayer properties. CHOL has a tendency to induce order in the chains of lα-phase lipid bilayers and to increase the mobility of s0-phase lipid bilayers. When the CHOL concentration is above about 15%, the resulting structural state is sometimes called the liquid ordered phase, l0, and is characterized by highly ordered yet mobile chains. The phase behavior of binary mixtures of CHOL and other membrane lipids has been studied extensively [27,40–44]. Pan et al. [45] found that CHOL-lipid interactions depend on the number of saturated chains present, affecting physical properties such as bending modulus, area per lipid, and order parameter. Other studies [6,26,28,46] indicated that CHOL has a higher affinity for one lipid type over another, for example dipalmitoyl phosphatidylcholine (DPPC) or disaturated SM over POPC. CHOL shows a unique level of specificity in inducing order because the two faces of CHOL are structurally distinct. Here, “face” refers to the sides of the flat fused ring structure of CHOL, one of which has protruding methyl groups (rough β face), while the other does not (smooth α face). Pandit et al. [47] used atomic-level simulations of lipid-CHOL mixtures to reveal that the effective molecular area of CHOL is smaller in POPC than in DOPC and even in DPPC. They attribute this effect to a combination of the anisotropic chain structure of POPC and the anisotropic faces of CHOL.
This differential behavior of CHOL in lipids must have a strong effect on the lateral organization of ternary-component mixtures consisting of a high-Tm lipid, a low-Tm lipid, and CHOL. Experiments [1,21,24,25,27,48,49] consistently indicate that these ternary-component mixtures have a complex lateral structure that is highly dependent on the relative abundance of components and external parameters such as temperature and pressure. In particular, at certain concentration ratios, the liquid phases lα and l0 are known to coexist and are the basis for the concept of “lipid rafts,” which are believed to exist in biological plasma membranes [32,34,35,50] and are implicated in a number of biologically important cellular functions (see, e.g., [30,33]).
A number of experimental treatments of ternary mixtures have been published [2–23,51], but the details on the formation of rafts in POPC-SM-CHOL mixtures remain a subject of debate. A number of experimental studies have treated specifically this system [21,24–28,50]. Veatch and Keller [1] reported liquid-liquid phase coexistence in giant unilamellar vesicles using fluorescence microscopy. Zhao et al. [15] did not observe liquid-liquid phase separation in POPC-SM-CHOL mixtures at the micron level. They did observe ld and s0 phase coexistence and suggested that domains may exist in smaller submicron clusters. Overall, current experimental studies underscore a need to carefully probe subtle atomic-level effects in the POPC-SM-CHOL ternary system.
Several recent theoretical models have been published that describe bilayer phase behavior in three-component systems. Putzel et al. [52,53] proposed a phenomenological model intended to elucidate the mechanism for phase separation in ternary lipid systems by examining phenomenological free-energy functions for mixtures consisting of saturated-chain lipids, unsaturated-chain lipids, and CHOL. They were able to reproduce ternary phase diagrams that are consistent with those proposed by experiment. Elliot et al. [54,55] proposed a self-consistent mean-field theoretical (SCMFT) model of a three-component system that treats chain interactions at an atomic level. The model employs equilibrium statistical mechanical analysis to construct ternary diagrams with phase boundaries whose presence and location are modulated by interaction parameters. We recently published a model for ternary lipid mixtures that we applied specifically to DOPC– steroyl sphingomyelin (SSM)–CHOL bilayers [56]. The model projected three-dimensional lipid bilayer leaflets onto two-dimensional fields of chain order over which CHOL could diffuse. This model, based on a combination of equilibrium statistical mechanics and Langevin plus Cahn-Hilliard dynamics, described temporal organization of the mixed bilayer. Results were displayed on a triangle diagram that agreed well with experiment for DOPC-SM-CHOL mixtures.
In this paper we present a model of ternary-component lipid bilayers that builds on our previous modeling work [43,44,56,57] to include lipids with nonidentical chains. This model differs from other computational and theoretical models [52–55,58–65] in that it utilizes atomistic molecular dynamics (MD)-generated data as input to a SCMFT model that is used to characterize the structure and temporal evolution of ternary phase diagrams. We apply the model to POPC–palmitoyl sphingomyelin (PSM)–CHOL mixtures, but the methodology can be generalized to include any two-chain lipid ternary mixture. To account for the asymmetric chain structure of the POPC molecule, an orientational component for POPC is added to the interaction energy function. We show below that the effect of including orientational dependence is to slightly amplify the separation of lipids into regions rich in PSM separated from regions rich in POPC. Comparison with our SCMFT simulations of DOPC-SSM-CHOL [56] reveals that the degree of lateral organization in POPC-PSM-CHOL mixtures is reduced, and differences between order parameters in separated domains are more subtle. In Sec. II, the POPCPSM-CHOL ternary system is described. Subsequent sections present our results and discussion.
II. THEORETICAL MODEL
In our SCMFT model [43,44,56,57], a three-dimensional lipid bilayer leaflet is cast as a two-dimensional field of weighted, chain-averaged order parameters:
| (1) |
where the weighting fraction represents the fraction of dihedrals in a trans configuration (ntr) along a single chain to the number of dihedrals along that chain (ns); βm is the angle between the C-H bond vector and the bilayer normal for carbon m for the chain at the position . CHOL molecules are treated as two-dimensional “rods” that are free to diffuse through the order parameter field. Coupled to this order parameter field is a composition field whose purpose is to identify the concentration of lipid type at any point. Both fields are discretized onto an underlying lattice for computation. The overall model methodologies are as follows: Langevin dynamics are used to propagate CHOL molecules over the two-dimensional fields and to locally reorient POPC molecules. Although both POPC and PSM have identical phosphocholine groups, there are significant differences between the POPC glycerol region and the PSM sphingosine backbone that are modeled through the concentration field coupling [66]. Cahn-Hilliard dynamics are used to model the conservative evolution of lateral compositional order in the composition field. Mean-field statistical mechanics is employed to recalculate the order parameter field after each dynamical time step. These methods are described in the following subsections.
A. The POPC-PSM-CHOL ternary system
The structures of POPC and PSM are shown in Fig. 1. POPC has two nonidentical hydrocarbon chains: one saturated palmitoyl (16:0) chain and one unsaturated oleoyl (18:1) chain. PSM [(16:0)SM] consists of a palmitoyl chain attached to a sphingosine backbone. PSM has a higher main-chain phase transition temperature (40°C) [67] than POPC (−3°C). For this model, we focus on the temperature range intermediate to the two phase transition temperatures, namely 30°C.
FIG. 1.
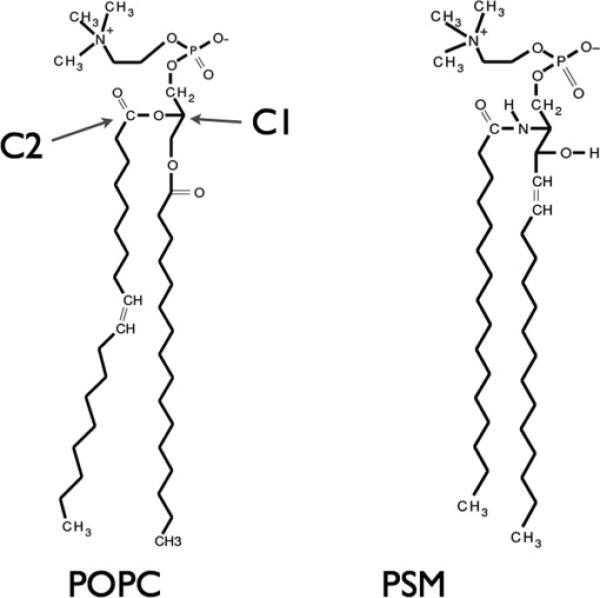
The structures of POPC and PSM. The labeled arrows indicate specific atoms used to define POPC molecular orientation.
In contrast to our previous implementation of the SCMFT model [56] for DOPC-SSM-CHOL mixtures, we now consider a case where the low-melting-point lipid, POPC, has nonequivalent acyl chains. To address the nonequivalence of POPC chains, we consider the effect of adding an orientation degree of freedom to each POPC molecule, as we describe below. Modifications to the previous model [56] include redefining the order parameter, making adjustments to the Hamiltonian and mean-field free energy, and modifying the method of updating time steps. The modifications are summarized in the following subsections.
B. Order parameter field and angle field
The SCMFT model [43,44,56,57] we previously applied to binary and ternary mixtures of lipids with two chains of identical structure projected single-chain order parameters onto a two-dimensional lattice. Lattice grid sites were spaced at a distance calculated from MD simulations as the average distance between two neighboring chains. To incorporate the asymmetric structure of POPC molecules, we now define a “whole-molecule” order parameter for each site as an average:
| (2) |
where ssn1 and ssn2 are the order parameters for the two chains on each molecule, as defined in Eq. (1). In this work, we take the lattice spacing to be the average nearest-neighbor center-of-mass distance between molecules. Although the two chains in PSM do not differ appreciably in order parameter value, PSM molecular order parameters are also calculated using Eq. (2) to keep the model internally consistent.
In order to incorporate the asymmetric structure of POPC molecules, a molecular orientation variable, ρ, is introduced and is associated with each lattice point that contains all or part of a POPC in the local concentration field. For a POPC molecule, ρ is calculated as the angle made between a vector which points from the atom labeled c1 toward the atom labeled c2 in Fig. 1 and a fixed direction in the plane of the bilayer (Fig. 2).
FIG. 2.
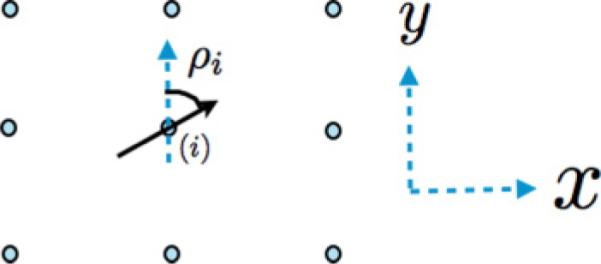
(Color online) The angle ρ for a POPC molecule at site i. The black solid arrow represents the orientation vector of the lipid at site i, pointing from the saturated chain of POPC toward the unsaturated chain. We measure the angle ρ with respect to the y direction of the x–y axis of the lattice.
The angle field is assumed to evolve dynamically according to a Langevin equation:
| (3) |
where Mρ is the mobility of the angle as it diffuses azimuthally at the site i and is related to the diffusion constant by Mρ = Dρ/kbT; F is the free energy, shown below, and ξi is a stochastic noise component that satisfies fluctuation and dissipation relations.
The diffusion constant Dρ is found by performing statistical analysis on measurements of the angle ρ calculated directly from molecular dynamics simulations. This angle is recalculated after a nanosecond of simulation has passed. Figure 3 shows a distribution plot of trajectory-averaged changes in the orientation angle after 1-ns intervals for all of the POPC molecules in a MD simulation (details of the simulation are discussed below), revealing an approximately Gaussian distribution.
FIG. 3.
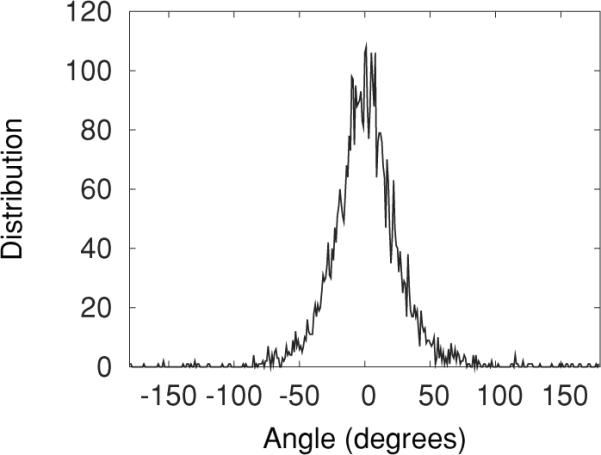
Distribution of the change in angle after 1 ns for MD-simulated POPC molecules.
The Gaussian-like shape of the change in angle over time allows us employ an Einstein relation to extract the orientational diffusion constant from MD simulations:
| (4) |
over a short time τ, giving us a diffusion constant in units of rad2/ns. A best-fit line of a plot of 〈|ρ(t + τ) − ρ(t)|2〉 versus τ, shown in Fig. 4, yields twice the diffusion constant. The numerical value of Dρ and other parameters used in this work are given in Table I.
FIG. 4.
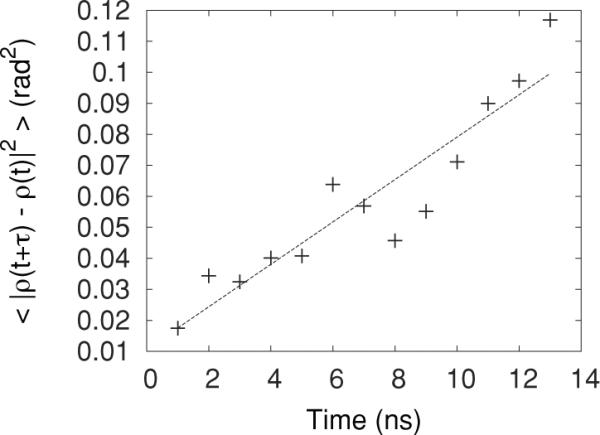
Average square change in the POPC orientation angle as a function of time. The slope of the best-fit line (dotted line) yields 2Dρ.
TABLE I.
Simulation parameters.a
| Parameter | Value | Method of estimation | Comment |
|---|---|---|---|
| 143,160 kJ/mol | P | Calibrated for each α0 | |
| 63 kJ/mol | P | ||
| 0.111 | MD | see [43,44] | |
| 0.283 | MD | see [43,44] | |
| V 1 | 20 kJ/mol | REG | see [56] |
| V 2 | 100 kJ/mol | REG | see [56] |
| V 1c | 3.0 kJ/mol | REG | see [43,44] |
| Δ | 2.0 | REG | Anisotropy factor, see [44] |
| CC boundary | 0.94 nm | MD | Hardcore repulsive CHOL-CHOL cutoff |
| D lipid | 10−12m−2/s | APPROX | |
| D r | 10−12m−2/s | APPROX | see [43,44] |
| 10Dr | APPROX | see [43,44] | |
| 0.07 rad2/ns | REG | ||
| α 0 | 0.0, 1.0 | P | Dimensionless |
APPROX, order-of-magnitude approximation from MD simulations; MD, calculated directly from MD simulations; P, phenomenological; REG, linear regression approximation from MD simulations.
C. Concentration field
To model two different types of lipids in our mixtures, we include a concentration field, ψi(t) = cPSM,i(t) − cPOPC,i(t), which describes the compositional makeup of site i at time t. As in our earlier work [56], cPSM,i(t) is the concentration of PSM at site i, and cPOPC,i(t) is the concentration of POPC at site i, both of which range from 0 to 1. Therefore, ψi(t) varies continuously from −1 to +1 with the −1 representing pure POPC and +1 representing pure PSM. Locally, ψi(t) may vary but the total number of lipids present in the system remains constant and so the sum over all sites, , is fixed at each time. The concentration field evolves at each lattice point through the Cahn-Hilliard equation [68]:
| (5) |
where F is the free energy and γi is a conserved stochastic noise component; Γ is the lipid mobility and is related to the lipid diffusion constant by Γ = Dlipid/kbT. The value of Dlipid is unchanged from earlier work and is given in Table I. Equation (5) ensures that, while local lipid concentration field values may vary in time in response to thermal fluctuations and tendency toward free-energy minimization, the total lipid concentrations in the system are conserved.
D. Hamiltonian
The system Hamiltonian contributions arise from lipid-lipid chain interactions, lipid chain–CHOL interactions, and CHOL-CHOL interactions:
| (6) |
The Hamiltonian couples the order parameter and concentration fields to each other and to the overlying CHOLs. Due to the anisotropic nature of the POPC molecules, the first term in Eq. (6) differs from our previous model [56] and is explained in detail below. The second and third terms in Eq. (6) have not been altered from [56] but are also briefly summarized below.
1. Lipid-lipid interaction term, Hlipid-lipid
Lipid-lipid interactions are calculated following the model first proposed by Marc̆elja [69], defined in terms of order-parameter-based pairwise interactions between chains. The model was originally applied to DPPC-CHOL mixtures [43,44,56] and produced heat capacities and a phase diagram that agreed quite well with experiment [40]. In this application, we consider two model scenarios: (i) a model that contains no orientational dependence for lipid-POPC interactions and (ii) a model that includes explicit orientation dependence for lipid-POPC interactions.
If we include no orientation-dependent interactions between neighboring POPC molecules, the lipid-lipid Hamiltonian for a pure POPC bilayer is written
| (7) |
where the angle brackets indicate that the sum is taken over nearest-neighbor pairs and the coupling constant, , is a phenomenological parameter that is tuned in such a way that the calculated phase transition temperature of pure POPC matches the experimental value. The variables si and sj are the order parameters at the positions and defined in Eq. (1). To accomplish this, the average order parameter is calculated in a system of pure POPC for a range of temperatures with a given value of . A plot of order parameter against temperature reveals a curve that exhibits a sharp increase in order as temperature is decreased below a threshold temperature, Tm, which identifies Tm as the phase transition temperature. The value of is phenomenologically adjusted so that the simulated phase transition temperature is in agreement with the experimentally calculated value. The numerical value for for this case is shown in Table I.
With two identical saturated chains, PSM is not expected to interact in an angular-dependent fashion among nearest neighbors. Therefore, PSM-PSM interactions are written as
| (8) |
where is the coupling constant tuned in pure PSM mixtures to obtain a main-chain phase transition temperature that is identical to experiment.
For the case where we include an orientational degree of freedom for POPC molecules, we alter the POPC chain-chain interaction Hamiltonian as follows. We first recall that the concentration field variable ψi(t) can range continuously from −1, representing pure POPC, to +1, representing pure PSM. To incorporate the asymmetric nature of POPC-POPC interactions proposed above, we include an angular dependence to this term in proportion to the amount of POPC present between interacting nearest neighbors:
| (9) |
Here V0 is a function of the fraction of POPC, cPOPC, and the fraction of PSM, cPSM, present in the entire system:
| (10) |
As the fraction of POPC at site i is , the local normalized fraction of POPC at neighboring sites i and j is
| (11) |
We model the angular contribution between nearest-neighbor POPC pairs i,j by the function X(ϕij,ϕji) of the relative POPC orientational angles ϕij and ϕji for molecules at sites i and j:
| (12) |
The angles ϕij and ϕji are defined in Fig. 5 and discussed in more detail in the next paragraph. The second term in Eq. (9) couples the order parameter field to the concentration field. This term represents the estimated intrachain conformational energy at site i. The third term couples concentrations at neighboring sites. As described in [56], V1 and V2 are estimated directly from MD simulations. The concentration dependence in the first term of Eq. (9) [also see Eq. (11)] ensures that interactions have an angular dependence only in proportion to the amount of POPC at each site.
FIG. 5.
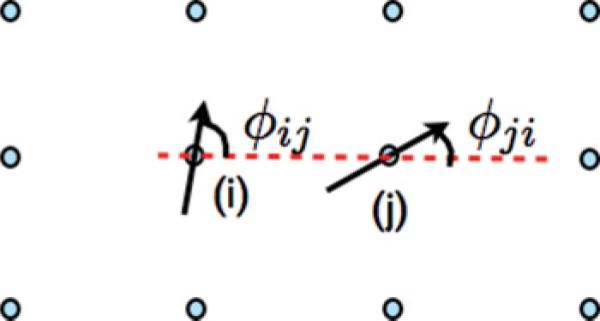
(Color online) The angles ϕij and ϕji discussed in the text. Solid arrows represent the orientations of lipids at sites i and j; ϕij and ϕji are measured relative to a line connecting the lipid at site i with its nearest neighbor at site j.
In order to model the condition that a lipid interacts more favorably with a nearest neighbor if its saturated chain points toward that neighbor and less favorably if its unsaturated chain points toward that neighbor, the orientation function in Eq. (12) is used. For this function, the orientations of POPC lipids at sites i and j are illustrated with solid arrows in Fig. 5 which point from the top of the unsaturated chain toward the top of the saturated chain; φij and φji represent the orientation of those vectors relative to a line between site i and site j [the dotted (red) line in Fig. 5]. The angle φij is related to the orientation angle ρi, defined above and illustrated in Fig. 2, by a constant that depends on the location of site j relative to site i. If the two solid arrows in Fig. 5 point toward each other, we interpret this as a saturated chain of a molecule pointing toward the saturated chain of the neighboring molecule and φij = 0 and φji = π. This configuration is optimal and no energy penalty is imposed. However, if the two arrows are pointed away from each other (φi = π,φj = 0), we interpret this as two unsaturated chains pointing toward each other, and we impose the maximum energy penalty. The constant α0 represents the strength of the angular dependence. In this model, if α0 > 1, the total energy interaction can include a repulsion between two nearest-neighbor chains. Since steric repulsions are implicitly present in this model through mean-field statistical mechanical calculations and conformation sampling, it is not necessary or correct to include them in the Hamiltonian.
2. Lipid-CHOL interaction term, Hlipid-CHOL
As discussed above and described in previous publications [43,44,56], lipid-CHOL interactions have an angular dependence in the plane of the bilayer because the “smooth” face has a tendency to induce more order in chains than the “rough” face does. The second term in the Hamiltonian accounts for this asymmetric interaction dependence:
| (13) |
The sums are over all lipid chains and nearest-neighbor CHOL molecules. Each CHOL rod has a body coordinate system with a y″ axis along the length of the rod starting at the center of mass and an x″ axis extending from the center of mass in the direction perpendicular to the rod on the rough side. The variable θi,j is defined as the angle between the y″ axis of CHOL i and vector connecting the center of mass of CHOL i and the position of lipid j on the lattice [44]. The coupling constant, Vlc, is found from MD trajectories by linear regression analysis of CHOL-lipid chain interactions as a function of order parameter, as described in previous papers [43,44]. The parameter Δ was introduced in earlier work [44] as a means to incorporate the fact that lipid chains are more energetically attracted to the smooth side of CHOL [44]. Thus, it serves to represent the asymmetry of lipid-CHOL interactions in the x-y plane of the bilayer. Numerical values for Vlc and Δ are the same as used earlier [44]. We note that, if Δ = 0, CHOL molecules are modeled as symmetrical in structure. We found in earlier work involving DPPC-CHOL binary mixtures [56] that, without the asymmetric CHOL interactions with lipids, the model did not yield a phase plot that was consistent with experiment [40]. With a nonzero value for Δ, we obtained a phase plot for DPPC-CHOL that was in very good agreement with experiment.
3. CHOL-CHOL interaction term, HCHOL-CHOL
As in previous work, CHOL molecules are cast as two-dimensional rods that diffuse through the order parameter and concentration fields according to a Langevin equation [43,44, 56]. As in earlier work, we take
| (14) |
where sums are taken over all neighboring CHOL molecules [43,44,56]. Here, rij is the distance between two close CHOLs, with indices i and j; κi and κj are angles made between a fixed direction on the lattice and a fixed direction on the body coordinates of the ith and jth CHOLs and κij = κi − κj is the difference between the two. From MD simulations and the success of previous models [43,44,56], it can be surmised that a simple repulsive interaction is sufficient to model CHOL-CHOL interactions:
E. Mean-field analysis
After each time step, new configurations of CHOL positions and orientations and a new concentration field are generated. Assuming that the lipid chain order relaxes rapidly between time steps, the new order parameter field is found in the mean-field approximation. The underlying statistical mechanical partition function is
| (15) |
where Htot is given in Eq. (6) and described in detail above. Sums are over all possible configurations, represented by the order parameter in Eq. (1), over all lipids in the system. It is not possible or practical to specify all single-chain configurations, so we make use of a representative library of configurations relevant to a bilayer environment that we obtain from MD simulations [43,44]. Libraries are constructed for each lipid type and each contains approximately 10,000 different chain configurations.
For a given set of concentration field values, , the mean molecular field at site i due to neighboring lipids, CHOL molecules, and the concentration field has the form
| (16) |
where ν is the number of nearest neighbors to i (= 4 on a square lattice). Once Φi is calculated at each site, it is used to solve the self-consistent equations for the local order parameter values, within the mean-field approximation,
| (17) |
and to find the mean-field free energy,
| (18) |
F. CHOL diffusion
The rotational and translational diffusion of CHOL molecules over the order parameter and concentration fields are modeled by Langevin equations:
| (19) |
and
| (20) |
where ηk and ζk are stochastic noise components and Mr and Mω are CHOL mobilities; defines the x,y position of the center of the kth CHOL and ωk is the orientation of the CHOL body x″-y″ axes introduced above; ηk and ζk are thermal fluctuations modeled as random variables that obey fluctuation-dissipation theorems; and Mr and Mω, the CHOL mobilities, are related to the MD-extracted diffusion constant D and the rotational diffusion constant Drot by Mr = D/kBT and Mω = Drot/kBT [43,44]. Numerical values for constants are shown in Table I.
G. Simulation
The system is initially given a random set of order parameter and concentration field values at each lattice site and a random distribution of CHOLs at the relevant concentration. The system of self-consistent equations is solved and the mean-field free energy is calculated. Following this, the angle field, concentration field, and CHOL molecules are updated by one time step. The self-consistent equations are solved again and the process is repeated for a total time of at least 1 μs.
III. RESULTS
In the application to POPC-PSM-CHOL mixtures, we consider a 100 × 100 square lattice with each lattice site representing a whole molecule order parameter. Molecular order parameters are averaged over both chains, so the field is constructed to represent 10,000 lipid molecules to which CHOL molecules are added. POPC:PSM concentrations were simulated between either 5% and 95% or 10% and 90%, depending on CHOL concentration, in increments of 10%. Mixtures including CHOL were simulated at CHOL concentrations ranging from 0% to 50% in increments of 5%. All simulated concentrations were run for at least 1 μs at a temperature of 303 K. To observe the effects of the addition of angular dependence, simulations were run with values of α0 equal to 0.0, 0.3, 0.5, 0.7, and 1.0. Table I lists the numerical values for all input parameters in the model. While our goal in this modeling work was to obtain as many of the model parameters from MD simulations as possible, in some cases the mapping process involved the use of simulation properties (e.g., molecular energies) that were quite noisy. Thus, the model interaction parameters that we used are not necessarily unique, but they are representative of the set of model parameters that should be used in this type of coarse-grained modeling. In addition to interaction parameters, the mean-field model we use requires that the order parameters be symmetric about zero, whereas the MD library order parameter values are not symmetrically distributed due to the bilayer environment. As discussed in earlier work, we introduce order parameter offsets [43,44], and , which are the mean values of the weighted chain order parameters found from MD simulations of pure POPC and PSM bilayers, respectively. These offsets are subtracted from each value of order parameter in the library, a necessary step to observe a temperature-dependent phase transition in the mean-field approximation, in the absence of a symmetric library of chain configurations [43,44].
For the MD-based parameters in Table I and chain configuration libraries, we used the following simulation protocols: The gromacs simulation package [70,71] was used to simulate a 200-lipid bilayer with compositions 37.5% POPC, 37.5% PSM, and 25% CHOL, solvated in 7211 Extended Simple Point Charge (SPC-E) water model. The lincs algorithm [72] was used for bond constraints with an integration time step of 2 fs. Periodic boundary conditions were used in all three dimensions. Long-range electrostatics were calculated using the pme algorithm [73] with a real space cutoff of 10 Å Van der Waals interactions were cut off at 16 Å. The constant pressure and temperature (NPT) ensemble was employed, allowing the volume to fluctuate, and the Parinello-Rahman pressure coupling scheme [74,75] was used with a constant pressure of 1 atm. Systems were simulated for 100 ns at a temperature of 313 K.
The simulated results can be qualitatively visualized through two-dimensional color density plots of concentration and order parameter fields. For quantitative analysis of the lateral organization, we calculate binned distributions of order and concentration averaged over many snapshots. Examples are shown in Fig. 6. The concentration field plot for the POPC:PSM:CHOL concentration triplet 45:40:15 after 1 μs with α0 = 0.0 (no angular dependence), Fig. 6(a), exhibits a bimodal pattern of concentration with field value represented by a scale shown in the key in Fig. 6(c). The order parameter field snapshot for the same concentration after 1 μs is shown in Fig. 6(b). This field exhibits a pattern that is similar to the pattern of the concentration field, with higher order parameter values associated with higher concentrations of PSM and lower order parameter values associated with higher concentrations of POPC. Figures 6(e) and 6(f) are plots of the distribution of values of the concentration and order fields over the lattice, respectively. This distribution, with others we describe here, was made by placing the 10,000 lattice composition field values into bins ranging in value from from −1 to +1 (concentration) or 0 to 0.5 (order) with width 0.01, for a single snapshot after 1 μs of simulation. However, we note that, based on both the scale for Fig. 6(b) and the narrowness of the distribution in Fig. 6(f), the variation of order over the lattice at this concentration is reduced compared to the variation in concentration over the lattice.
FIG. 6.

(Color online) (a) Concentration field snapshot, (b) order parameter snapshot (black lines in both (a) and (b) represent two-dimensional CHOL rods), (c) concentration field scale, (d) POPC order parameter scale, (e) concentration field distribution, and (f) order parameter distribution for the POPC:PSM:CHOL concentration 45:40:15.
To study the effect of POPC-POPC interaction angular dependence in the model, we ran simulations with α0 values between 0.0 and 1.0. The effect of increasing α0 is to very slightly increase the magnitude of lateral organizational patterns in the order parameter field at low CHOL concentration. Figure 7 illustrates the effect of α0 for two mixtures, POPC:PSM:CHOL 50:50:0 [Figs. 7(a) and 7(b)] and 40:40:20 [Figs. 7(c) and 7(d)]. In both cases, α0 = 1.0 leads to a slightly higher degree of lateral segregation in the order parameter field. Generally, we find that the incorporation of angular dependence leads to minor changes in the properties of the mixtures for CHOL concentrations less than about 20%. At CHOL concentrations closer to 50%, snapshots with α0 = 0.0 and α0 = 1.0 are indistinguishable.
FIG. 7.

(Color online) Order parameter field snapshots for POPC:SM:CHOL concentrations of (top) 50:50:0 and (bottom) 40:40:20 for values of (a, c) α0 = 0.0 and (b, d) α0 = 1.0. CHOL molecules removed for clarity in bottom figures. (e) Order parameter scale.
By examining order parameter and concentration field distributions, and snapshots, we can locate points on a ternary triangle diagram where the model predicts bimodal distributions of order and concentration, which we then relate to experimental ternary bilayer triangle diagram regions. Figure 8(a) is a ternary plot published by Veatch and Keller [1], based on fluorescence microscopy for the temperature of 23°C. Superimposed over their plot are arrows linking simulated concentration points on the diagram to system snapshots in Figs. 8(b)–8(k), for simulations carried out with α0 = 1. In comparing our model to experimental data based on fluorescence microscopy, it is important to note that the simulation time scale, on the order of 1 μs, is much smaller than experimental time scales. Lateral inhomogeneities in this model, as well as those in other models based on the Cahn-Hilliard [68,76] equation, tend to increase in size over time under favorable conditions.
FIG. 8.

(Color online) Experimentally derived phase plot [1], superimposed with labels marking the positions of the POPC:PSM:CHOL concentration fields and order parameter fields discussed in the text. In the experimental plot, white dots indicate a uniform liquid phase, black dots indicate coexisting liquid phases, gray squares indicate coexisting liquid and solid phases, and white squares indicate a uniform solid phase. In the simulation snapshots, CHOL molecules are removed for clarity. In all cases, α0 = 1.0.
Figure 8(b) shows the final order parameter snapshot for the POPC:PSM:CHOL concentration of 30:50:20 and Fig. 8(c) shows the final concentration field snapshot of the same concentration. This concentration corresponds to the point labeled (b,c) with an arrow in Fig. 8(a). We can see in the concentration field rounded regions of light (green) shading, indicating they are enriched with POPC. They are embedded in a background of a dark (blue) shading, indicating enrichment in PSM. The order parameter field plot for this mixture, Fig. 8(b), has a pattern that is similar to the concentration field plot, but the difference in the magnitude of the order parameters—the color scale (shading) difference—is reduced.
On the triangle diagram, experimental data points surrounding the point (b,c) are black circles, which denote coexisting high- and low-order domains. In the ternary plot of the same POPC-PSM-CHOL system published by de Almeida et al. [27], this concentration point is considered to be within a three-phase region of coexisting gel, liquid disordered, and liquid ordered phases. Zhao et al. [10] argue that in some cases micron-sized separated regions may be light induced [10], but they do not rule out their existence on a smaller size scale.
In Fig. 8(d) we show the final order parameter field snapshot and in Fig. 8(e) we show the final concentration field snapshot for the 60:30:10 mixture. The corresponding point on the triangle diagram is labeled (d,e) by an arrow. Again, we see the formation of higher-ordered regions in the order parameter field coinciding with PSM-rich regions in the concentration field and regions of lower order coinciding with POPC-rich regions. The experimental data points on the triangle diagram in Fig. 8(a) show black dots at regions surrounding this concentration point, representing the coexistence of liquid ordered and liquid disordered phases.
In Figs. 8(f) and 8(g), we show the final order parameter and concentration field snapshots at the concentration triplet 60:20:20, labeled (f,g) with an arrow on the triangle diagram. For this point, where the POPC concentration is high, there are no clear bimodal patterns in either field. However, CHOL does have an effect on the order, raising the values of chain order without forming large-scale lateral inhomogeneity. At similar POPC:PSM ratios (3:1), but in the absence of CHOL (not shown in this figure). we find that the order parameter field is quite uniform with an average value of ~0.15, with a very narrow distribution. However, Figs. 8(f) and 8(g) show that 20% CHOL increases the order into the range ~0.16–0.17 with a wider distribution. In the order parameter field density plot, there are diffuse regions that are more heavily populated by higher order and diffuse regions that are more heavily populated by lower order, but sharp demarcation between regions is absent. The experimental data points near point (f,g) are white circles that represent a single liquid phase region. De Almeida et al. [27] and Pokorny et al. [24] found evidence for the coexistence of liquid ordered and liquid disordered phases at this point on their POPC-PSM-CHOL triangle diagram.
The concentration triplet 10:50:40 is shown in Figs. 8(h) and 8(i) and labeled (h,i) on the triangle diagram. At this concentration there are no significant inhomogeneities in either the order parameter or the concentration fields. In this case there is a greater presence of PSM and the result is a uniformly higher order parameter field and a uniform concentration field. The presence of CHOL at this point has the effect of inducing order on all of the chains. The experimental data points surrounding the simulated concentration are white circles that represent the presence of a single liquid. Pokorny et al. [24] and de Almeida et al. [27] also identified this region as a single liquid disordered phase.
Figures 8(j) and 8(k) show order parameter and concentration field final snapshots for 80% PSM and 20% POPC in the absence of CHOL. The corresponding concentration is labeled (j,k) on the experimental diagram. There is no discernible separation of order parameter and concentration field values between high and low values. Both order parameter and concentration field distributions for this ratio are quite uniform. At this same concentration, the experimental data point shown in Fig. 8(a) is a white square, indicative of a single highly ordered gel phase. In our simulations, along the 0% CHOL concentration axis, as POPC concentration increases from 10% to 90%, the order parameter field evolves smoothly (within the resolution of the number of simulations) from a high value to a low value with increasing POPC. Bimodalities in order are seen as shoulders rather than separated peaks, and one can discern subtle variations in snapshots, as seen for example in Fig. 7. In the concentration field, however, there is a region of coexistence between PSM concentrations of 0.30 and 0.75 at 0% CHOL. At 50:50:0, the domains in the model are no longer circular but percolate across the simulation box (see Fig. 7). The triangle diagram published by de Almeida et al. [27] exhibits bimodal behavior along the 0% CHOL concentration line, with a gel phase at the high PSM end, a liquid disordered phase at the high POPC line, and a broad coexistence region between them.
In Fig. 9, we collect all of the results of 1-μs simulations in a triangle diagram based on order parameters for α0 = 1.0. The triangle diagrams for other values of α0 are not qualitatively different. The dots represent the average value of molecular order parameters, with the shading (color) of the dots denoting the magnitudes. Within the shaded region, there are two dots at each simulated mixture point representing the respective values at each peak in order parameter distributions which show bimodality. The bimodal region itself is outlined by a boundary contour that was approximated by fitting distribution peaks to Gaussians and interpolating where single peaks would branch into double peaks. The resolution of this boundary is limited by the number of simulations carried out. As expected, Fig. 9 shows that increasing CHOL concentration has the effect of increasing the order parameter for the full system.
FIG. 9.
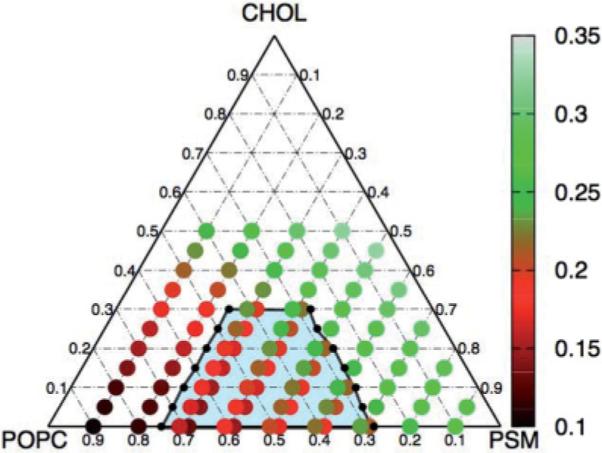
(Color online) POPC-PSM-CHOL ternary phase diagram with α0 = 1.0. The shaded region indicates the presence of bimodality in the order parameter distributions. Dots indicate the average order parameter values, with key to the right. Two overlapping dots that appear in the bimodal region represent the average order parameter of each peak.
As can be seen in the ternary figure, the patterns of the shaded (colored) dots exhibit a shift from high order parameter value [lighter shading (green, white)] in PSM-rich regions to low order parameter [darker shading (dark red, black)] in POPC-rich regions. At concentrations of CHOL below about 0.3, the order parameter and concentration fields separate into regions rich in POPC and regions rich in PSM, as discussed above. To quantitatively analyze this behavior, we consider the 15% CHOL concentration line in the ternary plot, whose distributions of order parameter and concentration fields are shown in Figs. 10(a)–10(p). At low POPC concentration, 5:80:15 [Figs. 10(a) and 10(b)], the order fields have a single peak and the average value occurs at approximately 0.28 (a lighter shaded dot in Fig. 9). As we move toward higher POPC concentrations, the order parameter value is reduced.
FIG. 10.

Distribution plots of order parameter and concentration field for the POPC:PSM:CHOL concentrations, for α0 = 1.0, labeled for the last snapshot of 1-μs simulations along the 15% CHOL concentration line.
At the concentration 35:60:15 [Figs. 10(c) and 10(d)], we start to see the emergence of a second peak in concentration around 0.2. Moving further into the bimodal region, this concentration field peak grows and eventually dominates the distribution. Above 55:30:15 [Figs. 10(k) and 10(l)], again, only a single peak is visible in the distribution. Note that in all cases the order parameter field exhibits a much more subtle level of bimodality, through shoulders in a single peak rather than separated peaks. The addition of angular dependence does not change the distributions significantly.
As CHOL increases above 15% we find that the order parameter bimodal peaks begin to merge, whereas the concentration field distribution remains bimodal. The distributions of the order and concentration fields at 50% CHOL are shown in Fig. 11. At high PSM concentrations, 10:40:50 [Figs. 11(a) and 11(b)], there is a single peak in both the concentration field and the order parameter field. This is also true at high POPC concentrations, 40:10:50 [Figs. 11(g) and 11(h)]. However, between these two extremes [Figs. 11(c) and 11(d) and Figs. 11(e) and 11(f)], the concentration field distributions split into two clearly separate peaks, but the order parameter distributions still show just a single peak. In this model, we find that the presence of CHOL at moderate to high concentration (above 30% CHOL concentration) has the effect of ordering lipid chains of both PSM and POPC to such a degree that we are unable to distinguish between POPC and PSM by chain order.
FIG. 11.

Distribution plots of order parameter and concentration field for the POPC:PSM:CHOL concentrations, for α0 = 1.0, labeled for the last snapshot of 1-μs simulations along the 50% CHOL concentration line.
IV. DISCUSSION
We have presented a quantitative model for ternary mixtures of POPC, PSM, and CHOL. The model represents a high level of coarse graining that allows us to simulate many different mixtures on relatively large lattices for relatively long times. The results presented in the form of distributions of order and concentrations, and in the form of final snapshots, fit well with existing experimental data. The degree of phenomenology is necessarily greater than our earlier work [56], but every effort was made to use input from MD simulations where possible. As we found in earlier work, the order parameter field and concentration field distributions vary according to the mean-field approximation and are expected to provide an accurate description of the system as long as one is not near a critical point. In the model, as relative concentrations of POPC, PSM, and CHOL are changed, bimodalities in the concentration distributions can be found over a portion of the triangle diagram as illustrated in Fig. 9. For intermediate CHOL concentrations, bimodalities in order parameter field distributions tend to parallel those found in concentration field distributions. However, in the POPC-PSM-CHOL results, differences in chain order between adjacent domains are generally smaller in magnitude when compared to results from the same model applied to DOPC-SSM-CHOL [56]. At higher CHOL concentrations (above about 30%), order parameter bimodality is not found even for mixtures that exhibit concentration field bimodality.
As can be seen in Fig. 9, we find no trimodal distributions of order or composition in our simulations. This finding may seem counterintuitive in that, at high PSM levels, it seems at least plausible that gel-like regions can form. In our summary figure, Fig. 9, the grayscale (color) code indicates that the level of ordering in the bimodal regions is quite similar. The average chain order values, ~2.5, are indeed consistent with highly ordered chains, but within the resolution of this model we cannot separate a gel phase from a highly ordered “liquid ordered” phase. Furthermore, as we point out above, the bimodality in order parameters seen in the simulations is generally small, appearing as shoulders in the order distribution plots rather than separate peaks.
Emergent bimodalities in order and composition lead to the calculated properties of the model. In the model Hamiltonian, the first two coupling constants in Eqs. (9), (13), and (14), V0 and Vlc, are, respectively, used to account for chain-chain and chain-CHOL interactions. We note that identical lipid-lipid and lipid-CHOL interaction expressions have been used by our group in earlier work to model binary mixtures of DPPC and CHOL. The third coupling constant, V2, accounts for interactions arising from differences in chemical structure of the two lipids that are not included in the first two terms, namely contributions arising from the polar groups. While both POPC and PSM have identical phosphocholine groups, there are significant differences in the backbone and hydration regions of the two types of molecules. Notably, the sphingosine group of PSM has hydroxyl and amine moieties that alter the electrostatic environment, compared to the glycerol region of POPC molecules. MD simulations by our group and others have revealed the presence of significant intramolecular hydrogen bonding between amines and phosphate oxygens [6,66]. We also found in earlier MD simulations that there is on average one fewer bound water in SM bilayers, compared to phosphatidylcholine bilayers. Furthermore, MD simulations have found that hydrogen bonding can occur between neighboring SM molecules. For these reasons, the third term in our model Hamiltonian, which represents coupling between composition field values at neighboring sites, is an essential part of this model. Since calculated bimodalities in chain order are generally small, the interactions that arise from differences in the backbone regions become more important in this model. In fact, at 303 K, there is only a very small tendency for localized order parameter bimodality in the system, in the absence of a concentration field contribution to the interactions (V2 = 0). However, for nonzero values of the composition field coupling constant V2, the tendency for lateral compositionally distinct domains is found. The primary affect of increasing the magnitude of V2 is to reduce the time scale over which the bimodalities in composition, and to a lesser extent in order, appear.
There are three additional salient points to make regarding the predicted levels of chain ordering in this model.
(1) In an earlier large-scale (~1400 lipids) MD simulation of a SSM-CHOL domain surrounded by DOPC, we found that the SSM-CHOL domain affected the order of the DOPC chains over a radial distance of about 7 nm from the domain itself, lowering the average molecular area of DOPC from around 68 Å2 to 60 Å2 [77]. This observation was not a periodic boundary effect because the simulation was sufficiently large that we also found a region of DOPC with the expected fluid area per molecule of 68 Å2. This means that ordered lipid and CHOL will raise the level of order (and thereby lower the molecular area) of substantial numbers of neighboring lipids that would otherwise exhibit fluidlike characteristics. This observation supports the findings of the present model regarding the reduced levels of bimodality in chain order.
(2) The size of the present simulations, ~104 lipid chains, is very large compared to MD scales, but periodic boundary conditions likely inhibit the formation of larger domains. Larger domains segregated by lipid type and chain order would allow for greater differences in order parameters.
(3) The interaction parameters in the model could, with more phenomenological adjustments, lead to predictions of localized domains with greater differences in localized structure. However, the emphasis in this paper is toward minimal phenomenology and more input from atomistic MD simulations.
To underscore the distinctions between POPC-PSM-CHOL and DOPC-SSM-CHOL ternary mixtures, Fig. 12 illustrates this comparative difference in 60:30:10 mixtures [Fig. 12(a)]. In the DOPC mixture, small rounded domains have formed that are rich in ordered SSM and are surrounded by a DOPC background with a lower order parameter value. In the POPC mixtures, the shaded (color) density plot shows that the difference in the order parameters between the regions is practically zero. Therefore, a prediction of this model is that molecular chain order differences may be quite subtle and even undetectable, whereas concentration field distributions exhibit observable levels of bimodality, or lateral organization, driven primarily to the differences in backbone structures of POPC and PSM.
FIG. 12.

(Color online) Order parameter field final snapshots for (a) DOPC:SM:CHOL 60:30:10 and (b, c) POPC:PSM:CHOL mixtures at the same concentration ratios with (b) α0 = 0.0 and (c) α0 = 1.0. Scale shown in (d).
We note that, while the inclusion of an orientational interaction for asymmetrical POPC molecules is a reasonable addition to the model, the results in our work are only weakly dependent on this interaction. The interaction function that included POPC orientation, Eq. (9), was chosen as a simple way to express this interaction. It is possible that a different choice for the orientational energy expression could produce different results when the concentration of POPC is large.
In summary, our extended model for ternary component lipid bilayers of POPC-PSM-CHOL shows good agreement with experiment and provides possible new insights into the atomic-level compositional and order distributions. This SCMFT model can be used to describe any system consisting of two long-chain lipids in a ternary mixture with CHOL, independent of chain type, length, or level of unsaturation, while taking into account any angular dependencies.
ACKNOWLEDGMENTS
SP thanks Gerald Feigenson for helpful discussions. PT, GZ, and HLS acknowledge support from NIH Grant No. PHS 2 PN2 EY016570B from the NIH Roadmap for Medical Research. SAP acknowledges support from NIH Grant No. 1R01GM086707-01A1.
References
- [1].Veatch SL, Keller SL. Phys. Rev. Lett. 2005;94:148101. doi: 10.1103/PhysRevLett.94.148101. [DOI] [PubMed] [Google Scholar]
- [2].Haluska CK, Schröder AP, Didier P, Heissler D, Duportail G, Mély Y, Marques C. Biophys. J. 2008;95:5737. doi: 10.1529/biophysj.108.131490. [DOI] [PMC free article] [PubMed] [Google Scholar]
- [3].Kahya N, Scherfeld D, Bacia K, Poolman B, Schwille P. J. Biol. Chem. 2003;278:28109. doi: 10.1074/jbc.M302969200. [DOI] [PubMed] [Google Scholar]
- [4].Veatch SL, Keller SL. Phys. Rev. Lett. 2002;89:268101. doi: 10.1103/PhysRevLett.89.268101. [DOI] [PubMed] [Google Scholar]
- [5].Stottrup B, Stevens D, Keller S. Biophys. J. 2005;88:269. doi: 10.1529/biophysj.104.048439. [DOI] [PMC free article] [PubMed] [Google Scholar]
- [6].Aittoniemi J, Niemelä PS, Hyvönen MT, Karttunen M, Vattulainen I. Biophys. J. 2007;92:1125. doi: 10.1529/biophysj.106.088427. [DOI] [PMC free article] [PubMed] [Google Scholar]
- [7].Zhang Z, Bhide SY, Berkowitz ML. J. Phys. Chem. 2007;111:12888. doi: 10.1021/jp074037i. [DOI] [PubMed] [Google Scholar]
- [8].de Almeida RFM, Borst J, Fedorov A, Prieto M, Visser AJWG. Biophys. J. 2007;93:539. doi: 10.1529/biophysj.106.098822. [DOI] [PMC free article] [PubMed] [Google Scholar]
- [9].Lindblom G, Orädd G, Filippov A. Chem. Phys. Lipids. 2006;141:179. doi: 10.1016/j.chemphyslip.2006.02.011. [DOI] [PubMed] [Google Scholar]
- [10].Zhao J, Wu J, Heberle FA, Mills TT, Klawitter P, Huang G, Costanza G, Feigenson GW. Biochim. Biophys. Acta. 2007;1768:2764. doi: 10.1016/j.bbamem.2007.07.008. [DOI] [PMC free article] [PubMed] [Google Scholar]
- [11].Collins MD, Keller SL. Proc. Natl. Acad. Sci. USA. 2008;105:124. doi: 10.1073/pnas.0702970105. [DOI] [PMC free article] [PubMed] [Google Scholar]
- [12].Heberle FA, Buboltz JT, Stringer D, Feigenson GW. Biochim. Biophys. Acta. 2005;1746:186. doi: 10.1016/j.bbamcr.2005.05.008. [DOI] [PMC free article] [PubMed] [Google Scholar]
- [13].Moore DJ, Snyder RG, Rerek ME, Mendelsohn R. J. Phys. Chem. 2006;110:2378. doi: 10.1021/jp054875h. [DOI] [PubMed] [Google Scholar]
- [14].Zheng L, McQuaw CM, Ewing AG, Winograd N. J. Am. Chem. Soc. 2007;129:15730. doi: 10.1021/ja0741675. [DOI] [PMC free article] [PubMed] [Google Scholar]
- [15].Zhao J, Wu J, Shao H, Kong F, Jain N, Hunt G, Feigenson G. Biochim. Biophys. Acta. 2007;1768:2777. doi: 10.1016/j.bbamem.2007.07.009. [DOI] [PMC free article] [PubMed] [Google Scholar]
- [16].Filippov A, Orädd G, Lindblom G. Biophys. J. 2007;93:3182. doi: 10.1529/biophysj.107.111534. [DOI] [PMC free article] [PubMed] [Google Scholar]
- [17].Filippov A, Orädd G, Lindblom G. Biophys. J. 2003;84:3079. doi: 10.1016/S0006-3495(03)70033-2. [DOI] [PMC free article] [PubMed] [Google Scholar]
- [18].Cicuta P, Keller SL, Veatch SL. J. Phys. Chem. B. 2007;111:3328. doi: 10.1021/jp0702088. [DOI] [PubMed] [Google Scholar]
- [19].Castro BM, de Almeida RFM, Silva LC, Fedorov A, Prieto M. Biophys. J. 2007;93:1639. doi: 10.1529/biophysj.107.107714. [DOI] [PMC free article] [PubMed] [Google Scholar]
- [20].Bakht O, Pathak P, London E. Biophys. J. 2007;93:4307. doi: 10.1529/biophysj.107.114967. [DOI] [PMC free article] [PubMed] [Google Scholar]
- [21].Frazier ML, Wright JR, Pokorny A, Almeida PFF. Biophys. J. 2007;92:2422. doi: 10.1529/biophysj.106.100107. [DOI] [PMC free article] [PubMed] [Google Scholar]
- [22].Ursell TS, Klug WS, Phillips R. Proc. Natl. Acad. Sci. USA. 2009;106:13301. doi: 10.1073/pnas.0903825106. [DOI] [PMC free article] [PubMed] [Google Scholar]
- [23].Veatch SL, Soubias O, Keller SL, Gawsrisch K. Proc. Natl. Acad. Sci. USA. 2007;104:17650. doi: 10.1073/pnas.0703513104. [DOI] [PMC free article] [PubMed] [Google Scholar]
- [24].Pokorny A, Yandek LE, Elegbede AI, Hinderliter A, Almeida PFF. Biophys. J. 2006;91:2184. doi: 10.1529/biophysj.106.085027. [DOI] [PMC free article] [PubMed] [Google Scholar]
- [25].Bunge A, Müller PM, Stöckl M, Herrmann A, Huster D. Biophys. J. 2008;94:2680. doi: 10.1529/biophysj.107.112904. [DOI] [PMC free article] [PubMed] [Google Scholar]
- [26].Halling KK, Ramstedt B, Nuström JH, Slotte JP, Nyholm TKM. Biophys. J. 2008;95:3861. doi: 10.1529/biophysj.108.133744. [DOI] [PMC free article] [PubMed] [Google Scholar]
- [27].de Almeida R, Feorov A, Prieto M. Biophys. J. 2003;85:2406. doi: 10.1016/s0006-3495(03)74664-5. [DOI] [PMC free article] [PubMed] [Google Scholar]
- [28].Tsamaloukas A, Szadkowska H, Heerklotz H. Biophys. J. 2006;90:4479. doi: 10.1529/biophysj.105.080127. [DOI] [PMC free article] [PubMed] [Google Scholar]
- [29].Lingwood D, Simons K. Science. 2010;327:46. doi: 10.1126/science.1174621. [DOI] [PubMed] [Google Scholar]
- [30].Simons K, Ikonen E. Nature. 1997;387:569. doi: 10.1038/42408. [DOI] [PubMed] [Google Scholar]
- [31].Edidin M. Annu. Rev. Biophys. Biomol. Struct. 2003;32:257. doi: 10.1146/annurev.biophys.32.110601.142439. [DOI] [PubMed] [Google Scholar]
- [32].Jacobson K, Mouritsen OG, Anderson RGW. Nat. Cell Biol. 2007;9:7. doi: 10.1038/ncb0107-7. [DOI] [PubMed] [Google Scholar]
- [33].Hancock J. Nature Rev. Mol. Cell Biol. 2006;7:456. doi: 10.1038/nrm1925. [DOI] [PMC free article] [PubMed] [Google Scholar]
- [34].Pike LJ. J. Lipid Res. 2003;44:655. doi: 10.1194/jlr.R200021-JLR200. [DOI] [PubMed] [Google Scholar]
- [35].Pike LJ. Biochem. J. 2004;378:281. doi: 10.1042/BJ20031672. [DOI] [PMC free article] [PubMed] [Google Scholar]
- [36].Yeagle P. The Membranes of Cells. 2nd ed Academic; New York: 1993. [Google Scholar]
- [37].Lantzsch G, Binder H, Heerklotz H. J. Fluoresc. 1994;4:339. doi: 10.1007/BF01881452. [DOI] [PubMed] [Google Scholar]
- [38].Veatch S, Keller S. Biophys. J. 2003;85:3074. doi: 10.1016/S0006-3495(03)74726-2. [DOI] [PMC free article] [PubMed] [Google Scholar]
- [39].Korlach J, Schwille P, Webb WW, Feigenson GW. Proc. Natl. Acad. Sci. USA. 1999;96:8461. doi: 10.1073/pnas.96.15.8461. [DOI] [PMC free article] [PubMed] [Google Scholar]
- [40].Vist MR, Davis JH. Biochemistry. 1990;29:451. doi: 10.1021/bi00454a021. [DOI] [PubMed] [Google Scholar]
- [41].McMullen TPW, McElhaney RN. Biochim. Biophys. Acta. 1995;1234:90. doi: 10.1016/0005-2736(94)00266-r. [DOI] [PubMed] [Google Scholar]
- [42].Mateo CR, Acuña AU, Brochon JC. Biophys. J. 1995;68:978. doi: 10.1016/S0006-3495(95)80273-0. [DOI] [PMC free article] [PubMed] [Google Scholar]
- [43].Khelashvili GA, Pandit SA, Scott HL. J. Chem. Phys. 2005;123:034910. doi: 10.1063/1.1943412. [DOI] [PMC free article] [PubMed] [Google Scholar]
- [44].Pandit SA, Khelashvili GA, Jakobsson E, Grama A, Scott HL. Biophys. J. 2007;92:440. doi: 10.1529/biophysj.106.093864. [DOI] [PMC free article] [PubMed] [Google Scholar]
- [45].Pan J, Tristram-Nagle S, Nagle JF. Phys. Rev. E. 2009;80:021931. doi: 10.1103/PhysRevE.80.021931. [DOI] [PMC free article] [PubMed] [Google Scholar]
- [46].Ramstedt B, Slotte JP. Biochim. Biophys. Acta. 2006;1758:1945. doi: 10.1016/j.bbamem.2006.05.020. [DOI] [PubMed] [Google Scholar]
- [47].Pandit SA, Chiu S, Jakobsson E, Grama A, Scott HL. Langmuir. 2008;24:6858. doi: 10.1021/la8004135. [DOI] [PMC free article] [PubMed] [Google Scholar]
- [48].Baumgart T, Hunt G, Farkas ER, Webb WW, Feigenson GW. Biochim. Biophys. Acta. 2007;1768:2182. doi: 10.1016/j.bbamem.2007.05.012. [DOI] [PMC free article] [PubMed] [Google Scholar]
- [49].Morales-Penningston NF, Wu J, Farkas ER, Goh SL, Konykhina TM, Zheng JY, Webb WW, Feigenson GW. Biochim. Biophys. Acta. 2010;1798:1324. doi: 10.1016/j.bbamem.2010.03.011. [DOI] [PMC free article] [PubMed] [Google Scholar]
- [50].Marsh D. Biochim. Biophys. Acta. 2009;1788:2114. doi: 10.1016/j.bbamem.2009.08.004. [DOI] [PubMed] [Google Scholar]
- [51].Lichtenberg D, Goñi FM, Heerklotz H. Trends Biochem. Sci. 2005;8:430. doi: 10.1016/j.tibs.2005.06.004. [DOI] [PubMed] [Google Scholar]
- [52].Putzel GG, Schick M. Biophys. J. 2008;95:4756. doi: 10.1529/biophysj.108.136317. [DOI] [PMC free article] [PubMed] [Google Scholar]
- [53].Putzel GG, Schick M. Biophys. J. 2009;96:4935. doi: 10.1016/j.bpj.2009.04.019. [DOI] [PMC free article] [PubMed] [Google Scholar]
- [54].Elliott R, Szleifer I, Schick M. Phys. Rev. Lett. 2006;96:098101. doi: 10.1103/PhysRevLett.96.098101. [DOI] [PubMed] [Google Scholar]
- [55].Elliott R, Katsov K, Schick M, Szleifer I. J. Chem. Phys. 2005;122:044904. doi: 10.1063/1.1836753. [DOI] [PubMed] [Google Scholar]
- [56].Tumaneng PW, Pandit SA, Zhao G, Scott HL. J. Chem. Phys. 2010;132:065104. doi: 10.1063/1.3314729. [DOI] [PMC free article] [PubMed] [Google Scholar]
- [57].Pandit SA, Scott HL. Biochim. Biophys. Acta. 2009;1788:136. doi: 10.1016/j.bbamem.2008.09.004. [DOI] [PMC free article] [PubMed] [Google Scholar]
- [58].Shi Q, Voth GA. Biophys. J. 2005;89:2385. doi: 10.1529/biophysj.105.063784. [DOI] [PMC free article] [PubMed] [Google Scholar]
- [59].Idema T, van Leeuwen JMJ, Storm C. Phys. Rev. E. 2009;80:041924. doi: 10.1103/PhysRevE.80.041924. [DOI] [PubMed] [Google Scholar]
- [60].Fattal DR, Ben-Shaul A. Biophys. J. 1994;67:983. [PMC free article] [PubMed] [Google Scholar]
- [61].Ben-Shaul A, Szleifer I, Gelbart WM. J. Chem. Phys. 1985;83:3597. [Google Scholar]
- [62].Gruen DWR. J. Phys. Chem. 1985;89:146. [Google Scholar]
- [63].Müller M, Katsov K, Schick M. Phys. Rep. 2006;434:113. [Google Scholar]
- [64].McConnell H. J. Chem. Phys. 2009;130:165103. doi: 10.1063/1.3121951. [DOI] [PubMed] [Google Scholar]
- [65].Risselada HJ, Marrink SJ. Proc. Natl. Acad. Sci. USA. 2008;105:17367. doi: 10.1073/pnas.0807527105. [DOI] [PMC free article] [PubMed] [Google Scholar]
- [66].Chiu S, Vasudevan S, Jakobsson E, Mashl RJ, Scott L. Biophys. J. 2003;85:1. doi: 10.1016/S0006-3495(03)74780-8. [DOI] [PMC free article] [PubMed] [Google Scholar]
- [67].Maulik PR, Shipley GG. Biophys. J. 1996;70:2256. doi: 10.1016/S0006-3495(96)79791-6. [DOI] [PMC free article] [PubMed] [Google Scholar]
- [68].Chaiken PM, Lubensky TC. Principles of Condensed Matter Physics. Cambridge University; Cambridge, UK: 1995. [Google Scholar]
- [69].Marčelja S. Biochim. Biophys. Acta. 1974;367:165. doi: 10.1016/0005-2736(74)90040-6. [DOI] [PubMed] [Google Scholar]
- [70].Berendsen H, van der Spoel D, van Drunen R. Comp. Phys. Comm. 1995;91:43. [Google Scholar]
- [71].Lindahl E, Hess B, van der Spoel D. J. Mol. Model. 2001;7:306. [Google Scholar]
- [72].Hess B, Bekker H, Berendsen HJC, Fraaige JGEM. J. Comput. Chem. 1997;18:1463. [Google Scholar]
- [73].Essmann U, Perera L, Berkowitz ML, Darden T, Lee H, Pedersen LG. J. Chem. Phys. 1995;103:8577. [Google Scholar]
- [74].Nose S, Klein ML. Mol. Phys. 1983;50:1055. [Google Scholar]
- [75].Parrinello M, Rahman A. J. Appl. Phys. 1981;52:7182. [Google Scholar]
- [76].Peng G, Qiu F, Ginzburg V, Jasnow D, Balazs A. Science. 2000;288:1802. doi: 10.1126/science.288.5472.1802. [DOI] [PubMed] [Google Scholar]
- [77].Pandit SA, Jakobsson E, Scott HL. Biophys. J. 2004;87:3312. doi: 10.1529/biophysj.104.046078. [DOI] [PMC free article] [PubMed] [Google Scholar]