

Abstract
Activated partial thromboplastin time (aPTT) and prothrombin time (PT) are clinical tests commonly used to screen for coagulation-factor deficiencies. One genome-wide association study (GWAS) has been reported previously for aPTT, but no GWAS has been reported for PT. We conducted a GWAS and meta-analysis to identify genetic loci for aPTT and PT. The GWAS for aPTT was conducted in 9,240 individuals of European ancestry from the Atherosclerosis Risk in Communities (ARIC) study, and the GWAS for PT was conducted in 2,583 participants from the Genetic Study of Three Population Microisolates in South Tyrol (MICROS) and the Lothian Birth Cohorts (LBC) of 1921 and 1936. Replication was assessed in 1,041 to 3,467 individuals. For aPTT, previously reported associations with KNG1, HRG, F11, F12, and ABO were confirmed. A second independent association in ABO was identified and replicated (rs8176704, p = 4.26 × 10⁻²⁴). Pooling the ARIC and replication data yielded two additional loci in F5 (rs6028, p = 3.22 × 10⁻⁹) and AGBL1 (rs2469184, p = 3.61 × 10⁻⁸). For PT, significant associations were identified and confirmed in F7 (rs561241, p = 3.71 × 10−56) and PROCR/EDEM2 (rs2295888, p = 5.25 × 10⁻¹³). Assessment of existing gene expression and coronary artery disease (CAD) databases identified associations of five of the GWAS loci with altered gene expression and two with CAD. In summary, eight genetic loci that account for ∼29% of the variance in aPTT and two loci that account for ∼14% of the variance in PT were detected and supported by functional data.
Main Text
Activated partial thromboplastin time (aPTT) and prothrombin time (PT) are clinical tests commonly used to screen for coagulation-factor deficiencies.1–3 aPTT measures the clotting time between the activation of factor XII (FXII) and the formation of a fibrin clot; thus, aPTT reflects the integrity of the intrinsic and common coagulation pathways.2,3 PT measures the clotting time from the activation of FVII and reflects the integrity of the extrinsic and common coagulation pathways.2,3 Shorter aPTT is a risk marker for incident and recurrent venous thromboembolism (VTE) in the general population,4,5 and activated coagulation is implicated in arterial thrombosis.6 An abnormal PT may reflect liver damage, deficiencies in clotting factors and vitamin K, or the use of blood thinners.3
Family-based studies have yielded heritability estimates of 0.43 to 0.83 for aPTT and 0.50 to 0.53 for PT, respectively,7,8 and shared genetic correlations have been observed between coagulation and thrombosis.9 To date, one genome-wide association study (GWAS) of aPTT, based on 542,050 genotyped SNPs in 1,477 participants of the Lothian Birth Cohorts (LBC) of 1921 and 1936 (LBC1921, LBC1936),10 has been reported. In that study, genome-wide significant associations were identified for variants at F12 (MIM 610619), KNG1 (MIM 612358), and HRG (MIM 142640).10 No GWAS has been reported to date for PT. We report a community-based GWAS and meta-analysis for aPTT and PT among participants of European ancestry and assess the functional and clinical relevance of identified loci.
The study population for aPTT comprised five community-based cohorts and two samples of individuals with VTE (Table 1). The community-based cohorts included the Atherosclerosis Risk in Communities (ARIC) study (final sample size n = 9,240; USA),11 the Genetic Study of Three Population Microisolates in South Tyrol (MICROS) (n = 1,215; Italy),12 LBC1921 (n = 471; UK), LBC1936 (n = 925; UK),13 and the Caerphilly Prospective Study (CaPS) (n = 891; UK).14 We studied individuals with VTE from two independent samples of the Marseille Thrombosis Association (MARTHA; France) study: MARTHA08 (n = 649) and MARTHA10 (n = 392). Given that the sample size for ARIC is much larger than that of the other cohorts, the ARIC cohort was analyzed as the discovery cohort and the others as replication cohorts.
Table 1.
Description of Basic Study Participant Characteristics: Mean ± SD or Percentage unless Otherwise Mentioned
| ARIC | MICROS | LBC1936 | LBC1921 | CaPS | MARTHA08 | MARTHA10 | |
|---|---|---|---|---|---|---|---|
| Total na | 9,240 | 1,334 | 925 | 471 | 891 | 649 | 392 |
| Age, in years | 54.3 ± 5.7 | 44.7 ± 16.7 | 69.6 ± 0.84 | 79.1 ± 0.57 | 56.9 ± 4.3 | 44.4 ± 14.3 | 48.3 ± 16.1 |
| Age range | 45–64 | 9–94 | 68–71 | 78–81 | 48–67 | 1–90 | 7–85 |
| % Female | 52.9 | 57.2 | 49.4 | 59.6 | 0 | 75.8 | 63.3 |
| BMI, in kg/m2 | 27.0 ± 4.8 | 25.4 ± 4.8 | 27.8 ± 4.4 | 26.1 ± 4.2 | 26.7 ± 3.6 | 24.3 ± 4.4 | 25.8 ± 4.8 |
| aPTT n | 9,240 | 1,215 | 925 | 471 | 891 | 649 | 392 |
| aPTT, in s | 29.0 ± 2.9 | 26.6 ± 2.4 | 28.3 ± 2.6 | 0.90 ± 0.12b | 33.0 ± 2.8 | 31.3 ± 3.4 | 31.6 ± 3.2 |
| Median aPTT | 28.8 | 26.0 | 28.0 | 0.90b | 32.7 | 31.0 | 31.4 |
| IQR aPTT | 27.1–30.7 | 25.0–28.0 | 26.0–30.0 | 0.82–0.99b | 31.2–34.7 | 29.0–33.4 | 29.3–33.3 |
| PT (INR) n | NA | 1,218 | 922 | 443 | NA | 612 | 374 |
| PT (INR) | NA | 1.03 ± 0.12 | 0.96 ± 0.06 | 0.98 ± 0.08 | NA | 99.8 ± 13.5c | 101.4 ± 10.5c |
| Median PT (INR) | NA | 1.02 | 1.00 | 0.98 | NA | 99.0c | 101.0c |
| IQR PT (INR) | NA | 0.98–1.06 | 0.90–1.00 | 0.93–1.03 | NA | 91.0–107.0c | 94.2–108.0c |
BMI, body mass index; aPTT, activated partial thromboplastin time; PT, prothrombin time; INR, international normalized ratio; IQR, interquartile range; NA, not available.
Overall n in the genome-wide association study of aPTT or INR after phenotype exclusions.
aPTT ratio.
The Quick value in %, which is in inverse relationship to INR.
PT was represented with the international normalized ratio (INR), which standardizes the PT measure across studies. Data for INR were available from MICROS (n = 1,218), LBC1921 (n = 443), and LBC1936 (n = 922) (Table 1). All the three samples were analyzed as discovery cohorts. Data from MARTHA08 (n = 612) and MARTHA10 (n = 374), which recorded only the Quick value (a PT ratio of the coagulation time as a percentage of normal), were analyzed as replications. Each study was approved by the institutional review board of the corresponding institutes, and participants gave informed consent.
aPTT and PT were measured in plasma with the use of automated coagulometers and on the basis of standard protocols specified in the individual studies. Tests were conducted on the same day as blood collection or within a few weeks (after freezing). aPTT in seconds (s) was available in all the cohorts except LBC1921, in which only the aPTT ratio was available. The aPTT ratio was calculated as the ratio of the subject's aPTT to the reference value of the laboratory and correlates nearly perfectly (R2 = 0.95) with aPTT values in LBC1936. INR was calculated as (subject's PT / mean normal PT)ISI, where ISI (international sensitivity index) is a measure of the sensitivity of a particular PT reagent and is determined by the manufacturers. Additional details on the coagulation measurements are provided in Table S1 available online.
Each study independently performed assays for genome-wide SNPs, quality control, and imputation on ∼2.5 million autosomal SNPs identified in the HapMap II sample with European ancestry (CEU [Utah residents with ancestry from northern and western Europe]). DNA samples were obtained from blood. The SNP arrays used were Affymetrix 6.0 in ARIC, Illumina HumHap300v2 Infinium in MICROS, Illumina Human 610_Quadv1 in both LBC cohorts, Illumina Human 610_Quad in MARTHA08, and Illumina Human 660W_Quad in MARTHA10. Before imputation, SNPs were filtered on the basis of sample and SNP call rates, Hardy-Weinberg equilibrium p values, and minor allele frequencies. Imputation was performed with the use of MACH software15,16 in all cohorts for estimation of the “allele dosage.” The accuracy of imputation was reflected by the ratio of observed to expected variance (OEV) of the dosage statistic for each SNP. In CaPS, de novo replication genotyping was performed with a fluorescence-based competitive allele-specific PCR system by KBioscience (Hoddesdon, UK). Genotyping was successful in 22 out of 24 SNPs analyzed. Details are provided in Table S1. In addition, the FV Leiden variant (rs6025, MIMs 188055 and 612309) and the top SNP for aPTT on chromosome 5 (rs2545801) were genotyped in ARIC with an Illumina assay as part of the Candidate gene Association Resource (CARe) project. The CARe data for rs2545801 were analyzed for confirmation of the GWAS results for this variant, which was imputed with borderline precision in ARIC (OEV = 0.3).
The association of aPTT or INR with genotyped or imputed SNPs was tested with the use of an additive genetic model in accordance with a unified analysis plan. Outliers or users of anticoagulants were excluded. Analysis was conducted with linear regression models for studies of unrelated individuals. A score test17 was used for testing the genetic associations while accounting for familial correlations in MICROS, which is a population study that contains related individuals in extended families. All analyses were adjusted for age, sex, and other cohort-specific covariates and were performed with ProbABEL-GenABEL,18 Mach2QTL,15,16 or PLINK (Table S1).19
For aPTT, we performed an effective-sample-size-weighted meta-analysis to combine p values and the direction of genetic effects from the replication (MICROS, LBC1921, LBC1936, and CaPS) and discovery (ARIC) cohorts. The p value-based approach was chosen because of mixed aPTT and aPTT-ratio measurements across cohorts. For INR, a fixed-effect, inverse-variance-weighted meta-analysis approach was used to pool p values and β coefficients from MICROS, LBC1921, and LBC1936. The genomic-control correction was applied to each study before the meta-analysis. The genomic-control inflation factor λ was around 1 (0.98–1.03) for both aPTT and INR in all cohorts and in the meta-analyses. The meta-analyses were conducted with the METAL package.20 The MARTHA data were not pooled with the community-based cohorts because of the possibility of different allele frequencies,21 linkage disequilibria (LD), and effect sizes in individuals with VTE compared to the general population.
To examine the evidence for additional independent signals in the presence of several significant associations at a given locus, we performed additional conditional analyses by adjusting for the top SNP observed in the region until there were no significant residual signals detected. LD statistics (r2) were estimated from combined data of the HapMap CEU and SeattleSNPs Programs for Genomic Applications (PGA) European panel. Interaction was tested between top SNPs of identified genes that have apparent biological effects (KNG1, HRG, F11 [MIM 264900], and F12) and was represented by a cross-product term between dosages of two tested SNPs. Multiple testing was accounted for by Bonferroni correction.
The aPTT GWAS findings are described in this and the next six paragraphs. As shown in Figures S1 and S2 and Table S2, 331 SNPs in ARIC from six regions exceeded the genome-wide significance threshold of p < 5 × 10⁻⁸. These included one SNP within F5 (MIM 612309), 107 SNPs in KNG1/HRG, 28 SNPs in CYP4V2 (MIM 608614) /KLKB1 (MIM 229000) /F11, 110 SNPs in F12, four SNPs in C6orf10, and 81 SNPs in ABO (MIM 110300). In the meta-analysis pooling data from ARIC, MICROS, LBC1936, and LBC1921 (Figures S3 and S4), a locus at chromosome 15q25.3 (three SNPs, within ATP/GTP binding protein-like 1, AGBL1) and another group of 29 SNPs within the F5 region emerged as statistically significant. Associations of aPTT with lead SNPs at the seven regions are presented in Table 2, Tables S3 and S4, and Figures S5–S14.
Table 2.
Association Parameters for Top SNP Associations in Activated Partial Thromboplastin Time Genome-wide Association Study
| Region | Top SNP | Position | Gene/Var | A1/A2/AF1 | Imput |
Beta/SE/Var% |
p Value/Direction |
Comments | ||
|---|---|---|---|---|---|---|---|---|---|---|
|
ARIC |
ARIC |
Replication |
MARTHAb |
|||||||
| n = 9,240 | n = 9,240 | na= 869–3,467 | n = 1,041 | |||||||
| Achieving Genome-wide Significance in ARIC Alone | ||||||||||
| 1q24.2 | rs9332701c | 167751391 | F5/cns | A/G/0.95 | - | 0.54/0.10/0.30 | 3.70 × 10⁻⁸/+ | 0.62/+ | NA | present study |
| 3q27 | rs710446 c | 187942621 | KNG1/cns | T/C/0.59 | 0.98–1.00 | −1.19/0.04/7.92 | 1.06 × 10−185/− | 2.72 × 10⁻³⁴/− | 7.25 × 10⁻²²/− | significant in PGWA |
| 3q27 | rs9898d | 187873321 | HRG/cns | C/T/0.65 | 0.87–1.00 | −1.01/0.04/5.41 | 1.65 × 10−116/− | 5.03 × 10⁻⁶/− | 2.58 × 10⁻¹⁴/− | significant in PGWA |
| 4q35 | rs2289252c | 187444375 | F11/intr | C/T/0.59 | 0.86–0.97 | −0.48/0.04/1.31 | 4.30 × 10⁻³⁰/− | 3.10 × 10⁻¹⁶/− | 3.83 × 10⁻⁵/−e | suggestive in PGWA |
| 4q35 | rs1593d | 187432545 | F11/intr | A/T/0.87 | 0.86–0.90 | 0.54/0.06/0.77 | 1.25 × 10⁻¹⁷/+ | 0.005/+ | 0.08/+ | present study |
| 5q33-qter | rs2545801c | 176773945 | F12/pro | C/T/0.84 | 0.30–0.89f | 1.55/0.05/10.64g | 4.13 × 10−60/+h | 3.49 × 10−63/+ | 6.20 × 10⁻¹¹/+ | significant in PGWA |
| 6p21.3 | rs2050190 | 32447054 | C6orf10/intr | A/G/0.66 | 0.94–0.99 | −0.25/0.04/0.33 | 1.29 × 10⁻⁸/− | 0.47/− | 0.77/+ | present study |
| 9q34.1-.2 | rs687621c | 135126886 | ABO/intr | A/G/0.65 | 0.99–1.00 | −0.82/0.04/3.52 | 3.64 × 10−81/− | 7.25 × 10⁻³⁰/− | 5.18 × 10⁻¹⁰/− | significant in PCGS |
| 9q34.1-.2 | rs8176704d,i | 135125373 | ABO/intr | G/A/0.93 | 0.90–1.00 | 0.89/0.09/1.04 | 4.26 × 10⁻²⁴/+ | 1.19 × 10⁻⁵/+ | 0.002/+ | present study |
| Achieving Genome-wide Significance in Meta-analysis of ARIC, MICROS, LBC1936, and LBC1921 | ||||||||||
| 1q24.2 | rs6028d | 167818306 | F5/cs | T/C/0.69 | 0.97–0.99 | 0.23/0.04/0.25 | 3.84 × 10⁻⁷/+ | 0.001/+ | 0.59/+ | present study |
| 15q25.3 | rs2469184 | 84992981 | AGBL1/intr | G/A/0.55 | 0.99–1.00 | 0.16/0.04/0.15 | 8.19 × 10⁻⁵/+ | 8.87 × 10⁻⁶/+ | 0.35/+ | present study |
Beta, change in activated partial thromboplastin time (in s) per copy of the A2 allele (minor allele); Var%, percentage of variance explained; Direction (+ or −), direction of association associated with the minor allele; Var, variant of the top SNP; A1, allele 1 (major allele); A2, allele 2 (minor allele); Imput, ratio of observed to expected variance as a measure of imputation quality (range presented here, 1 for genotyped SNPs); AF1, allele frequency for A1; cns, coding nonsynonymous; NA, not available; PGWA, previously published genome-wide association study (GWAS) in Lothian Birth Cohorts (LBC); intr, intron; pro, promoter region; PCGS, previously published candidate-gene studies; cs, coding synonymous.
n for replication: 869 is the n for rs9332701 that was only available in CaPS; n range for the other SNPs is 2,252–3,467.
Based on meta-analysis of MARTHA08 and MARTHA10.
Top SNP in that region if there is more than one independent SNP.
Second independent SNP, p value after adjusting for the top SNP of the region in ARIC: 9.95 × 10−92 for rs9898, 2.01 × 10⁻⁸ for rs1593, and 4.27 × 10⁻⁶ for rs6028.
Result for proxy rs925451 (r2 = 0.81 with rs2289252).
0.30 is the imputation quality score (OEV) in ARIC GWAS, OEV > 0.84 in the other cohorts.
Based on the results of ARIC genotyped data from the Candidate gene Association Resource (CARe) project.
p value < 10−150 based on the ARIC genotype data from the CARe project.
Results are after additionally adjusting for rs687621 in all cohorts.
More specifically, we confirmed independent associations with aPTT for rs710446 in KNG1, rs9898 in HRG, and rs2731672 in F12, previously reported in the LBC cohorts (r2 = 0.93 between rs2731672 and our top SNP, rs2545801).10 We also provided confirmation with genome-wide significance for the previously reported association of the ABO O blood group with aPTT in candidate-gene studies (top SNP: rs687621, r2 = 0.67 with the O functional variant).22,23
At the CYP4V2/KLKB1/F11 region, conditional analysis in ARIC identified two sets of independent signals led by two intronic variants in F11: rs2289252 (top SNP, p = 4.30 × 10⁻³⁰) and rs1593 (p = 1.25 × 10⁻¹⁷). These two SNPs were in LD (r2 = 0.09). After adjusting for rs2289252, rs1593 was still associated with aPTT (p = 2.01 × 10⁻⁸). The first locus tagged by rs2289252 was identified as suggestive by a pathway-based approach in the previously published GWAS for aPTT in LBC (top SNP: rs4253399, p = 1.8 × 10⁻⁵, r2 = 0.79 with rs2289252).10 The second locus led by rs1593 has not previously been associated with aPTT, and it explains an additional 0.33% of the variance in aPTT in ARIC beyond what was explained by rs2289252 (Table S3).
The associations we identified for aPTT with F5, C6orf10, AGBL1, and a second independent locus in ABO have not been previously reported for aPTT. The two loci in F5, tagged by rs9332701 and rs6028, reside in coding regions of F5 and are independent (r2 = 0.015). In ARIC, adjustment for rs9332701 only minimally influenced the signal for rs6028 (p = 3.84 × 10⁻⁷ and 4.27 × 10⁻⁶ before and after adjustment, respectively). Heterozygotes for rs9332701 have 25% lower plasma FV levels.24 The associations between aPTT and the two F5 variants in this study were not due to their LD with the FV Leiden variant (rs6025), because rs6025 was neither associated with aPTT (p = 0.54 for rs6025 in ARIC) nor correlated with the two F5 variants (r2 < 0.005). The second independent locus at the ABO region for aPTT included 20 significant SNPs and emerged after additionally adjusting for the top SNP, rs687621. The associations were led by rs4363269 and rs8176704. Of the 20 significant signals, only rs8176704 is located within a gene (intronic to ABO, p = 0.02 and 4.26 × 10⁻²⁴ before and after adjustment for rs68762, respectively); it tags the ABO A2 variant (r2 = 1), is in weak LD with rs687621 (r2 = 0.20), and explains an additional 1.0% of the variance in aPTT beyond what is explained by rs687621.
Among the six genome-wide significant associations for aPTT, identified in ARIC or the meta-analysis, the top signal in F11 (rs2289252) and two independent ones in the ABO region (rs687621 and rs8176704) were confirmed in the replication samples (Table 2). The associations for rs9332701 in F5, rs1593 in F11, adjusted for rs2289252, and rs2050190 in C6orf10 were not significantly replicated (Table 2), possibly due to limited replication data. The two associations that emerged only in the meta-analysis (rs6028 in F5 and rs2469184 in AGBL1) were consistent across individual cohorts but require additional replication (Table 2 and Tables S2–S4). Of note, AGBL1 and C6orf10 were not previously known to affect coagulation.
In ARIC, we evaluated ten interactions for aPTT among the top SNPs in KNG1 (rs710446), HRG (rs9898), F11 (rs2289252 and rs1593), and F12 (rs2545801). On the basis of a Bonferroni-adjusted alpha of 0.005, the interactions for rs710446 × rs9898, rs710446 × rs1593, and rs710446 × rs2545801 were statistically significant (Table S5). The interactions of rs710446 with rs9898 or with rs2545801 offset the marginal effects of the aPTT-decreasing alleles (Figure S15).
In ARIC, the six loci in KNG1, HRG, F11, F12, and ABO, which were replicated, together explained 28.7% of the variation in aPTT, with 6.0% attributable to the genome-wide significant associations in F11 (rs2289252) and ABO (rs687621 and rs8176704) that were not reported in the previous GWAS. A genetic risk score was created by summing the product of the number of aPTT-increasing alleles and the β coefficient from the meta-analysis for the lead SNPs in the six loci, with the genetic risk score rescaled to 100%. The genetic risk score showed an accurate prediction of aPTT values (Figure 1). The Pearson correlation was 0.53 (p < 0.0001), and the linear-regression coefficient ± SE was 1.00 ± 0.016 between the observed and predicted aPTT values. The mean aPTT ranged from 25.7 s in individuals in the lowest risk-score category (risk score ≤ 15, n = 111) to 33.8 s in those in the highest risk-score category (>72, n = 159). Each 11-unit increase in the genetic risk score corresponds to 1.21 s higher aPTT, which corresponds to the mean aPTT difference between VTE cases and controls.5
Figure 1.
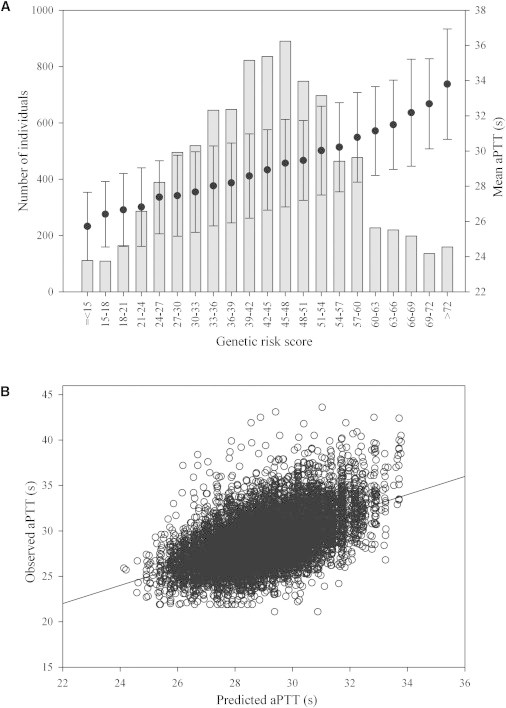
Cumulative Effect of the Lead SNPs in KNG1, HRG, F11, F12, and ABO on aPTT in ARIC
(A) Distribution of the genetic risk score (range: 0.24–85.1), and relation of risk-score categories to the mean aPTT (in s). The histogram, with reference to the y axis on the left, represents the number of individuals in each risk-score category. The black circles and error bars, with reference to the y axis on the right, indicate the mean aPTT ± SD (in s).
(B) Predicted versus observed aPTT values. The predicted aPTT values were calculated on the basis of the regression of the observed aPTT on the genetic risk score.
For the PT-related analyses, the INR GWAS results are presented in Table 3, Table S6, and Figures S16–S19. Two loci exceeded the genome-wide significance threshold of p < 5 × 10⁻⁸: 24 SNPs near or within F7 (MIM 613878) (top SNP: rs561241, near F7 5′, p = 3.71 × 10−56) and 40 SNPs near or within EDEM2 (MIM 610302) and PROCR (MIM 600646) (top SNP: rs2295888, intronic to EDEM2, p = 5.25 × 10⁻¹³). Of note, rs867186, another top variant (p = 4.65 × 10⁻¹²), is a coding nonsynonymous variant in the endothelial protein C receptor gene (PROCR or EPCR). The lead SNPs at the two loci together account for 10%–14% of the variation in INR. The associations were significantly replicated in MARTHA (Table 3).
Table 3.
p Values and Association Parameters for Top SNPs in Genome-wide Association Study for Prothrombin Time by INR
| Region | Top SNP | Position | Gene/Var | A1/A2/AF1 |
MICROS (n = 1,218) |
LBC1936 (n = 922) |
LBC1921 (n = 443) |
MARTHA (n = 986)a |
|||
|---|---|---|---|---|---|---|---|---|---|---|---|
| Beta/SE/Var% | p | Beta/SE/Var% | p | Beta/SE/Var% | p | p/Betab | |||||
| 13q34 | rs561241c | 112808035 | F7/near 5′ | T/C/0.71 | 0.035/0.003/11.76 | 7.80 × 10⁻²⁷ | 0.040/0.004/8.78 | 2.75 × 10⁻¹⁹ | 0.059/0.007/12.12 | 1.56 × 10⁻¹⁵ | 7.05 × 10⁻²⁰/-7.60 |
| 13q34 | rs6046c | 112821160 | F7/cns | G/A/0.71 | 0.035/0.003/11.74 | 7.55 × 10⁻²⁷ | 0.040/0.005/8.61 | 4.89 × 10⁻¹⁹ | 0.060/0.007/12.16 | 1.24 × 10⁻¹⁵ | 3.77 × 10⁻²¹/-7.99 |
| 20q11.2 | rs2295888d | 33186524 | EDEM2/intr | A/G/0.85 | −0.020/0.004/2.53 | 5.87 × 10⁻⁸ | −0.018/0.005/1.60 | 7.77 × 10⁻⁵ | −0.027/0.009/1.64 | 0.005 | 3.29 × 10⁻⁴/3.02 |
| 20q11.2 | rs867186d | 33228215 | PROCR/cns | A/G/0.84 | −0.020/0.004/2.50 | 9.98 × 10⁻⁸ | −0.017/0.005/1.38 | 2.44 × 10⁻⁴ | −0.024/0.009/1.37 | 9.6 × 10⁻³ | 3.46 × 10⁻⁴/2.97 |
Var, variant of the top SNP; A1, allele 1 (major allele); A2, allele 2 (minor allele); AF1, allele frequency for A1; Beta, change in international normalized ratio (INR) per copy of the A2 allele (minor allele); Var%, percentage of variance explained; cns, coding nonsynonymous; intr, intron.
Based on meta-analysis of MARTHA08 and MARTHA10.
The Quick value, which is in inverse relationship to INR, was used in MARTHA.
SNPs labeled with similar symbols are in high linkage disequilibrium with each other. Imputation quality scores ≥ 0.97 for all SNPs.
We next investigated pathways and networks by entering the genome-wide-significant hits in the STRING (Search Tool for the Retrieval of Interacting Genes/Proteins) database.25 Two networks were identified, characterizing mainly the intrinsic and extrinsic pathways for aPTT and PT, respectively. Other members of the identified networks were tested further at the gene level with the program VEGAS (Versatile Gene-based Association Study), which performs gene-based tests after taking into account of LD among SNPs.26 In this pathway- and gene-based analysis (Figure S20), another gene, PLG (plasminogen, MIM 173350), emerged as a suggestive locus for aPTT, and F5 emerged as a suggestive locus for INR (p = 0.0048 for PLG and 0.017 for F5, significant threshold = 0.0033 for aPTT genes and 0.006 for INR genes after Bonferroni correction). Plasmin, the activated form of plasminogen, not only dissolves fibrin in blood clots, but also mediates the activation of the contact coagulation system.27
We next conducted gene expression association analysis to focus on SNPs with p < 10−4 for aPTT (n = 1,124 SNPs) or INR (n = 340) from the meta-analysis. These SNPs were searched against a collected database of expression quantitative trait locus (eQTL) results on the basis of blood-derived and related organ tissues, including CD4+ lymphocytes,28 monocytes,29 adipose and blood samples,30,31 liver,31–33 and brain tissues (V.E., unpublished data). eQTL results were judged significant based on p < 4 × 10⁻⁵ and 1 × 10⁻⁴ for aPTT and INR, respectively, after accounting for multiple testing. Table 4 presents the smallest gene expression association p values for each relevant tissue at the corresponding GWAS regions. When the top GWAS SNPs were not available in the expression databases, expression SNPs (eSNPs) that correlated with the top GWAS SNPs at r2 ≥ 0.8 were considered as strongly supporting eSNPs. As shown in Table 4 and Tables S7 and S8, five of the GWAS loci (F5, F12, ABO, F7, and EDEM2/PROCR) contained at least one strongly supporting eSNP in at least one tissue, with strong support for F5, F12, F7, PROCR, and EIF6 (eukaryotic initiation translation factor 6, MIM 602912) as important genes.
Table 4.
Selected Top Gene Expression Associations Related to Loci for aPTT or INR
| eSNP | Region | Tissue | Genes Nearbya | p Value Expression/n | Transcript | p Value GWAS | r2 to Top GWAS SNP | Top GWAS SNP |
|---|---|---|---|---|---|---|---|---|
| aPTT | ||||||||
| rs1894702 | 1q24.2 | CD4+ lymphocytes28 | F5;SELP | 7.59 × 10⁻¹⁷/200 | F5 | 8.11 × 10⁻⁹ | 0.92 | rs6028 |
| rs7542088 | monocytes29 | F5;SELP | 4.74 × 10⁻¹⁴/1,490 | F5 | 9.37 × 10⁻⁹ | 0.96 | rs6028 | |
| rs3917854 | whole-blood30 | F5;SELP | 3.90 × 10−50/1,469 | F5 | 3.05 × 10⁻⁸ | 0.96 | rs6028 | |
| rs2731672 | 5q33 | liver31 | F12;GRK6; SLC34A1; PRR7; RGS14;DBN1 | 6.13 × 10−53/607 | F12 | 2.43 × 10⁻³⁴ | 0.93 | rs2545801 |
| liver32 | 1.16 × 10⁻²³/472 | F12 | ||||||
| liver33 | <1.00 × 10⁻¹⁶/206 | F12 | ||||||
| liver33 | 1.52 × 10⁻⁶/60 | F12 | ||||||
| rs505922 | 9q34.2 | CD4+ lymphocytes28 | ABO;SURF6;MED22 | 2.69 × 10⁻⁵/200 | ABO | 1.04 × 10−99 | 0.97 | rs687621 |
| rs2437792 | 15q25.3 | CBb | AGBL1 | 5.34 × 10⁻⁵/496 | AA620749c | 2.66 × 10⁻⁷ | 0.87 | rs2469184 |
| INR | ||||||||
| rs7981123d | 13q34 | liver33 | F7; MCF2L; F10 | 2.78 × 10⁻¹⁰/266 | F7 | 7.24 × 10−56 | 0.82 | rs561241 |
| liver33 | 4.88 × 10⁻¹⁰/206 | F7 | ||||||
| liver33 | 9.62 × 10⁻³/60 | F7 | ||||||
| rs488703 | omental adipose31 | F7; MCF2L; F10 | 4.77 × 10⁻¹⁰/848 | F7 | 1.23 × 10−55 | 0.88 | rs561241 | |
| rs10665 | subcutaneous adipose31 | F7; MCF2L; F10 | 2.07 × 10⁻⁶/701 | F7 | 6.45 × 10−53 | 0.92 | rs561241 | |
| DLPFCb | 1.82 × 10⁻⁷/583 | F7 | ||||||
| VCb | 1.33 × 10⁻⁷/409 | F7 | ||||||
| rs11906318 | 20q11.2 | liver31 | EDEM2;PROCR | 3.20 × 10⁻²⁰/607 | PROCR | 7.27 × 10⁻¹³ | 1.00 | rs2295888 |
| rs11907010 | omental adipose31 | EDEM2;PROCR | 5.62 × 10⁻¹⁸/848 | PROCR | 1.03 × 10⁻¹² | 1.00 | rs2295888 | |
| rs8119351 | whole-blood30 | EDEM2;PROCR | 2.60 × 10−46/1,469 | EIF6 | 1.19 × 10⁻¹² | 1.00 | rs2295888 | |
| rs6060244 | monocytes29 | EDEM2;TRPC4AP | 5.26 × 10⁻²⁴/1,490 | EIF6 | 7.02 × 10⁻¹² | 0.82 | rs2295888 | |
eSNP, expression SNP; GWAS, genome-wide association study; aPTT, activated partial thromboplastin time; INR, international normalized ratio; CB, cerebellum; DLPFC, dorsolateral prefrontal cortex; VC, visual cortex; EIF6, ITGB4BP.
“Nearby” is defined by 60,000 bp from gene boundaries; the genes are ordered by distance to the eSNP; the gene in which the top eSNP is located is in bold font
V.E., unpublished data.
AA620749 maps to unspliced and spliced expressed sequence tags that are ∼25–60 kb 5′ of AGBL1.
rs7981123 is positioned at −350 nt from the F7 transcription start site and is within regulatory elements based on alignment of ENCODE histone, DNase I hypersensitivity, and ChIP-sequencing data; in dbSNP, rs7981123 has merged into rs510335.
We next assessed the clinical relevance of the top ten independent SNPs associated with aPTT or INR using the CAD GWAS data from the Coronary Artery Disease Genome-wide Replication and Meta-analysis (CARDIoGRAM) study, which comprises 22,233 cases of CAD and 64,762 controls of European ancestry.34,35 The threshold for statistical significance was set at p < 0.005 for aPTT loci and p < 0.025 for INR after adjustment for multiple testing. As shown in Table S9, CAD was strongly and significantly associated with the proxy SNP for the O group (rs687621: odds ratio [OR] [95% confidence interval (CI)] = 1.06 [1.03–1.10] per one copy increase in the minor allele, p = 4.0 × 10⁻⁵) and with the top variants at the PROCR/EDEM2 locus (rs867186: OR [95% CI] = 0.93 [0.89–0.97], p = 0.002). The ABO-O association was consistent with previously published results in CARDIoGRAM.34 These results highlight that the coagulation pathways represent major molecular mechanisms through which some of the recently identified CAD risk alleles34 may be operating.
In this and the next four paragraphs, we offer a discussion of our results. This study provides evidence confirming the contributions of genetic factors in the CYP4V2/KLKB1/F11 region to normal variation of aPTT. Multiple SNPs in CYP4V2, KLKB1, and F11 have been independently associated with deep vein thrombosis (DVT)36,37, and the first top SNP for aPTT, rs2289252, was confirmed as a strong DVT variant.37,38 Another SNP, rs2036914, was associated with DVT independent of rs2289252.37 We noted that rs1593, the second top independent variant for aPTT, associated more strongly with rs2036914 than with rs2289252 (r2 = 0.17 versus 0.09). These observations, combined with the GWAS data presented in this study, suggest that more than one locus at this region influences coagulation function and the risk of DVT.
We not only confirmed the previously reported positive association between the ABO-O blood group and aPTT,22,23 but also identified a second independent locus represented by rs8176704, a perfect tag for the A2 group. The genome-wide significant associations for the second locus emerged after adjustment for the top SNP, rs687621, a tag for the O group. The adjustment substantially improved the signal for rs8176704, due to the existence of negative confounding between the two variants. There is a modest LD between the two variants (r2 = 0.2), with the minor allele of rs8176704 residing on the same ancestral haplotype block as the minor allele of rs687621 (Figure S21). These two alleles showed opposite directions of association with aPTT and, therefore, counteracted the marginal association with each other when the adjustment was not considered. ABO encodes a glycosyltransferase with three main alleles: A, B, and O. The A and B glycosyltransferases transfer N-acetyl-D-galactosamine and D-galactose to H antigen, respectively, whereas the O glycosyltransferase does not possess any enzymatic function.39 The A2 subgroup is characterized by a single-base deletion near the carboxyl terminal, resulting in a protein with little or no A-type transferase activity.40 The influence of the ABO blood group on coagulation function has been postulated to be mediated through plasma clearance of von Willebrand factor (vWF), i.e., quicker clearance of vWF in O and A2 groups.41 Both the O and A2 groups are associated with reduced risk of VTE,42 indicating that both loci for aPTT are clinically relevant.
The significant genetic interactions of KNG1 with HRG and F12 have not been previously reported. In the intrinsic or contact coagulation pathway, high-molecular-weight kininogen (HMWK), encoded by KNG1, acts as a cofactor for activation of kallikrein and FXI and FXII.43 HRG encodes a histidine-rich glycoprotein, which is located in the plasma and platelets. The physiological function of HRG is not well understood, but it is known to interact with heparin, thrombospondin, and plasminogen.44 Human cases with congenital deficiency of HRG manifested thrombophilia (MIM 613116).45,46 Mice deficient in HRG showed enhanced blood coagulation and fibrinolysis.47 KNG1 and HRG are located immediately adjacent to each other on chromosome 3. There is a high degree of structural similarity between them,48 indicating the possibility of shared function.48 The interaction detected in our study suggests that HRG may interact with the same receptors as HMWK in the intrinsic or contact coagulation pathway.
SNPs in F7 were a major contributor to variation of the functional index of the extrinsic pathway, explaining 8.6%–12.2% of variance in PT (INR). One of the top variants at this region, rs6046, results in an arginine-glutamine (R353Q) substitution. It was associated with FVII antigen and activity in a published GWAS.49 Interestingly, this variant explains more variance in INR than in FVII antigen and activity,49 suggesting that additional mechanisms, such as the interaction of FVII with other coagulation factors in the extrinsic pathway, may underlie the observed genetic associations.
Positive associations of the minor allele of rs867186 (PROCR S219G) with circulating levels of protein C and soluble EPCR (sEPCR) have been reported consistently in candidate-gene50–52 and GWAS studies.53 This variant explained 10%–13% of variation in protein C and 75% in sEPCR.51,53 The association between PT and the variants at this locus may be mediated through the interaction of EPCR with FVII, as the binding of activated FVII to EPCR has been observed.54,55 Our study has extended the previously reported genetic associations with FVII antigen and activity49,52 to the global functional assay of the extrinsic pathway. The association of rs867186 with CAD has been investigated in two small-sized candidate-gene studies, which observed null or opposite directions of association compared to ours.50,51 Our study, based on data from a larger CAD consortium, has greater statistical power. The minor allele that was associated with decreased risk of CAD in our study was also associated with increased protein C levels,51,53 consistent with the hypothesis of a protective effect of the protein C-activated protein C pathway on CAD risk.56 Interestingly, the rs867186/rs2295888 locus also showed strong associations with the expression of the ITGB4BP/EIF6, which is involved in regulation of translation in response to extracellular signals.57 As such, the gene expression data may point to a novel mechanism by which this locus influences coagulation and CAD risk.
In summary, we identified and replicated genome-wide significant associations at KNG1, HRG, F11, F12, and ABO for aPTT and at the F7 and PROCR/EDEM2 regions for PT. The loci identified in previous studies and in this study together explained a substantial proportion of the variance in aPTT and PT, which are important clinical tests. The underlying causal variants in KNG1, HRG, and F12 may interact with each other in influencing coagulation and aPTT levels. This GWAS, together with gene expression and clinical CAD data, improves our understanding of the role of biological mechanisms in the regulation of hemostasis and may offer new approaches to the prevention and treatment of arterial and venous thrombosis.
Acknowledgments
We warmly thank all staff and participants. The individual studies were supported by the National Institutes of Health (NIH) or other funding sources. W.T. is partially supported by NIH grant R01-HL095603. We would like to thank the University of Minnesota Supercomputing Institute for use of the Blade and Calhoun supercomputers. Additional acknowledgments for each study and conflict-of-interest disclosures are listed in the Supplemental Data.
Supplemental Data
Web Resources
The URLs for data presented herein are as follows:
GeneCards, http://www.genecards.org/
International HapMap Project, http://www.hapmap.org
KBioscience genotyping services, http://www.kbioscience.co.uk/
MACH 1.0 and Mach2QTL, http://www.sph.umich.edu/csg/abecasis/MACH/
Online Mendelian Inheritance in Man (OMIM), http://www.omim.org
ProbABEL and GenABEL, http://www.genabel.org/packages
SeattleSNPs, http://pga.gs.washington.edu/
STRING database, http://string-db.org/
UCSC Human Genome Browser Gateway, http://genome.ucsc.edu/cgi-bin/hgGateway
References
- 1.White G.C., 2nd The partial thromboplastin time: defining an era in coagulation. J. Thromb. Haemost. 2003;1:2267–2270. doi: 10.1046/j.1538-7836.2003.00459.x. [DOI] [PubMed] [Google Scholar]
- 2.Kitchen S., McCraw A., Echenagucia M. 2nd ed. World Federation of Hemophilia (WFH); Montreal: 2010. Diagnosis of Hemophilia and Other Bleeding Disorders: A Laboratory Manual. [Google Scholar]
- 3.Jacobs D.S. Lexi-Comp; Hudson, Ohio: 2001. Laboratory test handbook. [Google Scholar]
- 4.Hron G., Eichinger S., Weltermann A., Quehenberger P., Halbmayer W.M., Kyrle P.A. Prediction of recurrent venous thromboembolism by the activated partial thromboplastin time. J. Thromb. Haemost. 2006;4:752–756. doi: 10.1111/j.1538-7836.2006.01868.x. [DOI] [PubMed] [Google Scholar]
- 5.Zakai N.A., Ohira T., White R., Folsom A.R., Cushman M. Activated partial thromboplastin time and risk of future venous thromboembolism. Am. J. Med. 2008;121:231–238. doi: 10.1016/j.amjmed.2007.10.025. [DOI] [PMC free article] [PubMed] [Google Scholar]
- 6.Owens A.P., 3rd, Mackman N. Tissue factor and thrombosis: The clot starts here. Thromb. Haemost. 2010;104:432–439. doi: 10.1160/TH09-11-0771. [DOI] [PMC free article] [PubMed] [Google Scholar]
- 7.Souto J.C., Almasy L., Borrell M., Garí M., Martínez E., Mateo J., Stone W.H., Blangero J., Fontcuberta J. Genetic determinants of hemostasis phenotypes in Spanish families. Circulation. 2000;101:1546–1551. doi: 10.1161/01.cir.101.13.1546. [DOI] [PubMed] [Google Scholar]
- 8.Warren D.M., Soria J.M., Souto J.C., Comuzzie A., Fontcuberta J., Blangero J., MacCluer J.W., Almasy L. Heritability of hemostasis phenotypes and their correlation with type 2 diabetes status in Mexican Americans. Hum. Biol. 2005;77:1–15. doi: 10.1353/hub.2005.0034. [DOI] [PubMed] [Google Scholar]
- 9.Souto J.C., Almasy L., Borrell M., Blanco-Vaca F., Mateo J., Soria J.M., Coll I., Felices R., Stone W., Fontcuberta J., Blangero J. Genetic susceptibility to thrombosis and its relationship to physiological risk factors: the GAIT study. Genetic Analysis of Idiopathic Thrombophilia. Am. J. Hum. Genet. 2000;67:1452–1459. doi: 10.1086/316903. [DOI] [PMC free article] [PubMed] [Google Scholar]
- 10.Houlihan L.M., Davies G., Tenesa A., Harris S.E., Luciano M., Gow A.J., McGhee K.A., Liewald D.C., Porteous D.J., Starr J.M. Common variants of large effect in F12, KNG1, and HRG are associated with activated partial thromboplastin time. Am. J. Hum. Genet. 2010;86:626–631. doi: 10.1016/j.ajhg.2010.02.016. [DOI] [PMC free article] [PubMed] [Google Scholar]
- 11.The Atherosclerosis Risk in Communities (ARIC) Study: design and objectives. The ARIC investigators. Am. J. Epidemiol. 1989;129:687–702. [PubMed] [Google Scholar]
- 12.Pattaro C., Marroni F., Riegler A., Mascalzoni D., Pichler I., Volpato C.B., Dal Cero U., De Grandi A., Egger C., Eisendle A. The genetic study of three population microisolates in South Tyrol (MICROS): study design and epidemiological perspectives. BMC Med. Genet. 2007;8:29. doi: 10.1186/1471-2350-8-29. [DOI] [PMC free article] [PubMed] [Google Scholar]
- 13.Deary I.J., Gow A.J., Taylor M.D., Corley J., Brett C., Wilson V., Campbell H., Whalley L.J., Visscher P.M., Porteous D.J., Starr J.M. The Lothian Birth Cohort 1936: a study to examine influences on cognitive ageing from age 11 to age 70 and beyond. BMC Geriatr. 2007;7:28. doi: 10.1186/1471-2318-7-28. [DOI] [PMC free article] [PubMed] [Google Scholar]
- 14.Yarnell J.W., Sweetnam P.M., Rumley A., Lowe G.D. Lifestyle factors and coagulation activation markers: the Caerphilly Study. Blood Coagul. Fibrinolysis. 2001;12:721–728. doi: 10.1097/00001721-200112000-00015. [DOI] [PubMed] [Google Scholar]
- 15.Li Y., Willer C., Sanna S., Abecasis G. Genotype imputation. Annu. Rev. Genomics Hum. Genet. 2009;10:387–406. doi: 10.1146/annurev.genom.9.081307.164242. [DOI] [PMC free article] [PubMed] [Google Scholar]
- 16.Li Y., Willer C.J., Ding J., Scheet P., Abecasis G.R. MaCH: using sequence and genotype data to estimate haplotypes and unobserved genotypes. Genet. Epidemiol. 2010;34:816–834. doi: 10.1002/gepi.20533. [DOI] [PMC free article] [PubMed] [Google Scholar]
- 17.Chen W.M., Abecasis G.R. Family-based association tests for genomewide association scans. Am. J. Hum. Genet. 2007;81:913–926. doi: 10.1086/521580. [DOI] [PMC free article] [PubMed] [Google Scholar]
- 18.Aulchenko Y.S., Ripke S., Isaacs A., van Duijn C.M. GenABEL: an R library for genome-wide association analysis. Bioinformatics. 2007;23:1294–1296. doi: 10.1093/bioinformatics/btm108. [DOI] [PubMed] [Google Scholar]
- 19.Purcell S., Neale B., Todd-Brown K., Thomas L., Ferreira M.A., Bender D., Maller J., Sklar P., de Bakker P.I., Daly M.J., Sham P.C. PLINK: a tool set for whole-genome association and population-based linkage analyses. Am. J. Hum. Genet. 2007;81:559–575. doi: 10.1086/519795. [DOI] [PMC free article] [PubMed] [Google Scholar]
- 20.Willer C.J., Li Y., Abecasis G.R. METAL: fast and efficient meta-analysis of genomewide association scans. Bioinformatics. 2010;26:2190–2191. doi: 10.1093/bioinformatics/btq340. [DOI] [PMC free article] [PubMed] [Google Scholar]
- 21.Morange P.E., Oudot-Mellakh T., Cohen W., Germain M., Saut N., Antoni G., Alessi M.C., Bertrand M., Dupuy A.M., Letenneur L. KNG1 Ile581Thr and susceptibility to venous thrombosis. Blood. 2011;117:3692–3694. doi: 10.1182/blood-2010-11-319053. [DOI] [PubMed] [Google Scholar]
- 22.Fourel V., Gabastou J.M., Desroys du Roure F., Ehrhardt N., Robert A. Influence of age, sex and ABO blood group on activated partial thromboplastin time. Haemostasis. 1993;23:321–326. doi: 10.1159/000216895. [DOI] [PubMed] [Google Scholar]
- 23.Souto J.C., Almasy L., Muñiz-Diaz E., Soria J.M., Borrell M., Bayén L., Mateo J., Madoz P., Stone W., Blangero J., Fontcuberta J. Functional effects of the ABO locus polymorphism on plasma levels of von Willebrand factor, factor VIII, and activated partial thromboplastin time. Arterioscler. Thromb. Vasc. Biol. 2000;20:2024–2028. doi: 10.1161/01.atv.20.8.2024. [DOI] [PubMed] [Google Scholar]
- 24.Scanavini D., Girelli D., Lunghi B., Martinelli N., Legnani C., Pinotti M., Palareti G., Bernardi F. Modulation of factor V levels in plasma by polymorphisms in the C2 domain. Arterioscler. Thromb. Vasc. Biol. 2004;24:200–206. doi: 10.1161/01.ATV.0000109750.34073.f6. [DOI] [PubMed] [Google Scholar]
- 25.Jensen L.J., Kuhn M., Stark M., Chaffron S., Creevey C., Muller J., Doerks T., Julien P., Roth A., Simonovic M. STRING 8—a global view on proteins and their functional interactions in 630 organisms. Nucleic Acids Res. 2009;37(Database issue):D412–D416. doi: 10.1093/nar/gkn760. [DOI] [PMC free article] [PubMed] [Google Scholar]
- 26.Liu J.Z., McRae A.F., Nyholt D.R., Medland S.E., Wray N.R., Brown K.M., Hayward N.K., Montgomery G.W., Visscher P.M., Martin N.G., Macgregor S., AMFS Investigators A versatile gene-based test for genome-wide association studies. Am. J. Hum. Genet. 2010;87:139–145. doi: 10.1016/j.ajhg.2010.06.009. [DOI] [PMC free article] [PubMed] [Google Scholar]
- 27.Ewald G.A., Eisenberg P.R. Plasmin-mediated activation of contact system in response to pharmacological thrombolysis. Circulation. 1995;91:28–36. doi: 10.1161/01.cir.91.1.28. [DOI] [PubMed] [Google Scholar]
- 28.Murphy A., Chu J.H., Xu M., Carey V.J., Lazarus R., Liu A., Szefler S.J., Strunk R., Demuth K., Castro M. Mapping of numerous disease-associated expression polymorphisms in primary peripheral blood CD4+ lymphocytes. Hum. Mol. Genet. 2010;19:4745–4757. doi: 10.1093/hmg/ddq392. [DOI] [PMC free article] [PubMed] [Google Scholar]
- 29.Zeller T., Wild P., Szymczak S., Rotival M., Schillert A., Castagne R., Maouche S., Germain M., Lackner K., Rossmann H. Genetics and beyond—the transcriptome of human monocytes and disease susceptibility. PLoS ONE. 2010;5:e10693. doi: 10.1371/journal.pone.0010693. [DOI] [PMC free article] [PubMed] [Google Scholar]
- 30.Fehrmann R.S., Jansen R.C., Veldink J.H., Westra H.J., Arends D., Bonder M.J., Fu J., Deelen P., Groen H.J., Smolonska A. Trans-eQTLs reveal that independent genetic variants associated with a complex phenotype converge on intermediate genes, with a major role for the HLA. PLoS Genet. 2011;7:e1002197. doi: 10.1371/journal.pgen.1002197. [DOI] [PMC free article] [PubMed] [Google Scholar]
- 31.Greenawalt D.M., Dobrin R., Chudin E., Hatoum I.J., Suver C., Beaulaurier J., Zhang B., Castro V., Zhu J., Sieberts S.K. A survey of the genetics of stomach, liver, and adipose gene expression from a morbidly obese cohort. Genome Res. 2011;21:1008–1016. doi: 10.1101/gr.112821.110. [DOI] [PMC free article] [PubMed] [Google Scholar]
- 32.Schadt E.E., Molony C., Chudin E., Hao K., Yang X., Lum P.Y., Kasarskis A., Zhang B., Wang S., Suver C. Mapping the genetic architecture of gene expression in human liver. PLoS Biol. 2008;6:e107. doi: 10.1371/journal.pbio.0060107. [DOI] [PMC free article] [PubMed] [Google Scholar]
- 33.Innocenti F., Cooper G.M., Stanaway I.B., Gamazon E.R., Smith J.D., Mirkov S., Ramirez J., Liu W., Lin Y.S., Moloney C. Identification, replication, and functional fine-mapping of expression quantitative trait loci in primary human liver tissue. PLoS Genet. 2011;7:e1002078. doi: 10.1371/journal.pgen.1002078. [DOI] [PMC free article] [PubMed] [Google Scholar]
- 34.Schunkert H., König I.R., Kathiresan S., Reilly M.P., Assimes T.L., Holm H., Preuss M., Stewart A.F., Barbalic M., Gieger C., Cardiogenics. CARDIoGRAM Consortium Large-scale association analysis identifies 13 new susceptibility loci for coronary artery disease. Nat. Genet. 2011;43:333–338. doi: 10.1038/ng.784. [DOI] [PMC free article] [PubMed] [Google Scholar]
- 35.Preuss M., König I.R., Thompson J.R., Erdmann J., Absher D., Assimes T.L., Blankenberg S., Boerwinkle E., Chen L., Cupples L.A., CARDIoGRAM Consortium Design of the Coronary ARtery DIsease Genome-Wide Replication And Meta-Analysis (CARDIoGRAM) Study: A Genome-wide association meta-analysis involving more than 22 000 cases and 60 000 controls. Circ Cardiovasc Genet. 2010;3:475–483. doi: 10.1161/CIRCGENETICS.109.899443. [DOI] [PMC free article] [PubMed] [Google Scholar]
- 36.Bezemer I.D., Bare L.A., Doggen C.J., Arellano A.R., Tong C., Rowland C.M., Catanese J., Young B.A., Reitsma P.H., Devlin J.J., Rosendaal F.R. Gene variants associated with deep vein thrombosis. JAMA. 2008;299:1306–1314. doi: 10.1001/jama.299.11.1306. [DOI] [PubMed] [Google Scholar]
- 37.Li Y., Bezemer I.D., Rowland C.M., Tong C.H., Arellano A.R., Catanese J.J., Devlin J.J., Reitsma P.H., Bare L.A., Rosendaal F.R. Genetic variants associated with deep vein thrombosis: the F11 locus. J. Thromb. Haemost. 2009;7:1802–1808. doi: 10.1111/j.1538-7836.2009.03544.x. [DOI] [PubMed] [Google Scholar]
- 38.Smith N.L., Hindorff L.A., Heckbert S.R., Lemaitre R.N., Marciante K.D., Rice K., Lumley T., Bis J.C., Wiggins K.L., Rosendaal F.R., Psaty B.M. Association of genetic variations with nonfatal venous thrombosis in postmenopausal women. JAMA. 2007;297:489–498. doi: 10.1001/jama.297.5.489. [DOI] [PubMed] [Google Scholar]
- 39.Greenwell P. Blood group antigens: molecules seeking a function? Glycoconj. J. 1997;14:159–173. doi: 10.1023/a:1018581503164. [DOI] [PubMed] [Google Scholar]
- 40.Hosoi E. Biological and clinical aspects of ABO blood group system. J. Med. Invest. 2008;55:174–182. doi: 10.2152/jmi.55.174. [DOI] [PubMed] [Google Scholar]
- 41.Morelli V.M., de Visser M.C., van Tilburg N.H., Vos H.L., Eikenboom J.C., Rosendaal F.R., Bertina R.M. ABO blood group genotypes, plasma von Willebrand factor levels and loading of von Willebrand factor with A and B antigens. Thromb. Haemost. 2007;97:534–541. [PubMed] [Google Scholar]
- 42.Trégouët D.A., Heath S., Saut N., Biron-Andreani C., Schved J.F., Pernod G., Galan P., Drouet L., Zelenika D., Juhan-Vague I. Common susceptibility alleles are unlikely to contribute as strongly as the FV and ABO loci to VTE risk: results from a GWAS approach. Blood. 2009;113:5298–5303. doi: 10.1182/blood-2008-11-190389. [DOI] [PubMed] [Google Scholar]
- 43.Sainz I.M., Pixley R.A., Colman R.W. Fifty years of research on the plasma kallikrein-kinin system: from protein structure and function to cell biology and in-vivo pathophysiology. Thromb. Haemost. 2007;98:77–83. [PubMed] [Google Scholar]
- 44.Jones A.L., Hulett M.D., Parish C.R. Histidine-rich glycoprotein: A novel adaptor protein in plasma that modulates the immune, vascular and coagulation systems. Immunol. Cell Biol. 2005;83:106–118. doi: 10.1111/j.1440-1711.2005.01320.x. [DOI] [PubMed] [Google Scholar]
- 45.Shigekiyo T., Yoshida H., Kanagawa Y., Satoh K., Wakabayashi S., Matsumoto T., Koide T. Histidine-rich glycoprotein (HRG) Tokushima 2: novel HRG deficiency, molecular and cellular characterization. Thromb. Haemost. 2000;84:675–679. [PubMed] [Google Scholar]
- 46.Shigekiyo T., Yoshida H., Matsumoto K., Azuma H., Wakabayashi S., Saito S., Fujikawa K., Koide T. HRG Tokushima: molecular and cellular characterization of histidine-rich glycoprotein (HRG) deficiency. Blood. 1998;91:128–133. [PubMed] [Google Scholar]
- 47.Tsuchida-Straeten N., Ensslen S., Schäfer C., Wöltje M., Denecke B., Moser M., Gräber S., Wakabayashi S., Koide T., Jahnen-Dechent W. Enhanced blood coagulation and fibrinolysis in mice lacking histidine-rich glycoprotein (HRG) J. Thromb. Haemost. 2005;3:865–872. doi: 10.1111/j.1538-7836.2005.01238.x. [DOI] [PubMed] [Google Scholar]
- 48.Lee C., Bongcam-Rudloff E., Sollner C., Jahnen-Dechent W., Claesson-Welsh L. Type 3 cystatins; fetuins, kininogen and histidine-rich glycoprotein. Front. Biosci. 2009;14:2911–2922. doi: 10.2741/3422. [DOI] [PubMed] [Google Scholar]
- 49.Smith N.L., Chen M.H., Dehghan A., Strachan D.P., Basu S., Soranzo N., Hayward C., Rudan I., Sabater-Lleal M., Bis J.C., Wellcome Trust Case Control Consortium Novel associations of multiple genetic loci with plasma levels of factor VII, factor VIII, and von Willebrand factor: The CHARGE (Cohorts for Heart and Aging Research in Genome Epidemiology) Consortium. Circulation. 2010;121:1382–1392. doi: 10.1161/CIRCULATIONAHA.109.869156. [DOI] [PMC free article] [PubMed] [Google Scholar]
- 50.Ireland H., Konstantoulas C.J., Cooper J.A., Hawe E., Humphries S.E., Mather H., Goodall A.H., Hogwood J., Juhan-Vague I., Yudkin J.S. EPCR Ser219Gly: elevated sEPCR, prothrombin F1+2, risk for coronary heart disease, and increased sEPCR shedding in vitro. Atherosclerosis. 2005;183:283–292. doi: 10.1016/j.atherosclerosis.2005.02.028. [DOI] [PubMed] [Google Scholar]
- 51.Reiner A.P., Carty C.L., Jenny N.S., Nievergelt C., Cushman M., Stearns-Kurosawa D.J., Kurosawa S., Kuller L.H., Lange L.A. PROC, PROCR and PROS1 polymorphisms, plasma anticoagulant phenotypes, and risk of cardiovascular disease and mortality in older adults: the Cardiovascular Health Study. J. Thromb. Haemost. 2008;6:1625–1632. doi: 10.1111/j.1538-7836.2008.03118.x. [DOI] [PMC free article] [PubMed] [Google Scholar]
- 52.Ireland H.A., Cooper J.A., Drenos F., Acharya J., Mitchell J.P., Bauer K.A., Morrissey J.H., Esnouf M.P., Humphries S.E. FVII, FVIIa, and downstream markers of extrinsic pathway activation differ by EPCR Ser219Gly variant in healthy men. Arterioscler. Thromb. Vasc. Biol. 2009;29:1968–1974. doi: 10.1161/ATVBAHA.109.191551. [DOI] [PMC free article] [PubMed] [Google Scholar]
- 53.Tang W., Basu S., Kong X., Pankow J.S., Aleksic N., Tan A., Cushman M., Boerwinkle E., Folsom A.R. Genome-wide association study identifies novel loci for plasma levels of protein C: the ARIC study. Blood. 2010;116:5032–5036. doi: 10.1182/blood-2010-05-283739. [DOI] [PMC free article] [PubMed] [Google Scholar]
- 54.Ghosh S., Pendurthi U.R., Steinoe A., Esmon C.T., Rao L.V. Endothelial cell protein C receptor acts as a cellular receptor for factor VIIa on endothelium. J. Biol. Chem. 2007;282:11849–11857. doi: 10.1074/jbc.M609283200. [DOI] [PMC free article] [PubMed] [Google Scholar]
- 55.López-Sagaseta J., Montes R., Puy C., Díez N., Fukudome K., Hermida J. Binding of factor VIIa to the endothelial cell protein C receptor reduces its coagulant activity. J. Thromb. Haemost. 2007;5:1817–1824. doi: 10.1111/j.1538-7836.2007.02648.x. [DOI] [PubMed] [Google Scholar]
- 56.Jackson C.J., Xue M. Activated protein C—an anticoagulant that does more than stop clots. Int. J. Biochem. Cell Biol. 2008;40:2692–2697. doi: 10.1016/j.biocel.2007.12.013. [DOI] [PubMed] [Google Scholar]
- 57.Gandin V., Miluzio A., Barbieri A.M., Beugnet A., Kiyokawa H., Marchisio P.C., Biffo S. Eukaryotic initiation factor 6 is rate-limiting in translation, growth and transformation. Nature. 2008;455:684–688. doi: 10.1038/nature07267. [DOI] [PMC free article] [PubMed] [Google Scholar]
Associated Data
This section collects any data citations, data availability statements, or supplementary materials included in this article.