Abstract
The slow development of cost-effective medical microdevices with strong analytical performance characteristics is due to a lack of selective and efficient analyte capture and signaling. The recently developed programmable bio-nano-chip (PBNC) is a flexible detection device with analytical behavior rivaling established macroscopic methods. The PBNC system employs ≈300 μm-diameter bead sensors composed of agarose “nanonets” that populate a microelectromechanical support structure with integrated microfluidic elements. The beads are an efficient and selective protein-capture medium suitable for the analysis of complex fluid samples. Microscopy and computational studies probe the 3D interior of the beads. The relative contributions that the capture and detection of moieties, analyte size, and bead porosity make to signal distribution and intensity are reported. Agarose pore sizes ranging from 45 to 620 nm are examined and those near 140 nm provide optimal transport characteristics for rapid (<15 min) tests. The system exhibits efficient (99.5%) detection of bead-bound analyte along with low (≈2%) nonspecific immobilization of the detection probe for carcinoembryonic antigen assay. Furthermore, the role analyte dimensions play in signal distribution is explored, and enhanced methods for assay building that consider the unique features of biomarker size are offered.
1. Introduction
The rapid, reliable, and efficient measurement of multiple key biomarkers simultaneously at the point-of-care (POC) has the potential to transform clinical laboratory science.[1,2] Towards this goal, significant research programs have reported analysis platforms based on lab-on-a-chip and micro total analysis system concepts, nanotechnology, and microfluidics.[3–16] Due to the miniaturized nature of these designs, sample- and reagent-volume requirements decrease, costs shrink, and assay times may be cut substantially.[17–20] Unfortunately, the completion and launch of systems based on these premises is largely unrealized.[5,20–22] Lack of scalability, reactive surface fouling, and designs functional for only one analyte prevent broad clinical acceptance of these approaches.[22–24] These chip-based structures often remain dependent on macroscopic laboratory infrastructure and, while analysis cores are markedly smaller than benchtop alternatives, the network of support structures required for sample processing, data collection, and reagent handling render these platforms “chips-in-a-lab”, rather than true “labs-on-a-chip”.
To overcome these challenges, our laboratory has sustained efforts over the past decade to improve the current state of biosensing through the development of programmable bio-nano-chip (PBNC) approaches.[25–30] Employing 3D “nanonets” composed of agarose strands supported within 280 μm beads and a fluorescent signal output from nanoparticles (nano), the PBNC immobilizes and quantitates medically relevant species (bio) from complex samples within an enclosed miniature flow chamber (chip). This chemical processing unit uses an etched silicon or stainless-steel chip populated with sensitized beads to quantify proteins, oligonucleotides, small molecules, and ions.[31–34]
Versus gold-standard systems, such as enzyme-linked immunosorbent assay (ELISA), the PBNC has assay times measured in minutes rather than hours, limits of detection two or more orders of magnitude lower, and a multiplex capacity of 6 or more concurrent analytes with internal controls. Like ELISA, the PBNC utilizes a sandwich immunoassay; however, the immunocomplexes are present throughout the 3D bead matrix, rather than deposited on a 2D flat surface. These initial observations provide some information about the nature of molecular transport within the beads. However, they also catalyze the emergence of additional questions related to the exact mode of transport and the influence the agarose density/pore size has on the time course of reagent capture.
Penetration to the bead center could be restricted by three mechanisms.[35] First, because the pore size of the beads is many orders of magnitude lower than its diameter, very little convection (i.e., pressure-driven flow) may occur inside the beads. Second, the small-diameter pores may sterically hinder the diffusion of the protein into the bead center. Finally, the antibody load may be so high and the interaction with antigen so fast that the reagent-capture rate is substantially faster than the diffusion–convection rate. In order to determine which of these effects is most important, we study the reagent distribution, transport, and capture of bioanalytes within the internal pore structure of the agarose beads. This behavior is compared to the planar and well established ELISA approach.[36,37] Epifluorescence and confocal microscopy, computational fluid dynamics (CFD) modeling of reagent transport, and three-color colocalization studies are used to determine the impact of biomarker size and bead porosity, along with antibody loading levels, on immunocomplex formation and its associated signaling characteristics.
2. Results and Discussion
Protein-measurement methods based on ELISA often rely on surface areas (rather than volumes) as the underlying support for detection. This approach to immunoassay has been the norm for decades, despite the presence of many inefficiencies.[35] First, the capture elements are usually coated noncovalently to the plate surface via passive adsorption, with each antibody possessing a different affinity for the substrate and antigen-binding constants.[38] Second, control of antibody orientation is largely absent in the standard ELISA method. Not only can the reactive site be directed away from the sample, but layering or crowding can prevent antigen binding due to a high concentration of antibody at the detection surface.[39] Third, due to the noncovalent method of attachment, antibody may leach off during wash steps. Finally, the extent of antibody coating is highly dependent upon its diffusion coefficient in the coating buffer, the ratio of surface area being coated to the volume of reagent solution, as well as the time and temperature of the coating step.[36] Because of this behavior, some studies estimate that the fraction of capture antibodies remaining active and capable of binding antigen is below 10%.[40] Despite the growing number of mulitiplex ELISA reports, such protocols are not routine and further practical limitations, such as the need for a lab-based infrastructure, including spectrophotometer, incubator, and manual liquid handling, all motivate work towards new protein-measurement systems for use at the POC.[41]
2.1. Avidity Effects
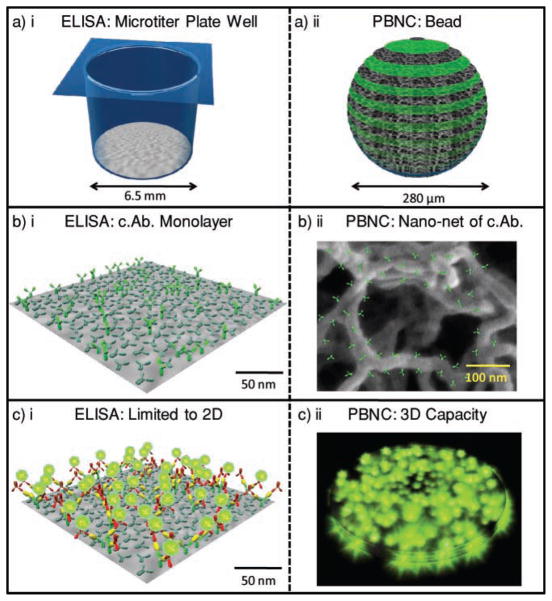
Figure 1 highlights the size differences between the PBNC and ELISA via a space-filling model. A typical microtiter well has a diameter of 6.5 mm at a depth of 1 cm for a volume of ≈330 μL. For the monolayer area of 1.33 cm2 and IgG area of 1.5 × 10⁻¹¹ cm2, a best-case estimate of 9 × 10¹¹ antibodies may be arranged in this space. This value is an order of magnitude larger than the 9 × 10¹⁰ copies of IgG antibody present in an agarose bead when using typical 1 mg mL−1 antibody-coating concentrations.[32,42] However, when volumes are considered (330 μL well versus a 0.011 μL bead), the density of antibodies is 2.9 μm−3 for ELISA and 8.2 × 103 μm−3 for the agarose system, nearly a 3000-fold increase. More important than density, is the arrangement of antibody in the bead and its contribution to the high avidity observed in the bead-based sensor. Avidity describes a highly effective, multivalent mode of analyte capture and immobilization. The agarose beads, and their nanonet of fibers, have high avidity (Figure 1bii). Through this process, each antigen molecule interacts with many capture antibodies (c.Ab.) in a 3D arrangement and the effective kd (dissociation or off) rate is reduced. Nearly all bound antigen is retained for signaling, an observation confirmed by the below studies and other literature reports.[32,43,44] Bead behavior is controlled by the concentration of agarose used in bead preparation, which range from 0.5 to 8 wt%.[45] The upper size range is limited by loss of elasticity while the lower range yields problems with the mechanical properties of the beads and deformation in the flow chamber.
Figure 1.
Reagent usage in sandwich immunoassay systems. Fundamental differences between ELISA and the bead-based PBNC for protein measurements include size and structure. By using a) 3D versus 2D reaction areas and b) a lattice of capture antibodies versus a planar system, c) the PBNC allows for a higher density of reagent capture centers and thus a high capacity for reporting analyte.
2.2. PBNC Construction and Behavior
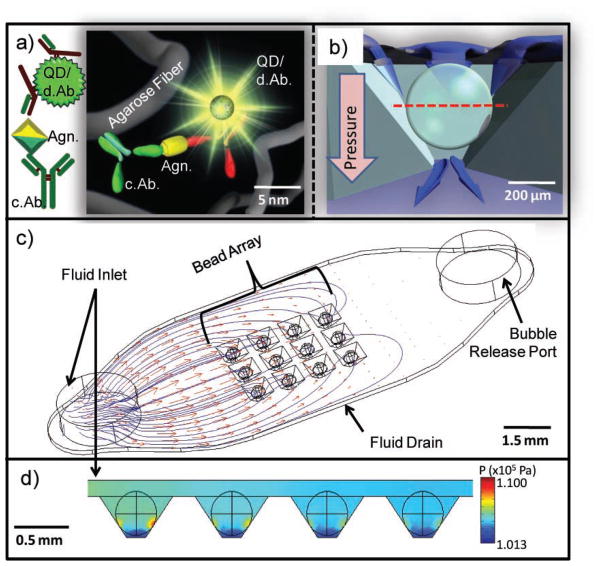
Although agarose has been studied by a variety of methods, few studies have examined it in bead form for the purpose of biomarker quantitation.[35,46] Most agarose reports explore it as an electrophoresis gel or as a chromatography solid-phase support via atomic force microscopy (AFM), dynamic light scattering, electrochemical, or optical methods.[47–53] In this study, bead behavior is investigated directly in the PBNC, the construction of which has been described previously.[26,30] Figure 2 illustrates that the beads consist of agarose filament, signaling particles, and immunoreactive bioligands, all on the nanometer scale (Figure 2a). This network of chemical components forms the 280 μm bead, which rests within an inverted pyramidal support chamber (Figure 2b). The chip contains an array of these support wells (Figure 2c) and CFD modeled the flow distribution and pressure within a 3 × 4 array of 280 μm agarose beads resting in square pyramidal wells. Figure 2c shows particle streamlines and velocity profiles of reagent delivery through a 1.6 mm-diameter inlet with a flow rate of 1600 μL min−1. The flow velocity drops considerably as the fluid passes around the beads and through the drain channel underneath the array. The mean velocity around the bead for each well at the bead–well contact plane is 1690 μL min−1 with a relative standard deviation (RSD) of 14.8%.
Figure 2.
PBNC construction. a) Immunoreagents, signaling particles, and agarose fibers are assembled on the nanometer scale and form the micrometer-sized bead reactor. Detecting antibodies are labelled d.Ab. and capture antibodies are labelled c.Ab. b) Cross section of the bead in the chip container with a red line indicating the optical section used in subsequent confocal images (note pressure gradient). c) CFD model visualizing particle streamlines and velocity profiles with an inlet velocity of 1600 μL min−1 show nonuniform delivery of fluids to the bead array. d) High pressure is localized at the bead–well contact points with a well-to-well RSD of 12.6%. The units of the color scale bar are kPa.
The nonuniform delivery of reagents results in lower capture of analytes in each successive column of beads away from inlet port. Figure 2d maps the declination in column pressures with the highest pressure localized at the points of contact between the bead and well. The overall projected pressure drop is 34.7 kPa with a well-to-well RSD of 12.6%. The distribution of flow rates between wells depends on the chip and well design, and will be studied in more detail in future publications.
The agarose beads serve the dual role of analyte capture and signal generation and reagent capture is observed both on the bead exterior and interior.[26] Previously, in studies with overnight incubation periods completed in micro-centrifuge tubes, confocal microscopy measurements confirmed that all three components (capture antibody, antigen, detecting antibody) of a C-reactive protein (CRP) assay are localized throughout the entire agarose microsponge due to diffusion.[54] Alternatively, 21-mer oligonucleotides penetrate to the bead core after 330 min with pressure-driven flow.[33]
The diffusion-limited nature of the bead explains some of the difference in time course for ions, protons, oligonucleotides, and proteins. Furthermore, these considerations explain why a quick wash of 1.1 mL min−1 for 1 min is insufficient to remove unbound fluorescent antibody for low backgrounds. Although this wash is greater than 8000 bead volumes of rinse material, a 5 min, 0.2 mL min−1 cycle is required to allow material in the bead core adequate time to diffuse to the surface, where it is removed by pressure-driven flow.[32]
2.3. Spatial Arrangement of Reaction Components
2.3.1. Capture Antibody
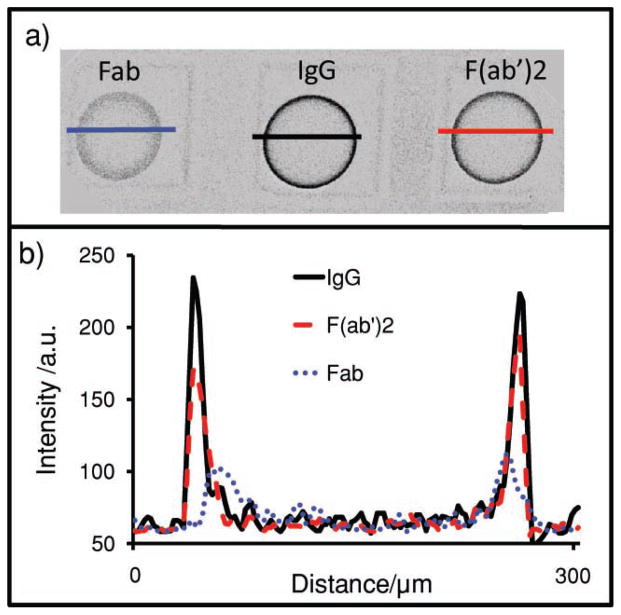
In addition to diffusion, the signal is controlled by the capture antibody. Figure 3 illustrates the differences in antigen distribution for a carcinoembryonic antigen (CEA) assay system using bead types with three different capture antibody fragments: Fab (7.5 nm), F(ab′)2 (15 nm), and IgG (15 nm). The distances in parentheses are the maximum dimension of the protein. All bead types contain 0.092 mg of capture antibody per milliliter of beads. In Figure 3a, medial z-slices (xy plane, recall Figure 2b) of three different beads types and fluorescently labeled CEA antigen are probed by confocal microscopy. Ratios of signal-to-noise for the beads of 11.7, 16.9, and 20.5 were measured for Fab, F(ab′)2, and IgG beads, respectively. There is a progressive increase in signal with increasing capture-element size, despite the decreasing copy number implied by different molecular weights for the same weight-based loading level of protein. These molecular-weight differences suggest that more copies of the smaller fragments are present on a per-bead basis, but changes in binding affinity still result in less signal.[55]
Figure 3.
Antigen location in beads. a) Confocal image of the bead’s medial-slice antigen location in 2 wt% agarose beads with either Fab, IgG, or F(ab′)2 as the capture antibody. Line profiles were then drawn across the beads. b) Intensity of the line profiles from the three different bead types reveal differences in both signal and location. As the capture antibody becomes larger (IgG), beads sequester more of their target on the exterior. Smaller capture elements (Fab) allow penetration of analyte deeper into the interior of the beads.
More interesting is the different behavior in bead penetration. Note the narrow distribution of antigen in the IgG bead, that is, the near-uniform arrangement of signal on the periphery. This is in contrast to the less monodisperse signal in the Fab beads. Five different 136-pixel (393 μm) line profiles characterized each bead (Figure 3b) with average line profiles shown in Figure 3a. Penetration depth is calculated using the half-maximum approach: the highest intensity and half-maximum intensity values are identified and correlated to a spatial pixel location. The pixel difference between the two is then converted into distance as expressed in micrometers. Values of 19.5 ± 1.4, 23.8 ± 4.9, and 29.6 ± 2.8 μm were measured for IgG, F(ab′)2, and Fab beads, respectively. The antigen penetrates 1.5 times deeper into the bead interior via Fab beads relative to whole IgG, an observation attributed to decreased pore occlusion by the smaller immunoreagents.
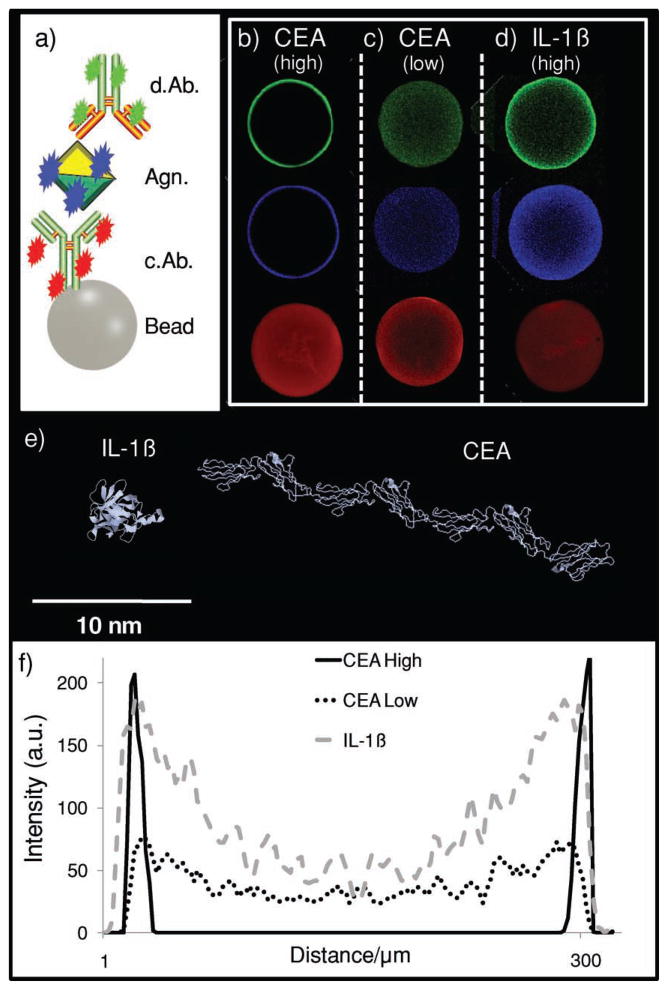
Next, a series of three-color experiments explore the location of capture and detection of antibody in addition to antigen (Figure 4). In these experiments, only whole CEA IgG is used for both capture and detection of antibody. Two different categories of capture antibody were covalently bound to the beads: ‘low-concentration’ beads contained 9.6 μg of capture antibody per milliliter of beads; ‘high-concentration’ bead types load 0.23, 0.25, and 0.26 mg mL−1 from a starting solution of 0.29 mg mL−1 capture antibody for 1, 2, and 4% beads, respectively. This loading level sequesters a large amount of analyte from the liquid sample. For example, 12 beads with 0.25 mg mL−1 of capture antibody contain 2.2 × 10⁻¹³ moles of capture antibody capable of binding 4.4 × 10⁻¹³ moles CEA (i.e., through two active sites per IgG). For the 180 kDa CEA antigen, this corresponds to 80 ng.[56] When the 10 μL specimen volumes are considered, a ≈8000 ng mL−1 potential preconcentration/depleting power is possible, a value much higher than the physiologically relevant range of most biomarker proteins.
Figure 4.
Immunocomplex location. a) A three-color identification approach is used for different assay systems. b–d) The distribution of medial-slice signal for capture antibody (red), analyte (antigen, blue), and detecting antibody (green) is seen. The CEA assay system in (b) contains 0.26 mg mL−1 capture antibody, a value that is high relative to the 9.6 μg mL−1 in (c). While both the high and low values show complete penetration of capture antibody into the bead core, only the lower system allows analyte and detecting antibody to penetrate past the bead periphery. In the assay system in (d), again, a high amount of capture antibody is used. However, this antibody is specific to the interleukin-1β (IL-1β) protein. e) IL-1β is much smaller than CEA. Because of this, the smaller, globular IL-1β protein (5 nm) allows for deeper penetration of immunoassay components even at high concentration of capture antibody.[64] f) Line profiles indicate antigen-penetration patterns for the three different assay systems with differences in intensity and distribution.
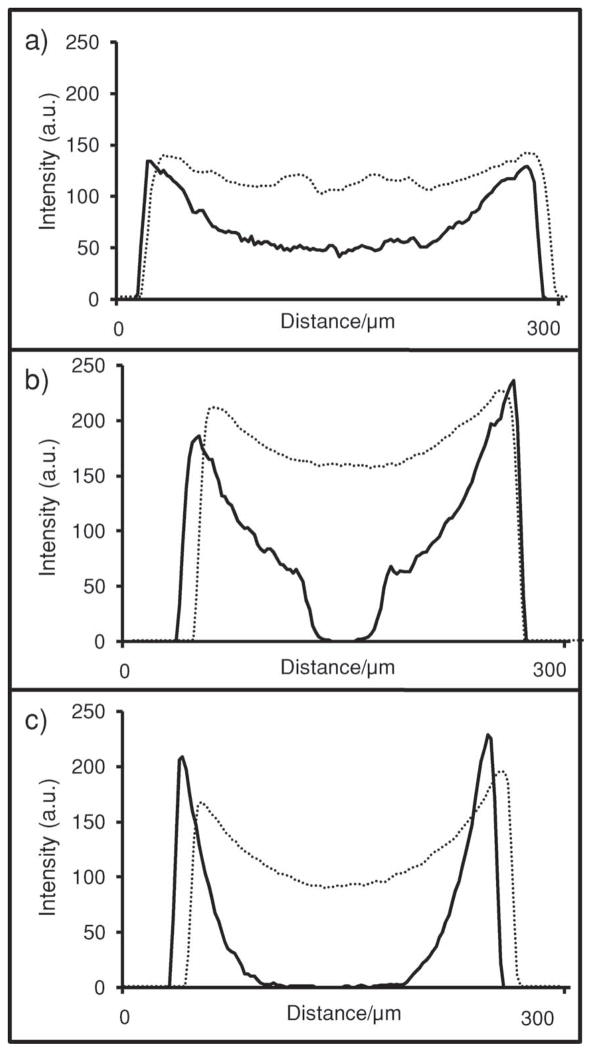
The high- and low-concentration bead sets have very different signal patterns. Here, capture antibody appears as red fluorescence, antigen is labeled blue, and detecting antibody is visualized with green (Figure 4a). For beads with a higher concentration of capture antibody, complete penetration of capture antibody is seen, while at lower levels, incomplete entry is seen. Although this experiment is completed for three different agarose types, 1, 2, and 4%, only the 1% beads are shown in Figure 4, with the remainder presented in Figure 5. This figure shows line profiles drawn across the beads, similarly to Figure 3. Because the 2 and 4% beads have a higher concentration of agarose, and thus more reactive sites, than 1% beads, they are capable of completely depleting the labeled capture antibody present in the low-concentration case. For 500 μL of the 9.6 μg mL−1 case, 3.1 × 10⁻¹¹ mol of capture antibody is present in the starting solution and corresponds to 1.4 × 10⁻¹⁵ mol per bead (21 700 beads per 500 mL; see below). Here, the same number of moles of antibody is distributed over a smaller volume in the denser beads (3.3 × 10⁻²² mol μm−3 for 4%; 1.8 × 10⁻²² mol μm−3 for 2%; 1.6 × 10⁻²² mol μm−3 for 1%).
Figure 5.
Capture-antibody behavior changes with bead type and concentration. Low concentration (9.6 μg mL−1; solid) and high concentration (0.25 mg mL−1; dashed) of capture antibody as shown by line profiles. The 0.25 mg mL−1 is an excess and allows complete penetration into the center for all bead types. At low concentrations, the 1 wt% agarose beads (a) have an excess of capture reagent, allowing this signal to penetrate all the way to center. In contrast, the 2% (b) and 4% (c) beads have more active sites, effectively depleting the reagent before penetration to center is possible.
The differences in antigen and detecting-antibody signal between the high- and low-capture antibody loading levels within the bead illustrates the striking impact capture-antibody concentration has on the spatial distribution of immunocomplex formation within the beads. Both antigen and detecting-antibody penetration increases in the lower concentration beads when antigen concentrations near the dose-curve maximum are used. Versus the ≈10 μm antigen penetration depths in all high-concentration beads, the 9.6 μg mL−1 beads have antigen and detecting-antibody penetration depths of 52.0, 43.4, and 20.2 μm for 1, 2, and 4 wt% agarose, respectively. These results suggest that, at high concentrations of capture antibody, the immunocomplex occludes the agarose nanonet structures and may prevent maximum usage of the bead internal substrate.
2.3.2. Antigen
While the size and concentration of the capture antibody affect the signal, so too does the molecular weight of the antigen. An examination of the influence antigen size has on the final distribution of signal in a sandwich immunoassay within the PBNC is important, as any multiplexed assay with a sizeable number of analytes will contain antigens of various molecular weights, radii of gyration (Rg), and thus maximum diameter. In addition to the CEA (27 nm antigen; Figure 4e) assay described above, interleukin-1β (IL-1β, 4.5 nm antigen; Figure 4e) was also studied, both at ≈0.26 mg of capture antibody per milliliter of bead. For the CEA system (Figure 4b), antigen penetration depths of 10.1 ± 2.0, 10.1 ± 2.0, and 8.5 ± 0.2 μm were observed for 1, 2, and 4% aga-rose, respectively, although only 1% beads are displayed. The IL-1β beads exhibited antigen binding much deeper into the bead (Figure 4d). Penetration depths of 78.0 ± 6.7, 57.1 ± 5.5, and 41.9 ± 1.7 μm are achieved for 1, 2, and 4% agarose, respectively. The CEA antigen has a maximum dimension approximately five times that of IL-1β antigen and results in different diffusion coefficients and penetration depths approximately five times less. In this case, the size of the antigen cannot be changed, but the assay can changed to fit the analyte. By using amounts of capture antibody on the microgram per milliliter regime, complete penetration is achieved.
We measured the amount of nonspecific detecting-antibody binding and unlabeled analyte immobilized on bead with the technique of Bolte and Cordelières to determine the percentage overlap between the two colors via a digital-pixel-mapping registration process.[57] In the CEA experiments, the amount of blue (antigen) signal colocalized with green (detecting antibody) was 99.5% and the amount of green signal colocalized with blue was 97.9%. Thus, <0.5% of all antigen immobilized on the bead is not later transduced as signal. Furthermore, only 2.1% of green signal is present on the bead nonspecifically. The Pearson correlation between these two populations of pixels was 0.949. The intensity coefficient quotient (ICQ; maximum = 0.5) was also high at 0.493. For the IL-1β assay, the amount of blue colocalized with green was 95.9%; the Pearson value is 0.887 and ICQ = 0.448. This lower degree of correlation is attributed to the more diffuse signal pattern. Overall, these experiments reveal the assay’s efficient detection of bead-bound CEA and IL-1β antigen, while preventing nonspecific binding of the detecting species.
2.4. Bead Volume Utilization
As Figure 5 indicates, for the high-concentration (≈ 0.26 mg mL−1) capture-antibody beads, only the outer shell (≈40%) of the bead exterior is ever exposed to the entire immunocomplex. For beads with the higher concentration of capture antibody, void volumes of 60.3, 59.6, and 67.1% of the 1.15 × 107 μm3 potential volume were calculated for 1, 2, and 4 wt% agarose beads, respectively. This unused volume decreased for the beads with a lower amount (9.6 μg mL−1) of capture antibody to 0.0, 0.1, and 9.6% for 1, 2, and 4 wt% agarose beads, respectively. Although this increased penetration seemingly bodes well for the assay as it utilizes more reactive surface, data that is more meaningful comes from a comparison to the epifluorescent signal. While all data shown comes from the bead’s medial slice via the confocal microscope, the most common data-collection mode for the PBNC is epifluorescent.
While the confocal arrangement is ideal for gleaning data on the bead interior, it disregards the vast amount of signal due to its pinhole design. Furthermore, the confocal depth of field for the measurements here reported is <10 μm versus the ≈50 μm depths seen in epifluorescence, which allow for the collection of much more light. The signals obtained via epifluorescence were 2.4, 4.9, and 4.7 a.u. for the low-concentration 1, 2, and 4% beads, respectively. For the high-concentration (≈0.25 mg mL−1) beads, these values increase to 77.0, 89.5, and 70.6 a.u. For this reason, 2 wt% agarose using a large amount of capture antibody was determined to be the most useful bead for typical applications—full penetration of immunocomplex into bead interior does not necessarily imply increased analytical performance. The best analytical performance comes from a high fluorescent output from detecting antibody, and increased capture antibody captures more antigen/analyte from sample leading to increased amounts of detecting antibody and, hence, more signal.
2.5. Model of Penetration Depths
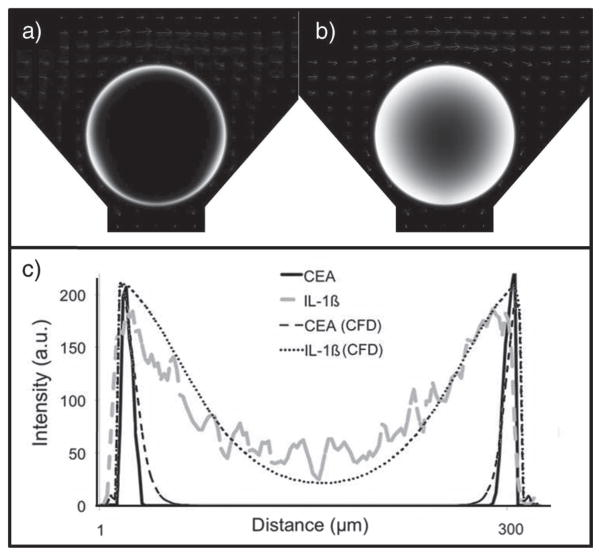
In addition to confocal measurements, CFD methods were used to study antigen penetration into the bead (Figure 6). Due to difficulties in accurately solving a fully 3D model of our bead-based system, a 2D model in the xz plane was constructed. To model the bypasses resulting from the chip’s inverse pyramidal design, the bead was raised from its chip support. The raised height was determined from the mean distance from the well support and bead surface at each z level. The flow-influx velocity was 1600 μL min−1 normalized by the total well width in a 3 × 4 array system. Assuming the flow through each well in the 3 × 4 array to be uniform, the lateral outflow from the top boundary is defined to be three quarters of the influx velocity. The exiting channel to the bottom drain was set to atmospheric pressure. The bead permeability was modeled for a 2% agarose bead with a 140 nm pore size. The association and dissociation constants were set to 107 and 10−5 L mol−1 s−1, respectively. Different antigen penetration patterns are seen in Figure 6a when antigen diffusion coefficients (D) were varied with DCEA and DIL-1 β set to 1.36 × 10⁻⁷ and 6.60 × 10⁻⁶ cm2 s−1, respectively. As illustrated in Figure 6b, CFD solutions compared well with experimental measurements, as described above.
Figure 6.
CFD studies. The studies model a) CEA (D = 1.36 × 10⁻⁷ cm2 s−1) and b) IL-1β (D = 6.60 × 10⁻⁶ cm2 s−1) transport into a 2% agarose (140 nm pore size) bead. c) The IL-1β antigen penetrates dee-per into the bead in both experimental and CFD experiments. CFD intensities are normalized to the experimental maximums.
2.6. Agarose Pore Size
A molecular-level understanding of the agarose strands is critical to optimizing the assay. However, a number of factors, including the heterogeneous nature of the fibers and difficulty maintaining adequate bead hydration, hamper accurate characterization of the agarose beads. Furthermore, literature reports describing agarose are typically of slabs of agarose gel and not the bead structures used in the PBNC.[47–49,58] Nevertheless, valuable information on the structure of the beads and pore sizes within the beads may be interpreted from work by Pernodet[50] and Liu,[59] in which estimates of pore size in the 2% agarose gels range between 100 and 400 nm.
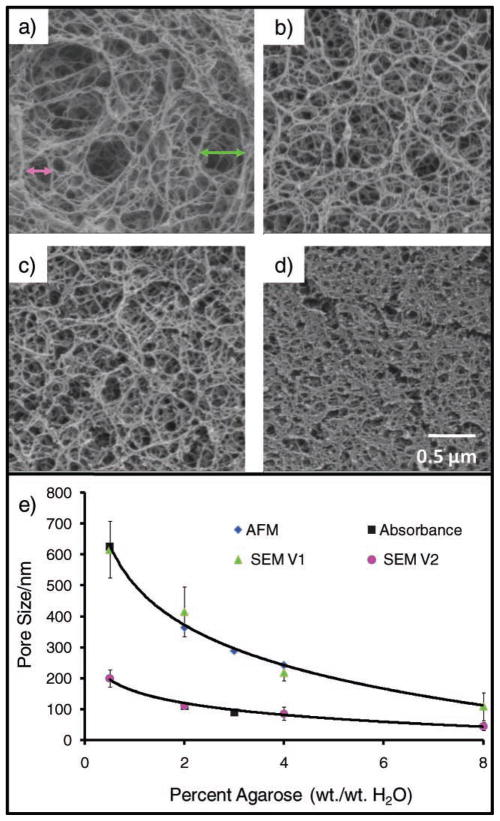
We also explored the surface of the agarose beads using scanning electron microscopy (SEM). The SEM images presented in Figure 7 reveal two different classes of pore sizes. Values for the larger class (Figure 7a; green triangle) of 620 ± 90, 410 ± 80, 220 ± 20, and 110 ± 50 nm were obtained for the 0.5, 2, 4, and 8 wt% agarose gels, respectively. The smaller cluster estimates (Figure 7b; pink circle) are 200 ± 30, 110 ± 10, 86 ± 20 and 45 ± 13 nm for 0.5, 2, 4, and 8 wt% agarose. Importantly, the direct, inverse relationship between the starting concentration of agarose and the size of the pores allows for the careful control of pore size during synthesis and allows for beads specific to different analytes. Though this method is destructive and nonideal while studying the hydrated beads, the pore sizes we observed do compare well with published values. These different approaches to measure pore sizes provide two rough classes of pore sizes, between 100 and 200 nm and between 250 and 600 nm, both of which play a role in the internal analyte transport properties.
Figure 7.
Weight percentage of agarose determines porosity. The beads’ pore size is tunable by selecting the weight percentage of agarose used during synthesis. Here, SEM images for beads of a) 0.5, b) 2.0, c) 4.0, and d) 8.0% illustrate the decrease in pore size as a function of the increasing agarose concentration. Pore-size estimates are based on distances between adjacent agarose fibers. The green and pink arrows in (a) indicate representative measurements used to construct the green and pink curves in e) the plot of pore size as a function of weight percentage of agarose and contrasted with alternative measurement approaches. AFM gives a tight cluster of pore sizes between 200–400 nm,[45] while spectroscopy experiments (absorbance) show a exponential decay.[53] The SEM data correlate to an exponential reduction in pore size with increasing agarose concentrations and correspond with the AFM values.
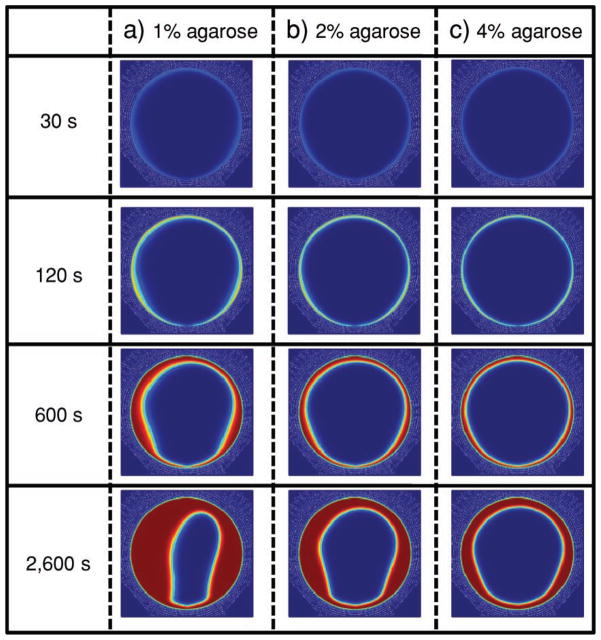
For a further mechanistic understanding of the above data, Figure 8 models analyte immobilization on the bead up to 43 min at a flow rate of 1600 μL min−1 for beads synthesized using 1% (415 nm pore size), 2% (260 nm pore size), and 4% (160 nm pore size) agarose. Pore sizes for these concentrations were calculated from the mean pore size based on AFM and SEM (Figure 7). Images rendered are the xz plane of the bead with red indicating bound analyte. Signal is present at the bead periphery for each pore-size condition after 30 s. After 43 min, loading sites for 1% beads were completely saturated halfway into the bead core while 2% and 4% pore-size beads yielded ≈33% and ≈50% less penetration, respectively. The high-asymmetry phenomenon, witnessed for 1% beads after 43 min, resulted from a rapidly replenished depletion layer at the front side of the bead in contrast to the rear of the bead.[35]
Figure 8.
CFD model of the type of analyte-penetration bead (xz plane). Bound analyte indicated by red in a) 1% (315 nm pore size), b) 2% (225 nm pore size), and c) 4% (150 nm pore size) agarose beads at 1600 μL min−1 inlet flow rate depict higher analyte penetration into beads with lower agarose concentration or a higher pore size.
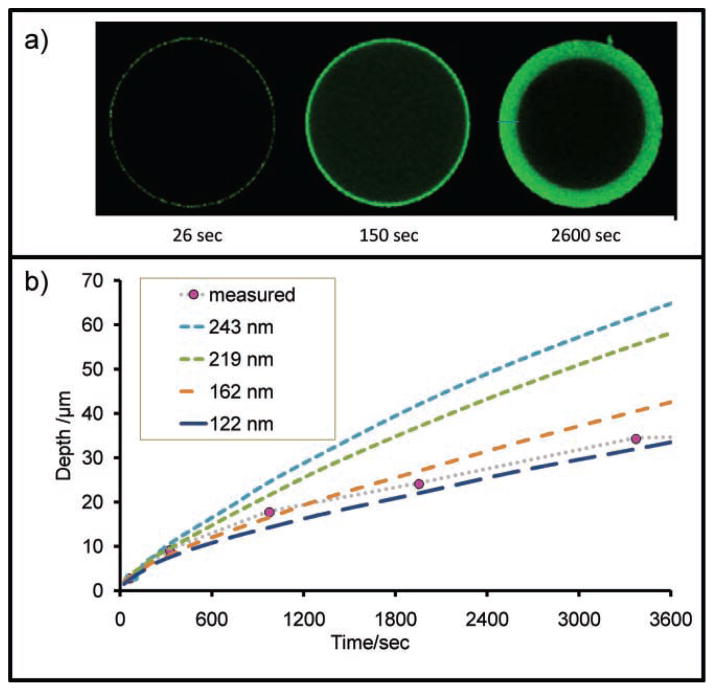
A final study examined the rate at which fluorescently labeled CRP antigen penetrates 2% agarose beads, as observed at the medial slice via confocal microscopy in Figure 9.[54] The images in Figure 9a are the xy plane of the bead. In this work, sample recirculation over beads resulted in a slow, radial penetration of antigen into the core of the capture-antibody-coated beads over a 45 min period. Using the rate of progression and diffusion/binding constants, the size of agarose pores is estimated at 140 nm via computational modeling, which agrees with the measurements in Figure 7 of 2% agarose.
Figure 9.
Bead porosity. a) Labeled CRP antigen was monitored as it entered the bead matrix and used to calculate estimates of pore size. b) Here, additional details including pressure and bead size used in tandem with a penetration-depth-versus-time study yield an estimate of ≈140 nm for the 2 wt% agarose pore size.
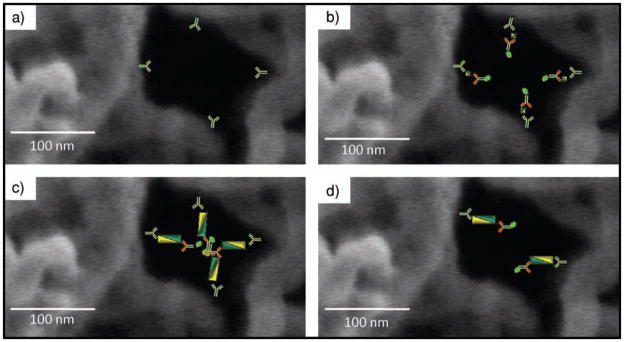
This scale suggests that the 57 nm CEA immunocomplex (15 nm capture antibody +27 nm antigen +15 nm detecting antibody) should pass easily through the 140 nm pore.[60,61] Nevertheless, immunocomplex penetration is restricted to only the outermost regions of the bead with no difference seen between 1, 2, and 4% high-concentration beads (Figure 5). These observations are explained through Equation 1, which calculates the average distance between IgG molecules.
| (1) |
Here, d is the distance between next-nearest-neighbor capture antibodies. This value is a function of the bead size as given by the radius (rb, measured in nanometers), amount of capture antibody conjugated to beads (j, in g mL−1), Avogadro’s number (NA), molecular weight of the capture antibody (MW, in g mol−1), and finally the number of beads per volume (R, in counts per mL−1). For these experiments, R was determined by Kepler’s conjecture as summarized in Equation 2, where Vt is total volume of sample, p.e. is packing efficiency, and Vb is the volume of 1 bead.[58] For these experiments, it was found that 500 μL of sample contained 21 740 beads.
| (2) |
Using this value of beads per volume, 280 μm beads, and 155 kDa IgG molecules, Equation 1 can be reduced to Equation 3, where the constant J = 129 nm3 g mL−1.
| (3) |
With Equation 3 and values of j determined by protein assay before and after binding of capture antibody to beads, the distance between capture elements may be calculated. At the concentrations used above, 0.23 mg mL−1 of capture antibody, the distance between each recognition element is <83 nm, a value theoretically large enough to allow one complete CEA immunocomplex to pass. However, in the event that the pore is lined with capture antibody, an 80 nm passage may become restricted with reagent material, as illustrated in Figure 10. In this case, the two immunocomplexes have a total diameter of 114 (57 × 2) nm, a value larger than the distance between antibodies. When the concentration of capture antibody is reduced to 9.6 μg mL−1, the distance between antibodies increases to 240 nm (Figure 9d). This distance would allow deeper penetration of immunocomplex into the bead, an observation demonstrated experimentally, as shown in Figure 4. The critical concentration of capture antibody that allows deeper penetration is expressed in Equation 4, where dImmuno is the total length of the immunocomplex (57 nm for CEA).
Figure 10.
Occlusion of pores. a) Agarose pore channels coated with capture antibody. b) Smaller bodies, such as IL-1β antigen (4.5 nm, 35 nm immunocomplex), allow penetration deeper into the bead interior than larger immunocomplexes, such as c) CEA (27 nm, 57 nm immunocomplex), which may block reagent transport in the agarose pores. d) At lower concentrations of capture antibody, occlusion is circumvented.
| (4) |
The role of capture antibodies in occlusion of bead passage-ways is explored once again in the fragmentation experiments (Figure 3). Here, the variable is no longer the concentration but the size of capture antibody. At the concentrations used in these experiments (9.6 μg mL−1), the distance between anti-bodies is 110 nm as determined by Equation 3, just below the passage distance of 115 nm CEA immunocomplex dimer. As with the three-color experiments, all antigen is localized to the exterior, with the important exception of the Fab capture fragments. Here, by reducing capture antibody by half to 7.5 nm, a critical distance barrier is achieved, allowing antigen to penetrate deeper into the bead.
3. Conclusion
The analytical performance provided by the PBNC platform is attributable to a number of factors, including microchip design, bead construction, and agarose’s amenability to immunoassays. This technique demonstrates near complete (99.5%) detection of bead-bound analyte, while preventing nonspecific binding of the detecting species (≈2%) as demonstrated for CEA assay.
Agarose is a naturally occurring hydrophilic medium and is ideally suited to interaction with proteins. It possesses high surface area, is easily synthesized, and can be covalently functionalized with antibodies for analyte capture after tuning to the desired size and shape.[26,62] By using agarose at lower concentrations (and thus larger pore sizes), the surface exclusion effects, recently described by Thompson and Bau can partially be overcome, as demonstrated in Figure 4.[35] Furthermore, agarose is easily stored (even when functionalized with bioligands) for months via humicants with no structural degradation or decrease in assay performance.
Through the PBNC approach, many experimental aspects are miniaturized, while carefully considering dimensionality. Critical to this image-based sensor is the 280 μm path length of the agarose microsponge. Although, many of the transport characteristics described here would change as a function of bead size and could potentially be enhanced even further through electrokinetics, the 280 μm beads were selected for a number of reasons.[63] First, they are compatible with cost-efficient optical detection systems, as smaller beads demand more expensive optics. Second, this bead size allows for core/shell PBNC experiments.[31] Third, this size is highly compatible with modular protein arrays. By using the bead as solid-phase support, microfluidic-handling equipment creates biomarker chip arrays. Finally, at 280 μm, the agarose bead serves as a ‘miniaturized cuvette’.
ELISA and other monolayer systems yield high transmittance in absorbance experiments and a small amount of excitation in fluorescence, obligating extra amplification steps using the full well’s volume to develop measurable signals. In the 3D bead, all reagent capture and signal generation occur in the same volume and the effective signal-generation thickness is 1000–20 000 times larger than the ELISA monolayer. The bead is index matched to the aqueous analysis fluids and serves as both a cuvette and a preconcentration medium. Using this approach, the same amount of reagent material that would be present in a 2D reaction space, as employed in ELISA, is used in a 3D arrangement. This spherical approach circumvents the fundamental signaling limitations of flat surfaces to enable modular and multiplexed applications.[53]
4. Experimental Section
Reagents
Detecting- and capture-antibody pairs specific to CEA were purchased from Fitzgerald (Concord, MA) as was recombinant CEA antigen. For IL-1β assay, matched monoclonal antibody pairs were purchased from R&D Systems (Minneapolis, MN) and antigen procured from Cell Sciences, Inc. (Canton, MA). Detecting antibody was labeled with AlexaFluor 488, capture antibody with AlexaFluor 647, and antigen was tagged with AlexaFluor 546, all from Invitrogen (Carlsbad, CA). Labeling was performed by adding a 500 μL aliquot of protein at ≈1 mg mL−1 to powdered fluorophore followed by incubation with stirring for 1 h. Unbound fluorophore was separated from labeled protein using size-exclusion chromatography. Purified human CRP was obtained from Cortex Biochem (San Leandro, CA). Rabbit anti-human CRP was obtained from Accurate Chemical and Scientific Corp. (Westbury, NY). Rabbit anti-human IgE was purchased from Bethyl Laboratories Inc. (Montgomery, TX). Agarose powder type I-B and sorbitan trioleate (Span 85) were obtained from Sigma-Aldrich (St. Louis, MO). Sodium borohydride, hexanes, sodium cyanoborohydride, and sodium periodate were obtained from Fisher Scientific (Fair Lawn, NJ). Both Fab and F(ab′)2 fragments were prepared via ficin. Reagents needed for antibody fragmentation were purchased from Pierce (Rockford, IL) and included immobilized ficin on 6% agarose beads in storage buffer (>1.8 mg of ficin per milliliter of resin), cysteine hydrochloride, pH 6 digestion buffer (10×), pH 8 protein A binding buffer with ethylenediaminetetraacetic acid (EDTA), pH 6 elution buffer, and protein A columns with protein A immobilized onto 6% cross-linked agarose (2.5 mL) with a binding capacity of 6–8 mg of mouse IgG.
Bead Preparation and Operation
Agarose was added to water (50 mL) between 1–8 wt% and heated to 85 °C in a water bath. A suspending solution of 10 mL Span85 in 100 mL n-heptane was heated to 61 °C. After introduction of the agarose mixture into the suspending solution, stirring proceeded for 1 min. As the temperature dropped with vigorous stirring, the agarose gel precipitated to the bottom of the flask. Beads used for the antibody-fragment studies were subjected to a cross-linking procedure, while those of tuned porosities remained uncrosslinked. Beads were washed with a 50/50 ethanol/water mixture for hydration, size sorted via sieving, and stored at 4 °C until use. For linkage of antibodies and antibody fragments to the beads, the sodium cyanoborohydride technique of reductive amination was used; all reactions were allowed to proceed overnight with mild shaking.[26,62] After conjugation, protein assays (Bradford or A280) were used to determine the amount of antibody remaining in the supernatant, allowing calculation by mass balance of antibody bound to beads. Assays were performed at room temperature under continuous-flow conditions. A 5 min delivery of 1% bovine serum albumin (BSA) in phosphate-buffered saline (PBS) comprised the blocking step to reduce nonspecific binding (1.1 mL min−1); next, antigen incubation with sample recirculation for 15 min exposed sample to the beads three times (0.2 mL min−1); this was followed by a 2 min PBS wash (1.1 mL min−1) and a 5 min detecting antibody exposure (0.1 mL min−1); the assay was followed by stringent washings and image acquisition.
Microscopy
Beads were loaded into a silicon chip and sealed into the PBNC underneath the microscope(s). Using the adjustable gain, offset, and exposure time of the digital camera (DVC Co., Austin, TX), settings were found to image beads with no saturation of pixel intensity. These images were saved as 12-bit TIFF files. Epifluorescent images used an Olympus BX2 instrument and confocal images were taken with a Leica microscope with a model TCS SP2 acousto-optical beam splitter and a 10× objective of 0.3 numerical aperture. Optimal settings for gain and offset on the Leica instrument were determined by using a quantitative lookup table and pixel-saturation values. Bead medial sections were determined by scanning in the z direction until maximum slice width, indicating that the bead’s medial plane was in focal plane. For data collection, channels were collected sequentially to eliminate cross talk and eight images were averaged into a single scan to increase the resolution and decrease pixelation. SEM images were obtained on a LEO Model-1530 SEM system (Carl Zeiss Inc., North America). Standardized metallic screens were purchased from W.S. Tyler (Mentor, OH) and Newark Wire Cloth Company (Clifton, NJ). Sample drying at the critical point was performed on a Samdri 790 from Tousimis (Rockville, MD).
The red fluorescence corresponding to capture antibody in Figure 5c has an intensity similar to that of Figure 5b, despite having a concentration of capture antibody, and thus red fluorophore, nearly 25 times lower. This is a result of the two images being captured under different optical settings. As the exposure time of the raster scan was fixed, quality image capture of these less-fluorescent samples required more sensitive gain and offset settings. To confirm that the periphery-isolated patterning signal seen in the high-concentration beads was a function of fluorochrome presence and not due to sensitivity of the photomultiplier tube detector, a series of images were captured at identical optical settings as those of the beads with lower concentrations of capturing antibody. Here, gain values for red, green, and blue were increased from 341, 477, and 680 to 526, 752, and 696, respectively. Importantly, the intensity of the fluorescent signal in the higher concentration beads increases, but the distribution does not (images not shown). Thus, we conclude that the exterior-focused antigen and detecting-antibody signal seen on the higher concentration CEA beads is a true representation of the bioanalyte location and is not a photomicrographic optical artifact. To determine whether the blue- and green-channel signal seen in the 9.6 μg mL−1 capture antibody beads was a function of spectral bleed at high gain, the beads were analyzed prior to introduction of antigen and detecting antibody at the more sensitive optical settings described above. No green or blue signal was present indicating that the fluorescence reported is indeed suggestive of the presence of the antigen and capture antibody and not artifacts in the photomicrograph. Red, green, and blue channels were collected sequentially.
Image Analysis
Photomicrographs were saved as 12-bit colorized TIFF files and analyzed via ImageJ software from the National Institute of Health (NIH; Bethesda, MD) with the intensity of the bead fluorescence signal correlating to the concentration of analyte in the sample. Data-interpretation macros, written in Java, converted the image to a grayscale 8-bit image with areas of interest (AOIs) drawn corresponding to individual beads. These AOIs serve as a rough boundary in which the bead resides. The signal was determined by scanning each AOI one row of pixels at a time; the highest pixel value from each successive line profile was then averaged to calculate a mean signal. Additional data analysis of colocalization was performed using ImageJ supplemental code “Just Another Colocalization Plugin” (JACoP) available at the ImageJ website courtesy of the NIH.[57] This Java-based code maps pixels of different color channels together and uses intensity and spatial location to determine the degree of overlap.
Computational Modeling
CFD modeling for convection, diffusion, and reaction (binding) in the PBNC system were performed using COMSOL Multiphysics 3.5a (COMSOL, Inc, Burlington, MA) with the Chemical Engineering module add-on. Models were solved on a quad-core Dell Power Vault NF600 with 8 GB of memory. Full three-dimensional models of the system were designed but, due to convergence difficulties, a two-dimensional model was constructed. Brinkman equations, a modified version of Navier–Stokes equations that account for flow through porous media using the Darcy pressure-flow permeability, were implemented and solved in static-solution mode to obtain the steady-state solution for the flow field. Convection–diffusion equations (with reaction terms set to model reversible antibody–analyte binding) were then implemented and solved in transient-solution mode over a range of times relevant to the experimental data. The steady-state flow equations and transient convection and diffusion equations were solved for using the UMFPACK direct solver with target residual of 10−12.
Acknowledgments
Funding for this work was provided by National Institutes of Health through the National Institute of Dental and Craniofacial Research (U01 DE15017 and U01 DE017793). The content is solely the responsibility of the authors and does not necessarily represent or reflect views of the NIH or the United States Government. Due to trademark concerns, this article was modified such that “programmable nano-bio-chip (PNBC)” was changed to “programmable bio-nano-chip (PBNC)” on March 7, 2011.
Contributor Information
Dr. Jesse V. Jokerst, Departments of Chemistry and Biochemistry, University of Texas at Austin, Austin, TX 78712, USA.
Jie Chou, Departments of Bioengineering and Chemistry, Rice University, 6500 Main Street, Houston, TX 77030, USA.
Dr. James P. Camp, Departments of Chemistry and Biochemistry, University of Texas at Austin, Austin, TX 78712, USA
Dr. Jorge Wong, Departments of Chemistry and Biochemistry, University of Texas at Austin, Austin, TX 78712, USA
Alexis Lennart, Departments of Chemistry and Biochemistry, University of Texas at Austin, Austin, TX 78712, USA.
Amanda A. Pollard, Departments of Chemistry and Biochemistry, University of Texas at Austin, Austin, TX 78712, USA
Dr. Pierre N. Floriano, Departments of Bioengineering and Chemistry, Rice University, 6500 Main Street, Houston, TX 77030, USA
Dr. Nicolaos Christodoulides, Departments of Bioengineering and Chemistry, Rice University, 6500 Main Street, Houston, TX 77030, USA
Glennon W. Simmons, Departments of Bioengineering and Chemistry, Rice University, 6500 Main Street, Houston, TX 77030, USA
Yanjie Zhou, Departments of Chemistry and Biochemistry, University of Texas at Austin, Austin, TX 78712, USA.
Dr. Mehnaaz F. Ali, Departments of Chemistry and Biochemistry, University of Texas at Austin, Austin, TX 78712, USA.
Prof. John T. McDevitt, Email: mcdevitt@rice.edu, Departments of Bioengineering and Chemistry, Rice University, 6500 Main Street, Houston, TX 77030, USA
References
- 1.Rosi NL, Mirkin CA. Chem Rev. 2005;105:1547–1562. doi: 10.1021/cr030067f. [DOI] [PubMed] [Google Scholar]
- 2.Walt DR. Science. 2005;308:217–219. doi: 10.1126/science.1108161. [DOI] [PubMed] [Google Scholar]
- 3.Fan ZH, Ricco AJ. BioMEMS and Biomed Nanotechnol. 2006;2:311–328. [Google Scholar]
- 4.Verpoorte E. Lab Chip. 2003;3:60N–68N. doi: 10.1039/b313217j. [DOI] [PubMed] [Google Scholar]
- 5.Whitesides GM. Nature. 2006;442:368–373. doi: 10.1038/nature05058. [DOI] [PubMed] [Google Scholar]
- 6.Borowsky JF, Giordano BC, Lu Q, Terray A, Collins GE. Anal Chem. 2008;80:8287–8292. doi: 10.1021/ac801497r. [DOI] [PubMed] [Google Scholar]
- 7.Fair RB. Microfluid Nanofluid. 2007;3:245–281. [Google Scholar]
- 8.McCarley RL, Vaidya B, Wei SY, Smith AF, Patel AB, Feng J, Murphy MC, Soper SA. J Am Chem Soc. 2005;127:842–843. doi: 10.1021/ja0454135. [DOI] [PubMed] [Google Scholar]
- 9.Kim JS, Anderson GP, Erickson JS, Golden JP, Nasir M, Ligler FS. Anal Chem. 2009;81:5426–5432. doi: 10.1021/ac9005827. [DOI] [PMC free article] [PubMed] [Google Scholar]
- 10.Waggoner PS, Craighead HG. Lab Chip. 2007;7:1238–1255. doi: 10.1039/b707401h. [DOI] [PubMed] [Google Scholar]
- 11.Riehemann K, Schneider SW, Luger TA, Godin B, Ferrari M, Fuchs H. Angew Chem Int Ed. 2009;48:872–897. doi: 10.1002/anie.200802585. [DOI] [PMC free article] [PubMed] [Google Scholar]
- 12.Sako Y, Yanagida T. Nat Rev Mol Cell Biol. 2003;4:SS1–SS5. [PubMed] [Google Scholar]
- 13.Gaster RS, Hall DA, Nielsen CH, Osterfeld SJ, Yu H, Mach KE, Wilson RJ, Murmann B, Liao JC, Gambhir SS, Wang SX. Nat Med. 2009;15:1327–1332. doi: 10.1038/nm.2032. [DOI] [PMC free article] [PubMed] [Google Scholar]
- 14.Schipper ML, Iyer G, Koh AL, Cheng Z, Ebenstein Y, Aharoni A, Keren S, Bentolila LA, Li J, Rao J, Chen X, Banin U, Wu AM, Sinclair R, Weiss S, Gambhir SS. Small. 2009;5:126–134. doi: 10.1002/smll.200800003. [DOI] [PMC free article] [PubMed] [Google Scholar]
- 15.Chang HC. AIChE Journal. 2007;53:2486–2492. [Google Scholar]
- 16.Gertsch JC, Noblitt SD, Cropek DM, Henry CS. Anal Chem. 82:3426–3249. doi: 10.1021/ac9029086. [DOI] [PubMed] [Google Scholar]
- 17.Sia SK, Kricka LJ. Lab Chip. 2008;8:1982–1983. doi: 10.1039/b817915h. [DOI] [PubMed] [Google Scholar]
- 18.Myers FB, Lee LP. Lab Chip. 2008;8:2015–2031. doi: 10.1039/b812343h. [DOI] [PubMed] [Google Scholar]
- 19.Yager P, Edwards T, Fu E, Helton K, Nelson K, Tam MR, Weigl BH. Nature. 2006;442:412–418. doi: 10.1038/nature05064. [DOI] [PubMed] [Google Scholar]
- 20.Vilkner T, Janasek D, Manz A. Anal Chem. 2004;76:3373–3385. doi: 10.1021/ac040063q. [DOI] [PubMed] [Google Scholar]
- 21.Mukhopadhyay R. Anal Chem. 2009;81:4169–4173. doi: 10.1021/ac900638w. [DOI] [PubMed] [Google Scholar]
- 22.Sanhai WR, Sakamoto JH, Canady R, Ferrari M. Nat Nano-technol. 2008;3:242–244. doi: 10.1038/nnano.2008.114. [DOI] [PubMed] [Google Scholar]
- 23.Janasek D, Franzke J, Manz A. Nature. 2006;442:374–380. doi: 10.1038/nature05059. [DOI] [PubMed] [Google Scholar]
- 24.Mukhopadhyay R. Anal Chem. 2005;77:429A–432A. [PubMed] [Google Scholar]
- 25.Lavigne JJ, Savoy S, Clevenger MB, Ritchie JE, McDoniel B, Yoo SJ, Anslyn EV, McDevitt JT, Shear JB, Neikirk D. J Am Chem Soc. 1998;120:6429–6430. [Google Scholar]
- 26.Goodey A, Lavigne JJ, Savoy SM, Rodriguez MD, Curey T, Tsao A, Simmons G, Wright J, Yoo SJ, Sohn Y, Anslyn EV, Shear JB, Neikirk DP, McDevitt JT. J Am Chem Soc. 2001;123:2559–2570. doi: 10.1021/ja003341l. [DOI] [PubMed] [Google Scholar]
- 27.Rodriguez WR, Christodoulides N, Floriano PN, Graham S, Mohanty S, Dixon M, Hsiang M, Peter T, Zavahir S, Thior I, Romanovicz D, Bernard B, Goodey AP, Walker BD, McDevitt JT. PLoS Med. 2005;2:e182. doi: 10.1371/journal.pmed.0020182. [DOI] [PMC free article] [PubMed] [Google Scholar]
- 28.Weigum SE, Floriano PN, Christodoulides N, McDevitt JT. Lab Chip. 2007;7:995–1003. doi: 10.1039/b703918b. [DOI] [PubMed] [Google Scholar]
- 29.Floriano P, Christodoulides N, Miller C, Ebersole J, Spertus J, Rose B, Kinane D, Novak M, Steinhubl S, Acosta S. Clin Chem. 2009;55:1530–1538. doi: 10.1373/clinchem.2008.117713. [DOI] [PMC free article] [PubMed] [Google Scholar]
- 30.Jokerst JV, Jacobson JW, Bhagwandin BD, Floriano PN, Christodoulides N, McDevitt JT. Anal Chem. 2010;82:1571–9. doi: 10.1021/ac901743u. [DOI] [PMC free article] [PubMed] [Google Scholar]
- 31.Goodey AP, McDevitt JT. J Am Chem Soc. 2003;125:2870–2871. doi: 10.1021/ja029696h. [DOI] [PubMed] [Google Scholar]
- 32.Jokerst JV, Raamanathan A, Christodoulides N, Floriano PN, Pollard AA, Simmons GW, Wong J, Gage C, Furmaga WB, Redding S, McDevitt JT. Biosens Bioelectron. 2009;24:3622–9. doi: 10.1016/j.bios.2009.05.026. [DOI] [PMC free article] [PubMed] [Google Scholar]
- 33.Ali MF, Kirby R, Goodey AP, Rodriguez MD, Ellington AD, Neikirk DP, McDevitt JT. Anal Chem. 2003;75:4732–4739. doi: 10.1021/ac034106z. [DOI] [PubMed] [Google Scholar]
- 34.Jokerst JV, McDevitt JT. Nanomedicine. 2010;5:143–155. doi: 10.2217/nnm.09.94. [DOI] [PMC free article] [PubMed] [Google Scholar]
- 35.Thompson JA, Bau HH. J Chrom B. 2010;878:228–236. doi: 10.1016/j.jchromb.2009.08.050. [DOI] [PMC free article] [PubMed] [Google Scholar]
- 36.Crowther JR. ELISA: Theory and Practice. Humana Press; Totowa, NJ, USA: 1995. [DOI] [PubMed] [Google Scholar]
- 37.Crowther JR. The ELISA Guidebook. Humana Press; New York: 2001. [Google Scholar]
- 38.Engvall E, Perlmann P. Immunochemistry. 1971;8:871–874. doi: 10.1016/0019-2791(71)90454-x. [DOI] [PubMed] [Google Scholar]
- 39.Bonanno LM, DeLouise LA. Langmuir. 2007;23:5817–5823. doi: 10.1021/la063659c. [DOI] [PMC free article] [PubMed] [Google Scholar]
- 40.Butler JE, Ni L, Nessler R, Joshi KS, Suter M, Rosenberg B, Chang J, Brown WR, Cantarero LA. J Immunol Meth. 1992;150:77–90. doi: 10.1016/0022-1759(92)90066-3. [DOI] [PubMed] [Google Scholar]
- 41.Liew M, Groll MC, Thompson JE, Call SL, Moser JE, Hoopes JD, Voelkerding K, Wittwer C, Spendlove RS. Biotechniques. 2007;42:327–333. doi: 10.2144/000112332. [DOI] [PubMed] [Google Scholar]
- 42.Christodoulides N, Mohanty S, Miller CS, Langub MC, Floriano PN, Dharshan P, Ali MF, Bernard B, Romanovicz D, Anslyn E, Fox PC, McDevitt JT. Lab Chip. 2005;5:261–269. doi: 10.1039/b414194f. [DOI] [PubMed] [Google Scholar]
- 43.Iannone MA, Consler TG. Cytometry A. 2006;69:374–383. doi: 10.1002/cyto.a.20270. [DOI] [PubMed] [Google Scholar]
- 44.Muller KM, Arndt KM, Pluckthun A. Anal Biochem. 1998;261:149–158. doi: 10.1006/abio.1998.2725. [DOI] [PubMed] [Google Scholar]
- 45.Gustavsson PE, Mosbach K, Nilsson K, Larsson PO. J Chrom A. 1997;776:197–203. [Google Scholar]
- 46.Grate JW, Warner MG, Ozanich RM, Jr, Miller KD, Colburn HA, Dockendorff B, Antolick KC, Anheier NC, Jr, Lind MA, Lou J, Marks JD, Bruckner-Lea CJ. Analyst. 2009;134:987–996. doi: 10.1039/b900794f. [DOI] [PubMed] [Google Scholar]
- 47.Mattern KJ, Nakornchai C, Deen WM. Biophysical J. 2008;95:648–656. doi: 10.1529/biophysj.107.127316. [DOI] [PMC free article] [PubMed] [Google Scholar]
- 48.Labille J, Fatin-Rouge N, Buffle J. Langmuir. 2007;23:2083–2090. doi: 10.1021/la0611155. [DOI] [PubMed] [Google Scholar]
- 49.Fatin-Rouge N, Starchev K, Buffle J. Biophysical J. 2004;86:2710–2719. doi: 10.1016/S0006-3495(04)74325-8. [DOI] [PMC free article] [PubMed] [Google Scholar]
- 50.Pernodet N, Maaloum M, Tinland B. Electrophoresis. 1997;18:55–58. doi: 10.1002/elps.1150180111. [DOI] [PubMed] [Google Scholar]
- 51.Gutenwik J, Nilsson B, Axelsson A. J Chrom A. 2004;1048:161–172. [PubMed] [Google Scholar]
- 52.Liu C, Schrlau MG, Bau HH. Biosens Bioelectron. 2009;25:809–814. doi: 10.1016/j.bios.2009.08.033. [DOI] [PMC free article] [PubMed] [Google Scholar]
- 53.Zhang X, Wang S, Hu M, Xiao Y. Biosens Bioelectron. 2006;21:2180–2183. doi: 10.1016/j.bios.2005.10.018. [DOI] [PubMed] [Google Scholar]
- 54.Rodriguez MD. PhD Thesis. The University of Texas; Austin, TX: 2003. [Google Scholar]
- 55.Kenanova V, Wu AM. Expert Opin Drug Deliv. 2006;3:53–70. doi: 10.1517/17425247.3.1.53. [DOI] [PubMed] [Google Scholar]
- 56.Mitchell KF. Cancer Immunol Immuno. 1980;10:1–5. [Google Scholar]
- 57.Bolte S, Cordelieres FP. J Microscopy. 2006;224:213–232. doi: 10.1111/j.1365-2818.2006.01706.x. [DOI] [PubMed] [Google Scholar]
- 58.Johnson EM, Berk DA, Jain RK, Deen WM. Biophysical J. 1996;70:1017–1026. doi: 10.1016/S0006-3495(96)79645-5. [DOI] [PMC free article] [PubMed] [Google Scholar]
- 59.Narayanan J, Xiong JY, Liu XY. J Physics: Conference Series. 2006;28:83–86. [Google Scholar]
- 60.Boehm MK, Perkins SJ. FEBS Lett. 2000;475:11–16. doi: 10.1016/s0014-5793(00)01612-4. [DOI] [PubMed] [Google Scholar]
- 61.Harris LJ, Skaletsky E, McPherson A. J Mol Biol. 1998;275:861–872. doi: 10.1006/jmbi.1997.1508. [DOI] [PubMed] [Google Scholar]
- 62.Borch RF, Bernstein MD, Durst HD. J Am Chem Soc. 1971;93:2897–2904. [Google Scholar]
- 63.Chang HC, Yeo L. Electrokinetically Driven Microfluidics & Nanofluidics. Cambridge University Press; Cambridge, UK: 2010. [Google Scholar]
- 64.Adamek DH, Guerrero L, Blaber M, Caspar DLD. J Mol Biol. 2005;346:307–318. doi: 10.1016/j.jmb.2004.11.046. [DOI] [PubMed] [Google Scholar]


