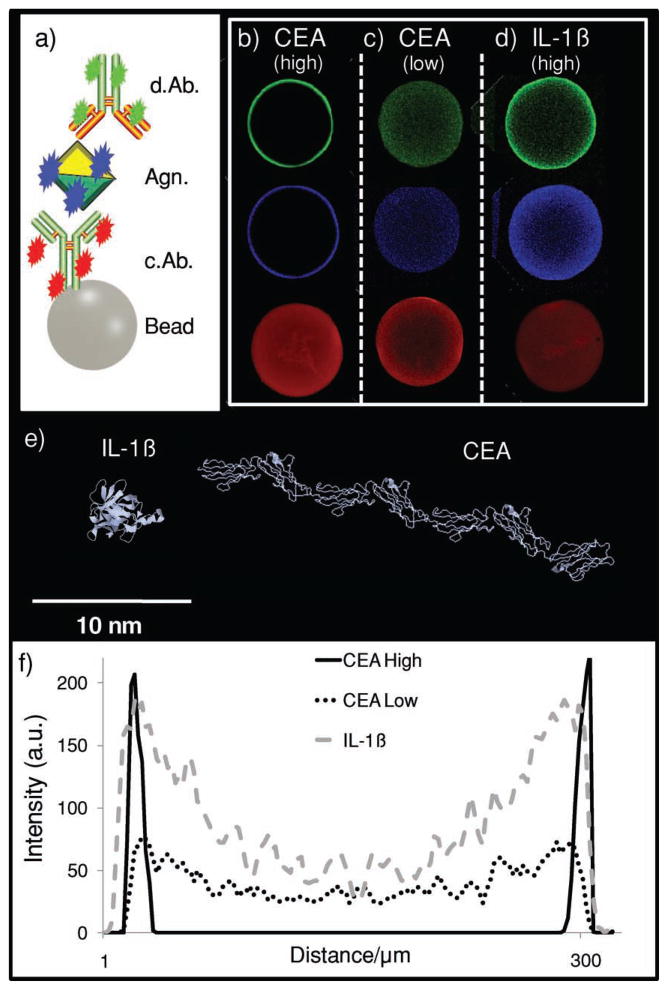
Figure 4.
Immunocomplex location. a) A three-color identification approach is used for different assay systems. b–d) The distribution of medial-slice signal for capture antibody (red), analyte (antigen, blue), and detecting antibody (green) is seen. The CEA assay system in (b) contains 0.26 mg mL−1 capture antibody, a value that is high relative to the 9.6 μg mL−1 in (c). While both the high and low values show complete penetration of capture antibody into the bead core, only the lower system allows analyte and detecting antibody to penetrate past the bead periphery. In the assay system in (d), again, a high amount of capture antibody is used. However, this antibody is specific to the interleukin-1β (IL-1β) protein. e) IL-1β is much smaller than CEA. Because of this, the smaller, globular IL-1β protein (5 nm) allows for deeper penetration of immunoassay components even at high concentration of capture antibody.[64] f) Line profiles indicate antigen-penetration patterns for the three different assay systems with differences in intensity and distribution.

