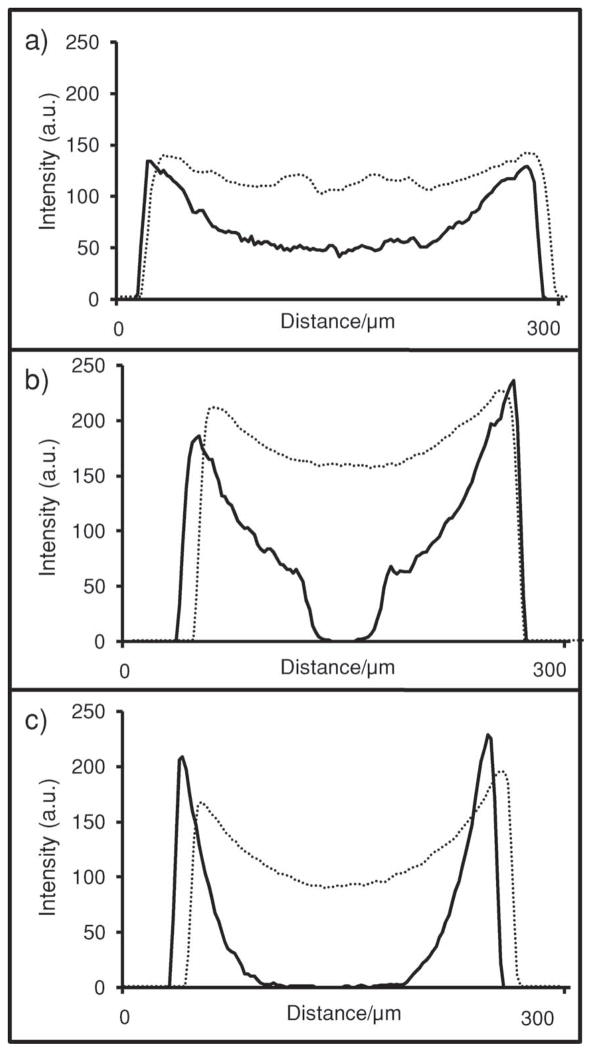
Figure 5.
Capture-antibody behavior changes with bead type and concentration. Low concentration (9.6 μg mL−1; solid) and high concentration (0.25 mg mL−1; dashed) of capture antibody as shown by line profiles. The 0.25 mg mL−1 is an excess and allows complete penetration into the center for all bead types. At low concentrations, the 1 wt% agarose beads (a) have an excess of capture reagent, allowing this signal to penetrate all the way to center. In contrast, the 2% (b) and 4% (c) beads have more active sites, effectively depleting the reagent before penetration to center is possible.

