

Abstract
Intracellular recordings were made from nerve fibers in the posterior ampullary nerve near the neuroepithelium. Calyx-bearing afferents were identified by their distinctive efferent-mediated responses. Such fibers receive inputs from both type I and type II hair cells. Type II inputs are made by synapses on the outer face of the calyx ending and on the boutons of dimorphic fibers. Quantal activity, consisting of brief mEPSPs, is reduced by lowering the external concentration of Ca2+ and blocked by the AMPA-receptor antagonist CNQX. Poisson statistics govern the timing of mEPSPs, which occur at high rates (250–2,500/s) in the absence of mechanical stimulation. Excitation produced by canal-duct indentation can increase mEPSP rates to nearly 5,000/s. As the rate increases, mEPSPs can change from a monophasic depolarization to a biphasic depolarizing– hyperpolarizing sequence, both of whose components are blocked by CNQX. Blockers of voltage-gated currents affect mEPSP size, which is decreased by TTX and is increased by linopirdine. mEPSP size decreases several fold after impalement. The size decrease, although it may be triggered by the depolarization occurring during impalement, persists even at hyperpolarized membrane potentials. Nonquantal transmission is indicated by shot-noise calculations and by the presence of voltage modulations after quantal activity is abolished pharmacologically. An ultrastructural study shows that inner-face inputs from type I hair cells outnumber outer-face inputs from type II hair cells by an almost 6:1 ratio.
INTRODUCTION
Throughout vertebrate history, the vestibular labyrinth has been relatively conservative with similar structural features being found in species ranging from fish to mammals (Baird 1974; Lewis et al. 1985). One evolutionary novelty is the type I hair cell and its associated calyx ending, which are found only in reptiles, birds, and mammals (Lysakowski 1996; Lysakowski and Goldberg 2004; Wersäll and Bagger-Sjöbäck 1974). Although these structures are restricted in reptiles and birds to central/striolar zones, their increasing importance in mammals is suggested by their distribution throughout the neuroepithelium of both the cristae and maculae. In addition, whereas type I and type II hair cells occur in approximately equal numbers in rodent cristae (Desai et al. 2005; Fernández et al. 1988; Lindeman 1969), type I hair cells predominate in the cristae of both New World (Fernández et al. 1995; Lysakowski and Goldberg 2007) and Old World monkeys (Lysakowski 1996) and possibly of humans (Merchant et al. 2000; but see Lopez et al. 2005).
The entire afferent innervation of a type I hair cell comes from a single fiber whose calyx ending surrounds much of the basolateral surface of the hair cell. Several ribbon synapses are made between the two structures. The presence of a large contact area and several synapses might suggest the occurrence of powerful synaptic transmission. A comparison of gains, the ratio of responses to stimulus amplitudes, in spike recordings from mammals suggests otherwise. In particular, calyx fibers, which only have calyx endings, have distinctly lower mid frequency (0.5–2 Hz) sinusoidal gains, than do dimorphic fibers, which provide a mixed calyx and bouton innervation of type I and type II hair cells (Baird et al. 1988; Hullar et al. 2005; Lysakowski et al. 1995). Similarly, calyx-bearing fibers in the turtle posterior crista have smaller gains than do bouton fibers of similar discharge regularity (Brichta and Goldberg 2000a). As shown previously (Goldberg 2000; Goldberg et al. 1984; Smith and Goldberg 1986), the matching of discharge regularity is needed to ensure that postsynaptic spike encoders have comparable sensitivities. When spike encoders are matched in sensitivity, synaptic transmission, defined as the input to the encoder (Goldberg 2000), should be proportional to the spike response.
Recently, quantal transmission has been demonstrated with the recording of miniature excitatory postsynaptic currents (mEPSCs) from solitary calyx endings in contact with hair cells (Rennie and Streeter 2006). This is not surprising because ribbon synapses, which are present in type I hair cells (Lysakowski and Goldberg 1997; Wersäll and Bagger-Sjöbäck 1974), are sites of quantal transmission (Glowatzki and Fuchs 2002; Keen and Hudspeth 2006; Rossi et al. 1989, 1994). Nevertheless, studies of such transmission in type I hair cells have proved difficult in more intact preparations. Miniature excitatory postsynaptic potentials (mEPSPs) were recorded from presumed calyx fibers in a lizard crista (Schessel et al. 1991). Unfortunately, the identification of these fibers was based on a physiological criterion that cannot distinguish between calyx and bouton afferents in turtles and possibly other reptiles (Brichta and Goldberg 2000a). In the chick, synaptic activity was compared in calyx and bouton afferents identified by intraaxonal labeling (Yamashita and Ohmori 1990). Although mEPSPs indicative of quantal transmission were observed in bouton fibers, such potentials were not seen in calyx fibers. Rather, nonquantal potentials similar in some respects to hair-cell receptor potentials were observed. Gap junctions between the hair cell and its ending, which could provide a basis for nonquantal transmission, are lacking (Gulley and Bagger-Sjöbäck 1979; Yamashita and Ohmori 1991). Other mechanisms that could give rise to nonquantal transmission include ephaptic transmission (Goldberg 1996; Jefferys 1995) and the accumulation of K+ ions or glutamate in the intercellular space between the hair cell and the ending (Goldberg 1996).
There are several difficulties in envisioning how conventional quantal transmission from type I hair cells could work. Three issues can be mentioned. 1) Type I hair cells have a distinctive outwardly rectifying, basolateral K+ current (IK,I or IK,L) (Brichta et al. 2002; Correia and Lang 1990; Rennie and Correia 1994; Rüsch and Eatock 1996). The current is active even in the absence of transduction currents and lowers the resting potential and input impedance (Eatock and Lysakowski 2006; Goldberg and Brichta 2002), so much so that transduction currents might not depolarize the hair cell to a point where L-type Ca2+ channels are activated and neurotransmitter release would occur (Bao et al. 2003; Dou et al. 2004). 2) Because of their large size, calyx endings may have low impedances that would attenuate synaptic voltages. The high density of K+ channels in the ending (Hurley et al. 2006; Kharkovets et al. 2000; Lysakowski and Price 2003) should exacerbate the problem. 3) Both K+ ions and glutamate could accumulate in the synaptic cleft (Goldberg 1996). In the case of bouton synapses on type II hair cells, supporting cells function to clear these substances from the neuroepithelium (Ottersen et al. 1998). The presence of calyx endings precludes supporting cells from acting in the same way in type I hair cells.
In the present study, we describe quantal and nonquantal transmission in calyx-bearing (CD) afferents in the turtle posterior crista, including calyx (C) and dimorphic (D) fibers. Results are compared with bouton (B) afferents considered previously (Holt et al. 2006b). Both forms of transmission exist in B and CD afferents, but in the latter, quantal transmission is relatively ineffective because of the small size and brevity of individual mEPSPs. At the same time, quantal rates in CD fibers are relatively high. Evidence is presented that the small quantal size of CD fibers is partially the consequence of intracellular impalement, but cannot be explained merely as a result of membrane depolarization or a decrease in postsynaptic impedance. We then show that blockers of ionic conductances affect quantal size. Finally, an ultrastructural study evaluates the relative numbers of ribbon synapses impinging on the inner and outer faces of calyx endings. Of the two kinds of contacts, inner-face synapses are so much more numerous that they are likely to provide the major input to the calyx ending.
METHODS
Tissue preparation
Red-eared turtles (Trachemys scripta elegans, 100–300 g, 7–14 cm carapace length) of either sex were decapitated and the head was split parasagitally. Most of the skull and brain on the left side were retained. The specimen was placed in an oxygenated control solution (see Solutions). Experiments were conducted at room temperature (21–23°C). All procedures were approved by the Institutional Animal Care and Use Committee (IACUC) of the University of Chicago.
Surgical methods were similar to those described previously (Holt et al. 2006b). To record from the posterior ampullary nerve, it was exposed and superfused with the oxygenated control solution from a gravity-fed, multibarrel pipette capable of delivering solutions at 3– 4 μl/s from any one of four 10-ml reservoirs. Connective tissue covering the nerve was removed with a fine tungsten hook. Electrical stimulation of efferent fibers was used to classify afferents (Holt et al. 2006a). To accomplish this, the cross-bridge, a nerve bundle interconnecting the anterior and posterior vestibular nerves and containing all efferent fibers destined for the posterior crista (Fayyazuddin et al. 1991), was exposed in the roof of the mouth.
Recording and stimulating procedures
Glass microelectrodes filled with 3 M KCl were connected to a negative-capacitance preamplifier (Biomedical Engineering, Thorn-wood, NY). Impedances were 40 – 80 MΩ. Recordings were made from the posterior ampullary nerve as it bifurcates to innervate the two hemicristae. The recording site is about 250 μm from the neuroepithelium, a distance estimated to be 0.4 of a length constant from the basal lamina, where the myelination of the fiber starts. Solutions of the cable equation indicate that the attenuation produced by the myelinated fiber is about 10% (Supplementary Material #1).
A mechanical indenter, whose motion was controlled by a voltage applied to a trilaminate piezoelectric plate (Model Pl-140.10, Polytec PI, Auburn, MA), was used to stimulate the posterior semicircular canal duct (Holt et al. 2006b). Displacement was measured by an in-line linear variable differential transformer (LVDT, Model DC-750-050, Macrosensors, Pennsauken, NJ). The tip of the indenter, a fire-polished glass tube (0.1–0.2-mm2 contact area), was advanced through a hole made in the temporal bone to contact the membranous canal duct, after which the indenter was slowly advanced to prevent loss of contact during controlled indenter withdrawal. Maximum displacements were ±125 μm. Outward deflections were excitatory.
Efferent stimulating electrodes, silver wires (AG10T, Medwire, Mt. Vernon, NY) insulated except for their 0.5-mm chlorided tips, were placed on the cross-bridge and on nearby bone. Constant-current pulses, 100 μs in duration, were delivered from a stimulus isolator (Model A360, World Precision Instruments, Sarasota, FL) to the two electrodes. The cross-bridge electrode was the cathode.
On-line computer control
Custom Spike2 scripts run on a Pentium IV computer with a Micro1401 interface (Cambridge Electronic Design, Cambridge, UK) managed the experiments. The microelectrode signal was low-pass filtered at 1 kHz (four-pole Bessel filter, Wavetek model 432, San Diego, CA) and sampled at 7–10 kHz by a 12-bit A/D converter. A similar A/D converter sampled the indenter LVDT monitor. Indenter displacement was controlled by the output of a 12-bit D/A converter passed through a three-digit attenuator. A digital-output port determined the timing of efferent electrical shocks.
Solutions
The control solution contained (in mM) 105 NaCl, 4 KCl, 0.8 MgCl2, 2 CaCl2, 25 NaHCO3, 2 Na-pyruvate, 10 glucose; pH = 7.2–7.3 after bubbling with 95% O2-5% CO2. A low-calcium solution was prepared by reducing Ca2+ in the normal control solution from 2 to 0.1 mM, elevating Mg2+ from 0.8 to 5 mM, and adding 5 mM EGTA. These modifications reduced free Ca2+ to low nanomolar concentrations as calculated by the Webmaxc Standard Program (http://www.stanford.edu/~cpatton/webmaxcS, Stanford University, Palo Alto, CA) while keeping divalent charge screening approximately constant (Hille 2001). It was previously shown that an EGTA solution buffered to our normal Ca2+ and Mg2+ concentrations did not affect synaptic activity (Holt et al. 2006b).
All chemicals and drugs were obtained from Sigma–Aldrich (St. Louis, MO) except 6-cyano-7-nitroquinoxaline-2,3-dione (CNQX), D-2-amino-5-phosphonovalerate (AP-5), linopirdine, and XE-991 (all from Tocris Cookson, Ellisville, MO) and E-4031 (Alomone Labs, Jerusalem, Israel). Unless otherwise stated, drugs were prepared in the control solution.
Physiological testing
Both extracellular and intracellular recordings were made from afferent nerve fibers. In either case, we first studied the response to electrical stimulation of efferent fibers. Trains of 20 shocks, spaced 5 ms apart, were delivered to the cross-bridge. Shock amplitude was adjusted to result in a clear response in the absence of antidromic activation. After efferent testing, we collected a 5-s sample of background activity followed by the response to 6–12 cycles of 0.3-Hz sinusoidal indentation of the canal duct.
In many cases, spikes disappeared within a few minutes of impalement, which allowed us to study synaptic activity in isolation. When spikes had to be eliminated, they were blocked by adding tetrodotoxin (TTX, 200 –500 nM) to the control solution or by including the charged local anesthetic QX-314 (40 mM) in the micropipette solution. To reduce hair cell neurotransmitter release, the control solution was replaced with the low-Ca2+ solution. To identify the glutamate receptors involved, the α-amino-3-hydroxy-5-methyl-4-isoxazolepropionic acid (AMPA)–receptor blocker CNQX (50 μM) and the N-methyl-D-aspartate (NMDA) antagonist AP-5 (100 –200 μM) were used separately or in combination. Potassium channels blockers included linopirdine or XE-991 (both 100 –200 μM) and E-4031 (10 –20 μM).
Quantal analysis
Off-line analysis was done with custom programs written in IGOR Pro (version 5.00; WaveMetrics, Lake Oswego, OR). Samples of resting activity were treated as single blocks. For stimulated activity at 0.3 Hz, individual sine-wave cycles were divided into 24 bins (0.139 s wide) and statistics were calculated for each bin. When the properties of the unit were relatively constant over a trial, statistics from corresponding bins in successive sine-wave cycles were averaged. This was done to eliminate the effects of variations in qshape and qrate during excitation and inhibition (see, for example, Fig. 7). To characterize changes in quantal activity, such as occurred during the application of pharmacological agents, the averaging across cycles was eliminated. Rather, data for individual excitatory half-cycles were fit sinusoidally (see Fig. 9 for example).
FIG. 7.

Quantal parameters, including mEPSP duration, size, and rate vary during sinusoidal mechanical stimulation of CD units. Sinusoidal indenter cycles were divided into 24 segments of 15° width. Data from corresponding segments in the middle 10 of 12 cycles were averaged. Points for an individual unit (●) are fit by sine waves (solid lines). Also included are sine-wave fits based on the entire sample of 16 CD units (dashed lines). A: from spectral analyses, mEPSP shapes deduced for each segment were integrated to provide estimates of quantal duration. B: Eq. 5 was used to deduce quantal size. C: Eq. 6 provided quantal-rate estimates; only the excitatory half-cycles were fit. Arrows indicate peak excitatory indentation at 270°.
FIG. 9.

Nonquantal response persists even as quantal transmission is blocked pharmacologically. A: unfiltered voltage (Mean, top trace) and the high-pass variance (Variance, bottom trace) are plotted during the response to 6 cycles of a 0.3-Hz sinusoidal indentation (one-sided amplitude, 46 μm). Mean, variance, and skew (the latter not shown) were calculated from consecutive samples of 0.139-s duration (1/24th of a 0.3-Hz sine-wave period) throughout the record. CNQX + AP-5 were introduced before the trial. There is a much larger reduction in the variance modulation than in the mean modulation. B: sinusoidal fits were obtained for each excitatory half-cycle in this and the subsequent trial. Peak excitatory skew is plotted against the peak excitatory variance cycle by cycle for the 12 cycles. Points are fit by a power law with an exponent near 1.5, consistent with a variation in quantal size (qsize). C: cycle-by-cycle excitatory voltage modulation is plotted for the same 12 points as in B vs. the square root of the peak variance, the latter a measure of qsize. A linear fit indicates that much of the total modulation is still present when qsize is extrapolated to zero.
QUANTAL SHAPE
Shapes of individual mEPSPs were characterized by spectral methods that rely on the random (Poisson) timing and superimposability of individual events. Power spectra were estimated by taking the sum of the squares of the real and imaginary parts of fast Fourier transforms (FFTs) from samples of resting activity and of indenter responses. Individual power spectra were calculated from data segments lasting 0.139 s (1/24th of a 0.3-Hz sine-wave cycle). The power spectra were averaged from consecutive samples of resting activity and from corresponding segments in consecutive cycles of indenter responses. A control spectrum, calculated from the segment when quantal activity was minimized by inhibitory indentations, was subtracted from signal spectra. After cosine tapering and logarithmic transformation, the resulting difference spectrum was fit by one of two formulas. In a previous paper, we used the logarithmic counterpart of
| (1) |
where f is the frequency, G(0) is the DC power, and α is a rate constant. For reasons cited in Holt et al. 2006b, the exponent was set to k = 2. A nonlinear regression was used to estimate α. The signal and control components of the difference spectra, even when they were well separated at low frequencies, converged at high frequencies. For this reason, fits were confined to the bandwidth, 0–500 Hz. We considered difference spectra only when the cumulative power of the signal spectrum in this bandwidth exceeded that of the control spectrum by a 2:1 ratio.
Equation 1 with k = 2 is the power spectrum corresponding to the alpha function
| (2) |
In some cases, the power spectra showed a discrepancy from Eq. 1. In particular, there could be a midfrequency (10- to 100-Hz) enhancement that corresponded to a time function consisting of depolarization followed by a hyperpolarization. The discrepancy was reasonably well fit by multiplying Eq. 1 by
| (1a) |
which is the power spectrum of a lead-lag network with rate constants β and δ. We used the modified transfer function, G(f) × P(f), for entirely empirical reasons, i.e., because many experimental spectra could be well fit by it, but not by Eq. 1. Convolving Eq. 2 with the corresponding lead-lag operator gives as a time function
| (2a) |
which leads to an mEPSP with a depolarization followed by a hyperpolarization when β < δ (see Fig. 6 for example).
FIG. 6.

Some CD units show a midfrequency enhancement in their resting power spectrum and a biphasic, depolarizing– hyperpolarizing mEPSP. A: resting power spectrum (○) of a CD unit has a peak near 70 Hz and a power ratio between 70 and 7 Hz of 6.2. Equation 1 (Alpha) gives a poor fit, whereas a better fit is obtained on multiplying Eqs. 1 and 1a (Lead-lag). B: 3 time curves: the deconvolution mEPSP, the spectral mEPSPs based on the alpha, and lead-lag fits in A. Horizontal lines indicate the 95% confidence interval about zero.
Quantal shape (qshape), determined by spectral methods, was checked by deconvolution. Individual quanta were automatically identified by Wiener filtering (Press et al. 1992) and their waveforms averaged. The method was useful not only in specifying quantal shape, but also in describing the timing of individual quanta. Calculational details are presented elsewhere (Holt et al. 2006b).
QUANTAL RATE AND SIZE
We used shot-noise theory to characterize these parameters (Holt et al. 2006b; Neher and Sakaba 2003). The key assumptions of the theory are that the shapes of individual quantal events are stereotyped and their timing is governed by Poisson statistics. Event size can vary. According to Rice (1944), the mean (λ1), variance (λ2), and the third central moment or skew (λ3) are related to the rate (qrate, ξ), size (qsize, h), and qshape [ f(t)], t ≥ 0) of individual quanta by
| (3) |
where the angle brackets indicate expected values. Here and elsewhere, superscripts are exponents, whereas subscripts are indices. I1, I2, and I3 are integrals of the form
| (4) |
and f(t) is normalized to a peak value of unity. I1 was used as a measure of quantal duration (qdur).
The theory was applied by calculating each relevant statistic over all points of any particular sample. Means (λ1) were evaluated from the original records, whereas variances (λ2) and skews (λ3) were usually calculated after the records had been digitally high-pass filtered (single-pole, corner frequency of 1,000 rad/s). When Eq. 3 was used on filtered data, f(t) in Eq. 4 was normalized before filtering. Note that h enters into Eq. 3 as 〈hn〉. In manipulating the equations algebraically, it is convenient to use 〈h〉n, rather than 〈hn〉. This can be accomplished by evaluating the constants, Dn 〈hn〉/〈h〉n, n = 1–3, which can be done by expanding the expected value of (h − 〈h〉)n and setting it equal to the nth central moment of h (Supplementary Material #2). qsize was evaluated from
| (5) |
which led to
| (6) |
as an estimate of qrate. The constants D2 and D3 depend on the distribution of h and on its coefficient of variation (CV). Based on previous work (Holt et al. 2006b), we assumed a gamma distribution with a CV = 0.4, for which D2 = 1.16 and D3 = 1.53. Incorporating D2 and D3 into Eqs. 5 and 6 multiplied 〈h〉 by 0.76 and ξ by 1.50.
To determine whether variations in the unfiltered mean voltage could be explained by quantal activity, we compared the actual or total variation (T) with the product
| (7) |
the predicted quantal depolarization (Q) from shot-noise theory. Deviations from predictions were taken as evidence for nonquantal transmission (NQ), i.e., NQ = T − Q.
In calculating the variance (λ2) due to quantal activity, residual variance, which includes both instrumental and channel noise, was subtracted from the experimentally measured variance. Of the various sources of variance, only quantal activity has a nonzero skew. Residual variance was therefore identified in each record as the variance at zero skew (see Holt et al. 2006b; Neher and Sakaba 2003). To estimate the residual variance, the skew–variance relation was obtained from high-pass records during sinusoidal indenter stimulation. Because of the possibility of nonlinearities, we only used points in the relation that approached zero skew, in particular the point of minimal variance and three points to either side of it. A linear regression of the seven points was extrapolated to zero skew.
To investigate whether a change in quantal activity could be attributed to a variation in qrate or qsize, we plotted the relation between λ3 and λ2. Manipulating Eqs. 5 and 6 shows that a qrate variation leads to a linear relation
| (8) |
whereas a qsize variation, other parameters remaining the same, gives a nonlinear relation
| (9) |
i.e., λ3 is proportional to . The equations provide fair tests because D2 and D3 are constants and the variations in the integral ratios (I3/I2 and ) are very much smaller than those of λ2 and λ3.
Simulations
To check the adequacy of spectral and shot-noise procedures, we did a series of Monte Carlo simulations in which the timing of quantal events was assumed to obey Poisson statistics, whereas qsize was taken from a gamma distribution with CV = 0.4 (see Holt et al. 2006b for details). The events, represented by impulses with amplitudes proportional to qsize, were convolved with mEPSPs, f(t) = αt · exp(− αt), α = 1,000/s, normalized to unity amplitude. Two noise records were obtained by determining their amplitude in each bin from a Gaussian random-noise generator and then convolving each record with a function devised to match empirical spectra. Both noise records were normalized to a variance (σ2 = 0.0025 μV2), typical of our empirical data. One noise record was added to the quantal record and the second one was used as the control record. qshape and qdur were deduced by spectral methods and qrate, qsize, and quantal depolarization (Q in Eq. 7) were obtained from a shot-noise analysis. Each simulation was 1.39 s in duration, similar to the length of the experimental records analyzed herein (1/24th of a 0.3-Hz sinusoid × 10 cycles). To evaluate the variability of estimates, 10 simulations were run for each set of parameters.
A concern motivating the simulations was the small size of the mEPSPs recorded in CD units, which were typically 0.1– 0.2 mV and could be even smaller. In addition, qrates could exceed 5,000/s. Results are summarized in Fig. 1. In the first series (Fig. 1, A–D), qrate was fixed at 500/s and qsize varied between 0.05 and 0.4 mV. Estimates were reasonably accurate except for the lowest two values of qsize, where there were large spreads particularly in qdur (Fig. 1A) and qrate (Fig. 1C). Even so, the mean values for even the smallest qsize differed by <25% from expected values. To avoid large spreads, we calculated a signal-to-noise (S/N) ratio by taking the integrated power spectra ≤ 500 Hz separately for the quantal and noise records. Both the simulated and experimental data suggested that we consider only data where the S/N ratio was >2.0. In the context of the simulated data, this occurred at a qsize of 0.10 mV.
FIG. 1.

Spectral and shot-noise calculations provide accurate estimates of quantal parameters over most of the parameter space. Simulations of quantal records, each 1.39 s long; 10 simulations were run for each set of parameters (●). Input parameters (abscissa; mean values, —) and output parameters (ordinate; mean values, ○). A–D: estimates of quantal duration (qdur), size (qsize), rate (qrate), and depolarization for 4 different values of mean qsize (0.05, 0.1, 0.2, and 0.4 mV). Other parameters: qdur = 2.71 ms, qrate = 500/s. qsizes were selected from a gamma distribution with a coefficient of variation (CV) = 0.4. E–H: estimates of the same quantal parameters for qrates of 200, 500, 1,000, 2,000, 4,000, and 8,000/s. In F, medians (✶) are also shown. Mean qsize = 0.2 mV. Other parameters as in A–D.
In the second simulation series, we held qsize at 0.2 mV and varied qrate from 200 to 8,000/s (Fig. 1, E–H). Estimates of qsize and qrate are expected to become unreliable as qrate increases and as the voltage approaches a Gaussian distribution (Fesce 1990; Rice 1944). The simulations showed that the variability, particularly in qrate estimates, became large (CV >1) at 8,000/s (Fig. 1G). In addition, the distribution of the estimates at 8,000/s was positively skewed so that the sample mean overestimated the input qrate and provided a less accurate estimate than the median (13,200 vs. 7,320). For this reason, we used medians and interquartile ranges to characterize central tendencies of qrates in populations.
Shot-noise theory assumes a constancy of qshape. Systematic variations in qshape with indenter excitation are taken care of by dividing each indenter cycle into 24 bins. Variations in individual bins were evaluated in a simulation that combined two mEPSPs. Both were alpha functions, but they differed twofold in qdur, similar to the variations seen in mEPSPs selected by deconvolution (see Fig. 5). Long simulations (100 s) were run to reduce statistical variability. Shot-noise estimates of qrate and qsize were accurate to within 2.3% in qsize and 1.7% in qrate.
FIG. 5.

Quantal shape can be estimated by spectral and deconvolution methods. Data are from a CD unit. A: power spectrum of resting activity (○) is fit by Eq. 1 with a rate constant α = 920/s (—), and an exponent fixed at k = 2. B: deconvolution identified individual mEPSPs, of which every fourth example is shown (thin lines), as well as the average mEPSP based on 245 individual examples (black line). C: power spectrum in A was used to calculate a spectral mEPSP from Eq. 2 (- - - -), which is similar to the average deconvolution mEPSP (—), also seen in B. The two mEPSPs were normalized to peaks of unity.
Electron microscopy
Turtles were decapitated, skulls bisected, and both temporal bones fixed by an intralabyrinthine perfusion with a trialdehyde fixative (Lysakowski and Goldberg 1997) dissolved in a turtle Ringer solution. Temporal bones were postfixed in the same trialdehyde fixative until dissection. Posterior cristae were dissected individually, dehydrated in a graded series of ethanols, and embedded in Araldite (Fluka, Ronkonkoma, NY). Ultrathin sections were cut on a diamond knife (Delaware Diamond Knives, Wilmington, DE), collected on formvarcoated single-slot grids, and stained with uranyl acetate and lead citrate (Lysakowski and Goldberg 1997).
Two posterior cristae, each taken from a different animal, were cut longitudinally through the entire length of the crista. In each specimen, 31 serial sections were examined. Herein we consider only the central zone, the one region in each hemicrista to contain type I hair cells (Brichta and Goldberg 2000a; Brichta and Peterson 1994). Dissector counts of hair cells were obtained by counting all hair-cell nuclei present in the first (reference), but not in the last (lookup) section (Gundersen 1986; Lysakowski and Goldberg 1997). By reversing the reference and lookup sections, a second, statistically independent count was obtained. The two counts were averaged separately for type I and type II hair cells. In a similar way, dissector counts of synapses were obtained by counting all synaptic bodies in six sections from each series. Separate counts were made of synapses in each of the two kinds of hair cells. Type I synapses contact the inner faces of calyx endings, whereas type II synapses can be distinguished into those contacting afferent boutons or the outer faces of calyx endings. Note that the effective number of sections in a dissector is one less than the total number of sections. To estimate the number of synapses per hair cell, the hair-cell counts for 30 sections were multiplied by a proportion (5/30) to scale them down to the five-section synaptic counts.
Statistical procedures
Unless otherwise stated, values are expressed as means ± SE. Unpaired t-tests, corrected when necessary for unequal variances, were used to determine whether means differed from zero or other null values and also to compare values from different populations. Drug effects were evaluated by paired t-tests. Nonlinear regressions were calculated in IGOR Pro with a Levenberg–Marquardt algorithm.
RESULTS
Responses to efferent stimulation were used to distinguish calyx-bearing (CD) from bouton (B) afferents. As described in previous studies (Brichta and Goldberg 2000b; Holt et al. 2006a), the B afferents recorded in this preparation are inhibited when shock trains are delivered to efferent fibers; the inhibition is associated with a reduction in quantal rate and represents an action on hair cells. In contrast, CD afferents are excited by efferent activation; the excitation is the result of a direct EPSP on the afferent and is not associated with a change in quantal rate.
In a later section (Diminishing quanta), we describe a decline in quantal size after impalement. To ensure that the decline had reached a steady state, we typically waited >5 min after impalement before collecting the data reported in other sections of this study. As an indication that long-term trends were no longer present, we measured the resting variances before and after the relevant indenter trial for each unit. The ratio of the variances before and after stimulation averaged 1.02 ± 0.03 for the 16 CD units contributing to Tables 1 and 2. By this criterion, long-term trends did not affect the data. In addition, when these data were collected, resting potentials were quite hyperpolarized, averaging −68.1 ± 0.3 mV.
TABLE 1.
Quantal activity of calyx-bearing (CD) and bouton (B) units
| Unit Type | n | Indenter Amplitude, μm | Quantal Duration, ms | Quantal Size, μV | Quantal Rate, l/s |
Quantal Phase, deg | |
|---|---|---|---|---|---|---|---|
| Mid | Maximum | ||||||
| CD | |||||||
| Rest | 13 | 3.18 ± 0.44 | 0.13 ± 0.022** | 740 (420–2,690) | |||
| Stimulated | 16 | 78.0 ± 7.9** | 2.38 ± 0.22 | 0.13 ± 0.016** | 780 (340–1,590) | 2,900 (1,850–4,380) | 4.6 ± 8.5* |
| B | |||||||
| Rest | 16 | 3.85 ± 0.23 | 0.40 ± 0.028** | 430 (260–830) | |||
| Stimulated | 16 | 17.9 ± 4.9** | 3.06 ± 0.22 | 0.34 ± 0.036** | 350 (300–1,000) | 1,480 (1,070–3,090) | 27.8 ± 3.9* |
Values are means ± SE; n, number of units. Rest and stimulated activity in the absence and presence of 0.3-Hz indenter stimulation. Stimulated data were taken at the point of maximum quantal rate. Quantal rate, medians (interquartile ranges in parentheses); mid refers to the resting rate and for the stimulated points ± 90° from the point of maximal excitation. Quantal phase is based on Fourier fits to quantal rate (Eq. 7). Two-tailed, unpaired t-tests were used to compare values from B and CD samples:
P < 0.05;
P < 0.01. Significance is indicated on both CD and B entries.
TABLE 2.
Quantal and nonquantal modulation of calyx-bearing (CD) and bouton (B) afferents
| Unit Type | n | Total (T) |
Quantal (Q) |
Nonquantal (NQ) |
Gain Ratio NQ/T | |||
|---|---|---|---|---|---|---|---|---|
| Amplitude, mV (Gain, mV/μm) | Phase, deg | Amplitude, mV (Gain, mV/μm) | Phase, deg | Amplitude, mV (Gain, mV/μm) | Phase, deg | |||
| CD | 16 | 1.77 ± 0.27 (0.031 ± 0.008)** | 16.0 ± 3.2** | 0.36 ± 0.08** (0.008 ± 0.003)** | 18.5 ± 6.7* | 1.44 ± 0.28 (0.024 ± 0.005)** | 14.1 ± 3.4** | 0.78 ± 0.06* |
| B | 16 | 2.35 ± 0.24 (0.287 ± 0.058)** | 38.6 ± 2.5** | 1.17 ± 0.16** (0.143 ± 0.027)** | 35.2 ± 3.9* | 1.22 ± 0.22 (0.147 ± 0.041)** | 48.5 ± 5.3** | 0.51 ± 0.06* |
Values are means ± SE; n, number of units. The total modulation is divided into quantal (Q) and nonquantal (NQ) components. For each component, an amplitude and phase are determined. Two values are given for each amplitude (gain), the value of the component in millivolts and, in parentheses, the the ratio of the response amplitude to the indenter amplitude. Phases are presented with respect to peak indenter excitation with positive values denoting phase leads. In addition for each unit group, the ratio NQ/T is presented. Two-tailed, unpaired t-tests were used to compare values from B and CD samples:
P < 0.05;
P < 0.01. Significance is indicated on both CD and B entries.
Synaptic transmission in CD units
Figure 2 includes a set of records from a CD unit identified by its efferent-mediated response. Efferent shock trains resulted in an average EPSP with a peak of 1.1 mV and duration of 2 s (Fig. 2A). Inspection of individual records indicated that there was no obvious change in quantal variance during the EPSP (Fig. 2B), which was confirmed with ensemble averages (see Holt et al. 2006a). In the first minute after impalement, the unit had a resting membrane potential of −47 mV (Fig. 2D). Spikes were present, including a low resting rate and a response to sinusoidal indentation with a maximal rate of 50 – 60 spikes/s occurring during peak excitation (Exc, Fig. 2C) and no spikes during peak inhibition (Inh, Fig. 2C). As the impalement continued, the membrane potential fell to −62 mV and this was accompanied by a reduction in spike rate. Spikes were no longer seen in the absence of indenter stimulation and only a few spikes occurred during peak excitation. To eliminate the remaining spikes, TTX was applied, during which time the resting potential fell to −68 mV and the spikes disappeared, leaving fast, subthresold potentials riding on a slower modulation in the membrane potential (Fig. 2E). The rate of the fast potentials and the slower modulation were in synchrony with the indenter stimulus. High-pass filtering removed the slow modulation, allowing us to characterize the fast events in isolation (Fig. 2F).
FIG. 2.

Calyx-bearing (CD) units can be identified by their response to electrical stimulation of efferent fibers and their activity characterized in the absence and presence of canal-duct indentation. A and B: response to 20 shocks, 200/s, delivered to efferent fibers in the cross-bridge interconnecting the anterior and posterior vestibular nerves. Average depolarizing response to 11 consecutive trials (A) and an individual response (B) to show that quantal activity is unaffected by efferent excitation. Spikes are seen at the peaks of the excitatory postsynaptic potentials (EPSPs) in both records. C: indenter stimulation, 0.3 Hz, peak amplitudes, about ±90 μm; no stimulus (Rest), inhibitory (Inh), and excitatory (Exc) stimulation. D–F: records include 3 s of rest followed by slightly over 2 cycles of stimulation. D was taken within the first minute after impalement. E and F: unfiltered and filtered versions, respectively, of activity recorded at a point 10 min after impalement and 7 min after the application of tetrodotoxin (TTX).
There are several indications that the fast events were mEPSPs, representing the quantal release of neurotransmitter from hair cells. Expanding the unfiltered records showed that at low rates, such as occurred during indenter inhibition, the fast potentials were discrete events (arrows, Fig. 3A, Inh) in the shape of mEPSPs (Fig. 3B). During the higher rates occurring during rest or indenter excitation, the events overlapped (Fig. 3A, Rest and Exc), but had similar shapes (Fig. 3B). Deconvolution of resting activity showed that, except for a shortage of small values, the intervals between events were exponentially distributed, consistent with a Poisson process (Fig. 3C). The lack of short intervals reflects an inability of the deconvolution algorithm to detect the second of two closely spaced events (Holt et al. 2006b). Also consistent with a Poisson process, there was the lack of correlation between adjacent intervals (r = −0.01 ± 0.030).
FIG. 3.

Quantal activity in CD units is modulated by mechanical stimulation and conforms to Poisson statistics. Data are from the same CD unit as in Fig. 2. A: 200-ms samples of activity during rest (middle), inhibition (bottom), and excitation (top). Individual miniature mEPSPs are seen during inhibition (arrows) and similarly shaped events overlap at higher quantal rates during rest and excitation. B: each of the 12 waves of the indenter response was divided into 3 parts based on whether quantal variance was high, medium, or low. mEPSPs were obtained from the high (Excitation) and low thirds (Inhibition) by Wiener filtering. Two sets of mEPSPs (excitation, n = 1,588; inhibition, n = 166) were averaged for all 12 waves and the 2 average mEPSPs were each normalized to unity amplitude. Quantal durations (qdur) are similar because in this particular unit sinusoidal modulations of qdur and quantal variance were 90° apart, not 180° apart as was typical of the entire population. C: interevent-interval histogram (bars) of mEPSPs detected by deconvolution and its fit by an exponential distribution (line) expected for a Poisson process. A total of 1,142 events were detected with a detection threshold of 0.125 mV in a 5-s sample, equivalent to a quantal rate, qrate = 228/s. Lack of short intervals reflects the inability of the deconvolution algorithm to detect intervals <1 ms. Exponential fit predicts that there were 1,928 events (qrate = 386/s), close to that predicted from shot-noise analysis (qrate = 364/s).
Confirming the quantal nature of the activity, it was reduced when the external Ca2+ concentration was lowered (Fig. 4A) or when the AMPA-receptor blocker CNQX was introduced (Fig. 4B). Glutamate antagonists almost completely blocked any observable quantal activity in 10 units, five with CNQX alone and five with the combination of CNQX and AP-5. AP-5 by itself was ineffective in three units.
FIG. 4.

Neurotransmission in CD afferents is diminished in low concentrations of external Ca2+ and involves non–N-methyl-D-aspartate (non-NMDA) receptors. All traces are high-pass filtered records of resting activity followed by the response to 0.3-Hz indentations. A: transmission was almost completely blocked in a CD unit when the control solution (top) was replaced by a low-Ca2+ solution for several minutes (middle) and showed a partial return after the control solution was returned for several minutes (bottom). Variance, after subtraction of the residual variance, was reduced from the top to the middle record by 100% during rest and by 92% during peak excitation. Washing resulted in a return of the variance relative to control of 30% (rest) and 51% (maximal excitation). B: quantal activity in another CD unit is nearly abolished when the α-amino-3-hydroxy-5-methyl-4-isoxazolepropionic acid (AMPA)–receptor blocker 6-cyano-7-nitroquinoxaline-2,3-dione (CNQX) was added to the control solution. Top: control record. Middle: CNQX was added immediately before this trial and begins to progressively block transmission. Bottom: transmission is almost completely blocked about 1 min after the end of the middle record. Calibrations: 0.5 mV, 1 s (A); 0.5 mV, 5 s (B).
Once a drug completely blocked quantal activity, it usually took tens of minutes for the preparation to return to normal. Given the limited holding times of our recordings, we seldom tried to reverse drug actions. Rather, these were considered specific if, once started, they proceeded much more rapidly than any change during control trials. A good example is provided by Fig. 4B. Other examples can be seen Figs. 9A and 11.
FIG. 11.

TTX suppresses quantal transmission in CD units. A: TTX was applied before the start of the trial, consisting of 12 waves of a 0.3-Hz sinusoidal indentation. There is a hyperpolarization and a reduction in quantal variance with little decline in the sinusoidal voltage modulation. B: skew–variance relation is fit by a power law with an exponent near 1.5. C: amplitude of the excitatory modulation of membrane voltage is plotted vs. the square root of the peak excitatory variance; the latter should be proportional to quantal size (qsize). A linear fit when extrapolated to zero variance indicates the presence of a nonquantal component. Other details as in Fig. 9.
Quantal analysis
We used Eqs. 5 and 6 to estimate qsizes and qrates in CD units. This required that we first determine qshapes because these are needed to estimate the integrals (I1, I2, and I3) in Eq. 4. qshapes were deduced by spectral analyses and checked by deconvolution. Once the spectral estimates of qshapes were obtained, qsizes and qrates could be determined from the second and third central moments of high-pass filtered records. The analysis was based on 16 units chosen from a larger sample of 72 units because their indenter responses had 2:1 S/N ratios during the entire excitatory half-cycle. Of the 16 units, 13 had resting activities with similarly adequate S/N ratios. For comparison, we also had data from 16 B units, which contributed to a previous paper (Holt et al. 2006b).
QUANTAL SHAPE
Figure 5A shows the power spectrum obtained from the resting discharge of a CD unit, which was well fit by Eq. 1 with a rate constant, α = 920 ± 35/s. The corresponding alpha function was calculated from Eq. 2 (Fig. 5C, Spectral). Deconvolution provided a second estimate of qshape (Fig. 5B). For the particular unit, the two estimates were similar (Fig. 5C). In all 13 units in which we could characterize the resting activity, there was a good correlation between the deconvolution and spectral rate constants (r = 0.89, df = 11, P ≪ 0.01).
Of the 13 units, three showed unusual features in their resting power spectra. In one, the mEPSPs during rest had a much longer duration than that of any other unit in our sample. Deconvolution confirmed the slow time course of the mEPSP. During excitation, the mEPSPs had more typical shapes. A more common type of discrepancy, sometimes seen during resting activity and more frequently observed during excitation, resulted in the mEPSP being shortened. Figure 6A shows the power spectrum for one of the two cases seen during resting activity. Here, the spectrum, rather than continually decreasing with frequency, increased to reach a peak near 70 Hz before declining. The power spectrum is only poorly fit by Eq. 1 (Fig. 6A, Alpha), but the fit is improved when Eq. 1 is multiplied by Eq. 1a (Fig. 6A, Lead-lag) with β = 94 ± 12 s and γ = 535 ± 39 s. Time functions corresponding to the two spectral fits are almost identical: up to 3 ms (Fig. 6B). At this point, the alpha function continues declining to zero, whereas the lead-lag function shows an undershoot of nearly 20% (Fig. 6B).
Because undershoots were unexpected, it was important to confirm their presence by deconvolution. For all 16 CD units, records during the excitatory half-cycle were deconvolved. In 12 of the units, deconvolution undershoots were statistically significant (P < 0.05). In addition, there was good agreement between the undershoots based on deconvolution and on spectral analysis (r = 0.87, P ≪ 0.01). Finally, both the undershoot and the preceding depolarization were blocked by CNQX (n = 3, illustrated in Supplementary Material #3).
As a measure of the lead-lag discrepancy during sinusoidal indenter stimulation, we calculated the ratio of the power at 70 Hz to that at 7 Hz for all 16 CD units. This was done at the point of peak excitation, as well as at the points that led or lagged peak excitation by 90°. Mean values were 1.74 ± 0.39 (peak excitation), 0.97 ± 0.23 (lead), and 0.95 ± 0.25 (lag). Paired t-tests showed that the ratio at peak excitation was significantly larger than that at either 90° point (P < 0.01 in both cases). Of the 16 units, ratios greater than unity were seen in 12 units (peak excitation), four units (lead), and five units (lag). Discrepancies were less common in B than in CD units. As one indication of this, spectral ratios measured at maximum excitation were greater than unity in only three of 16 B units and mean values were significantly lower than in CD units (B: 0.87 ± 0.09 vs. CD: 1.74 ± 0.39; unpaired t-test, P < 0.05).
To conclude, the resting data from many CD units could be fit by Eqs. 1 and 2. Power spectra with enhanced low-frequency values, corresponding to prolonged mEPSPs, were rare. A midfrequency enhancement, corresponding to an mEPSP shortened by an undershoot, was occasionally seen during rest in CD units and was common during peak excitation in CD, but not in B, units. The presence of undershoots was confirmed by deconvolution. Because all components, including the undershoot, are blocked by CNQX, it would appear that they all depend on the activation of AMPA receptors.
QUANTAL DURATION, SIZE, AND RATE
These were calculated bin by bin from responses to 0.3-Hz indentations. qdur was estimated from power spectra, whereas a shot-noise analysis was used to estimate the other two parameters. Results are illustrated for a single unit (Fig. 7, points fit by solid line). As a first step, lead-lag fits were obtained to spectral data (product of Eqs. 1 and 1a), which were then used to deduce the corresponding time function (Eq. 2a). Integration of the time function gives qdur (Fig. 7A). When plotted as a function of sinusoidal phase, qdur varies between 3 and 4 ms and a sinusoidal fit of available points reaches a maximum 23 ± 6° in advance of peak indenter inhibition. qsize, deduced from Eq. 5, is 0.1–0.15 mV and a sinusoidal fit of available points reaches a maximum lagging peak inhibition by −80 ± 14° (Fig. 7B). To determine whether there were consistent variations with sinusoidal phase, we averaged data for all 16 CD units. The averages, which are expressed as sine-wave fits in Fig. 7 (dashed lines), gave a one-sided qdur modulation of 0.70 ± 0.16 ms with a maximum at a phase lead of 34 ± 10° with respect to peak inhibition. The corresponding values for qsize were 0.035 ± 0.006 mV and −75 ± 6° with respect to peak inhibition. In both cases, the average modulation was nearly 25% of the average baseline value and was statistically significant (P ≪ 0.01).
Once qsize was estimated, we used Eq. 6 to calculate values of qrate. In the absence of stimulation, qrate in the unit of Fig. 7C was 1,095/s. During the excitatory half-cycle, qrate is sinusoidally modulated, ranging during the excitatory half-cycle from just below 1,500/s to a peak near 3,000/s and is slightly phase advanced from peak excitatory indentation (Fig. 7C, arrow). Indenter inhibition reduces qrate values to <500/s. Also shown is the excitatory sine-wave fit to the average qrate modulation for all 16 units (Fig. 7 C, dashed line, P ≪ 0.01).
Results are summarized in Table 1 for all 16 CD units and for the 16 B units described previously (Holt et al. 2006b). Both resting and stimulated activity are included. qsize was considerably smaller in CD units. There were also suggestions of differences in qdur and various measures of qrate, but in most cases these were not statistically significant. qrate in CD units leads peak excitatory indentation on average by about 5°, which is 20–25° less than the phase lead seen in B units.
Perhaps the most obvious difference between the two unit groups is the much larger indenter amplitudes needed in CD units to produce roughly comparable responses to those in B units. This can be illustrated by calculating gains on a unit-by-unit basis. Consider qrate modulation. In absolute terms, the mean modulation during the excitatory half-cycle is not significantly different between the two groups (B: 1,640 ± 350/s vs. CD: 2,240 ± 350/s, P > 0.30). When indenter amplitude is taken into account, qrate gain is almost sixfold larger in B units (B: 194 ± 58/s · μm vs. CD: 34 ± 6.1/s · μm, P < 0.02).
Quantal versus nonquantal modulation
Sinusoidal indenter stimulation results in a modulation of the membrane potential. The question arises: Can the modulation be explained by variations in quantal activity or do we have to invoke the existence of nonquantal transmission? We took two approaches to this issue. First, we used shot-noise analysis to compare the empirically observed or total (T) modulation with the modulation expected from quantal activity (Q) (Eq. 7). A discrepancy between the two would suggest the presence of nonquantal (NQ) modulation. Second, we used pharmacological agents, such as CNQX, to block quantal activity. A drug-induced reduction in quantal activity much larger than the decrease in T modulation also provides evidence for NQ transmission.
SHOT-NOISE CALCULATIONS
These are illustrated in Fig. 8, A–C for a particular unit. T is measured in the unfiltered record (Fig. 8A), whereas the quantal parameters needed to estimate Q modulation are obtained from the corresponding high-pass filtered record (Fig. 8B). Because filtering attenuates T > 500-fold, the Q estimate is virtually unaffected by the T modulation. Nonquantal transmission is obtained as the difference, NQ = T − Q. Estimates are based on sinusoidal fits to excitatory half-cycles. The particular unit exemplifies two features seen in many CD units (Fig. 8C). First, NQ (1.37 ± 0.04 mV) is larger than Q (0.24 ± 0.02 mV). Second, Q and NQ are nearly in phase (NQ: 5.5 ± 2.0°; Q: 11.9 ± 2.0°) and only slightly lead the indenter stimulus. A third feature is seen when quantal activity is nearly silenced by indenter inhibition. Specifically, T can continue to vary even in the almost complete absence of Q. Such a dissociation between T and Q provides ancillary evidence for NQ. An even more impressive dissociation is seen in another unit, one of three examples from our larger sample of 72 units, in which there was a voltage modulation, but no quantal activity (Fig. 8D).
FIG. 8.

Voltage modulation (T) in CD units can be decomposed into quantal (Q) and nonquantal (NQ) components. A: unfiltered response of a CD unit to 6 cycles of a 0.3-Hz sinusoidal indentation, one-sided amplitude of 106 μm. B: high-pass filtered record of the same response eliminated sinusoidal voltage modulation, but preserved high-frequency (quantal) activity. C: data for the middle 4 of the 6 cycles in A and B are averaged into single-cycle histograms, 24 bins/cycle. Downward arrowheads in C and D, maximum excitatory indentation. Total (T) is an empirical average; quantal (Q) is calculated from Eq. 7; nonquantal (NQ), difference between T and Q. Excitatory half-cycles fit by half-wave sinusoids. D: single-cycle histograms from another unit in which there is a nonquantal (NQ) response in the absence of a quantal (Q) response. NQ was intrinsic to the fiber as extracellular control records were flat (see Holt et al. 2006b for discussion).
Table 2 summarizes the results for our selected samples of CD and B units. A depolarizing NQ component was seen during indenter excitation in all CD and B units. The estimated NQ components in the two unit groups were of comparable magnitude and were both highly significant (P < 0.01 in both cases). In other respects, there were differences between the two groups. All three components had much larger phase leads in B units, paralleling a similar difference in spike discharge (Brichta and Goldberg 2000a). The Q component is particularly small in CD units, which is the result of these units having relatively small values of qdur and, especially, qsize. Expressed as a ratio with T, NQ is slightly but significantly larger in CD units.
BLOCKING QUANTAL ACTIVITY
Figure 8 provides evidence for NQ because voltage modulation can persist after quantal transmission is abolished by indenter inhibition. A similar rationale is provided when quantal activity is blocked pharmacologically, e.g., by CNQX and AP-5. Results from one CD unit are shown in Fig. 9. The drugs were administered before the illustrated trial and resulted in a gradual but large reduction in the high-pass variance without a commensurate decrease in the low-pass voltage modulation (Fig. 9A). The peak skew versus the peak variance is plotted in Fig. 9B for this and the next trial. A power-law regression gave an exponent of b = 1.68 ± 0.19, statistically consistent with the exponent of 1.5 expected from a variation in qsize (Eq. 9). To estimate NQ, we plotted the amplitude of the low-pass modulation during the excitatory half-cycle against the square root of the peak variance (Fig. 9C). The latter quantity should be proportional to qsize so the y-intercept of the linear regression should represent the modulation when qsize = 0. As such, the y-intercept can be taken as NQ. In this case, NQ = 1.59 ± 0.09 mV, close to the value of 1.67 ± 0.03 mV obtained from a shot-noise analysis of a predrug control record.
Similar analyses were done in a total of six CD units. The mean value of the power-law exponent obtained from the skew–variance relation was 1.57 ± 0.08. When estimated from CNQX experiments, the value of NQ was 73.7 ± 11.0% of that gotten from shot-noise analyses of control trials. t-tests were used to evaluate the probability that NQ differed from zero. In five of the six cases, P ≪ 0.001, providing strong evidence for the existence of NQ.
We compared the NQ values obtained in the presence of glutamate blockers with that obtained from shot-noise analysis before drug application. The extent to which the glutamate estimate was the smaller of the two was taken as an indication that glutamate accumulation contributed to NQ. A similar analysis had previously been done in B units (Holt et al. 2006b). The two unit groups differ in the relative values of the CNQX and shot-noise estimates of NQ. In B units, the CNQX estimate was, on average, 30–35% of the shot-noise estimate. The relatively small size of the CNQX estimate was taken as indicating that much of NQ was the result of spillover of glutamate from neighboring synapses. The higher percentage obtained in the present study implies that glutamate spillover is less important in CD units. In fact, in three of the six CD units studied with CNQX, the presumed glutamate contribution to NQ was <10%.
Diminishing quanta
The gains of CD units, both those related to qrate and those involving T, Q, and NQ modulation are smaller than in those of B units. Such differences could have been anticipated from the spike responses of the two unit groups. Based on extracellular recordings, the gains (in spikes · s−1/deg · s−1) are about four times smaller in CD units (Brichta and Goldberg 2000a). Differences in the three modulation components are larger than predicted by spike responses. Reference to Table 2 indicates that average gains in CD units are smaller by factors of 9 × (T), 18 × (Q), and 6 × (NQ). Another indication that the excitability of our impaled CD units was diminished comes from their spiking behavior. In such units, the rate of spike discharge declined, in many cases to zero, even without the addition of TTX or the presence of QX-314 in the microelectrode. We naturally suspected that something was wrong with the present preparation. Here, to record close to the neuroepithelium, we exposed the base of the ampulla, whereas our previous recordings were made near the junction of the posterior vestibular nerve with the brain stem and did not involve exposing the membranous labyrinth. Our suspicions were allayed by recording extracellular spike discharge in our present preparation and finding, as reported previously (Holt et al. 2006b), that the gains and phases of both B and CD units were consistent with our previous, more remote recordings.
We next considered the possibility that the reduced excitability was related to the impalement of afferents. To examine this possibility, we recorded activity close to the time of impalement and found that there was a burst of spikes so intense that it masked quantal activity. When the spikes subsided, we saw a dramatic decline in the high-pass variance attributable to a decline in qsize. An example is presented in Fig. 10. The recording begins a few seconds after impalement. There is a spike burst at an initial rate of 150 spikes/s that lasts slightly >7 s (Fig. 10A). The rapid decline in spike activity may be partly attributable to the presence of QX-314 in the microelectrode. After the spike burst, as can be seen in the high-gain, high-pass trace (Fig. 10B), there is a decline in variance. As the variance (corrected for residual variance) declines, there is an associated decline in skew (Fig. 10C). The skew versus variance relation is fit by a power law with an exponent of 1.67 ± 0.17, consistent with a change in qsize, which, as calculated from Eq. 5, declines sevenfold before the variance becomes too small to provide reliable estimates (Fig. 10C). Postsynaptic efferent responses recorded during the same period were relatively constant during the variance decline (Fig. 10D). The near constancy of the efferent response eliminates a drop in postsynaptic impedance as a likely explanation for the decline in variance and qsize.
FIG. 10.

Quantal size in CD units declines after impalement. A: unfiltered record from a CD unit begins shortly after impalement. There is a burst of action potentials whose rapid decline may be partly attributable to the diffusion of QX-314 out of the microelectrode. B: a high-gain, high-pass filtered record shows that after the spike burst there is a decline in quantal variance. Large transients are artifacts resulting from shock trains delivered to efferent fibers. C: as the variance (corrected for residual variance) declines, there is a concurrent decline in skew. Skew vs. variance relation is fit by a power law (not shown). Quantal size (qsize) is calculated from Eq. 5. D: efferent response amplitudes are plotted as a function of the square root of variance, which should be proportional to qsize, for this and 2 other units. Inset: example of the efferent response for this unit (calibrations, 0.2 mV, 0.2 s). There is a near constancy of the efferent responses in the face of a large decline in qsize.
In the next section we show that TTX not only eliminates spikes, but also results in a decline in qsize, so some of the decline seen in Fig. 10 might be explained by the presence of QX-314. This cannot be the entire explanation because a decline in qsize occurs in the absence of Na+-channel blockers. Specifically, a large, postimpalement decline was captured in eight units, three with QX-314 and five without it. In all eight units, there was a spike burst after impalement. The only obvious effect of QX-314 was that the value of qsize after the spike burst was somewhat smaller (0.13 ± 0.020 vs. 0.21 ± 0.028 mV). On average, the decline in qsize, expressed as a ratio, was 4.2 ± 0.5-fold. The power law obtained by plotting skew versus variance gave an average exponent for the eight units of 1.68 ± 0.038, somewhat larger than the value of 1.5 expected of a qsize decline.
Channel blockers
Because immunohistochemistry indicated the presence of voltage-gated ion channels in calyx endings (Hurley et al. 2006; Kharkovets et al. 2000; Lysakowski and Price 2003; Wooltorton et al. 2007), we were interested in determining the effects of ion-channel blockers on quantal activity. We find that TTX reduces quantal transmission, whereas K+ channel blockers have the opposite effect.
TTX
When we used TTX to block spikes in CD units, there was an associated decrease in quantal transmission. An example is shown in Fig. 11. In the trial after TTX application, there was a 5.8-mV hyperpolarization (Fig. 11A). Concomitant with the hyperpolarization, there is a reduction in the peak variance and skew in the indenter response (Fig. 11, A and B). A power-law fit to the skew–variance relation gives an exponent, 1.48 ± 0.14, consistent with a change in qsize and indicating that the latter should be proportional to the square root of the variance (var1/2). From the proportionality, we estimate that TTX resulted in a 4.5-fold decrease in qsize. In addition, extrapolation of the linear relation between the amplitude of the low-pass modulation and var1/2 implies the existence of an NQ value of 0.55 ± 0.056 mV (Fig. 11C). We confirmed that the hyperpolarization and the variance decline during TTX application were much larger than those occurring during predrug control trials. During TTX, the variance was reduced 19-fold, as compared with the 1.15-fold control reduction. Similarly, the TTX hyperpolarization was larger than the control hyperpolarization (−5.5 vs. −1.1 mV). The comparisons provide evidence that the effects can be attributed to the drug and not merely to a continued postimpalement hyperpolarization and decline in qsize.
Similar results were obtained in a total of five units. TTX resulted in a hyperpolarization of −4.0 ± 0.42 mV compared with −0.39 ± 0.66 mV in control records. The quantal variance was reduced on average 16.1 ± 5.9-fold by TTX, as compared with a control reduction of 1.53 ± 0.53-fold. A 16-fold reduction in variance is equivalent to a fourfold decrease in qsize. Power-law regressions of the skew–variance relations gave an exponent of 1.56 ± 0.066. Extrapolation of (var)1/2 to zero left a mean NQ for the five units of 0.68 ± 0.17 mV compared with a T of 0.95 ± 0.23 obtained from control records. The NQ/T ratio of 0.70 ± 0.06 obtained in this way is similar to that of 0.78 ± 0.06 obtained from shot-noise calculations (Table 2).
K+-CHANNEL BLOCKERS
Immunohistochemistry (Hurley et al. 2006; Kharkovets et al. 2000; Lysakowski and Price 2003) and physiological recordings (Rennie and Streeter 2006) provide evidence for the presence of KCNQ and possibly other K+ channels in calyx endings. We investigated the effect of several K+-channel blockers, including linopirdine, XE-991, and E-4031, on synaptic activity. In a few instances, spikes were blocked with TTX, which was kept at the same concentration throughout the experiment. Our most consistent results were obtained with linopirdine.
Application of linopirdine enhanced quantal transmission. As can be seen in the unit of Fig. 12, there was an increase in quantal variance and the reappearance of spikes (cf. Fig. 12, A and B). Underlying these effects, there was an increase in qsize (Fig. 12D) and qdur (Fig. 12, C and D), but not in qrate (Fig. 12E). A regression gave an exponent of 1.56 ± 0.15 for the skew–variance relation (not shown), in agreement with the importance of qsize in the resurrection of quantal activity. Drug application resulted in a >7-mV depolarization, from a control value −66.5 to −59.1 mV. Although linopirdine lengthened the mEPSP, the presence of an undershoot was unaffected (Fig. 12C).
FIG. 12.

K+-channel blockers enhance synaptic transmission in CD units. A and B: low-pass records (top) and high-pass filtered records (bottom) before (A) and during (B) application of linopirdine. Blocker increased quantal activity. Spikes, which had disappeared long before the control record, reappeared; they were digitally removed from the record; their times of occurrence are indicated by marks under the high-pass record in B. Calibrations apply to both A and B. C: EPSPs deduced from spectral analyses of excitatory peaks. Linopirdine resulted in an increase in qsize and qdur (D), but not in qrate (E). Drug applied between trials 0 and 1 (D, E). Linopirdine records (B, C), trial 5.
An enhancement of quantal transmission was seen in four units, including the one illustrated in Fig. 12. The drugs used were linopirdine (n = 2), XE-991 (n = 1), and the combination of linopirdine and E-4031 (n = 1). Leaving aside the unit in which linopirdine and E-4031 were combined, the variance increased in the other three units by an average of 5.6 ± 1.3-fold and the skew–variance relation was fit by a power law with an exponent of 1.59 ± 0.14. In the combined case, the effect might be ascribed to linopirdine because E-4031 was ineffective by itself in three additional units. Adding the fourth unit did not significantly change the averages: 5.2 ± 1.1-fold for the variance and 1.58 ± 0.10 for the skew–variance ratio. Only two of the enhanced units, including the combined unit, showed a depolarization on drug application. No consistent effect was seen on NQ.
Ultrastructural examination of various types of synapses
As can be seen in a longitudinal section of the posterior crista (Fig. 13A), type I and type II hair cells can exist side by side in the central zone. In our limited 31-section samples from two cristae, there were 22.5 type I and 14 type II hair-cell equivalents for a ratio of 1.6:1. As was expected from previous work (Brichta and Peterson 1994), the great majority of calyx endings were complex, innervating two or more hair cells (see cells 80L and 80R in Fig. 13A). Synaptic bodies were large spherules, 200 –500 μm in diameter. We examined a total of 345 synapses. As seen at higher power (Fig. 13, B–E), the synaptic bodies are attached to the presynaptic membrane typically by two or more electron-dense pedicles and are located opposite a postsynaptic density. Clear vesicles are seen surrounding the synaptic body on all sides, including some in the space adjacent to the presynaptic membrane. In many synapses (Fig. 13, C and D), there is an accumulation of vesicles in the cytoplasm at some distance from the synaptic body.
FIG. 13.
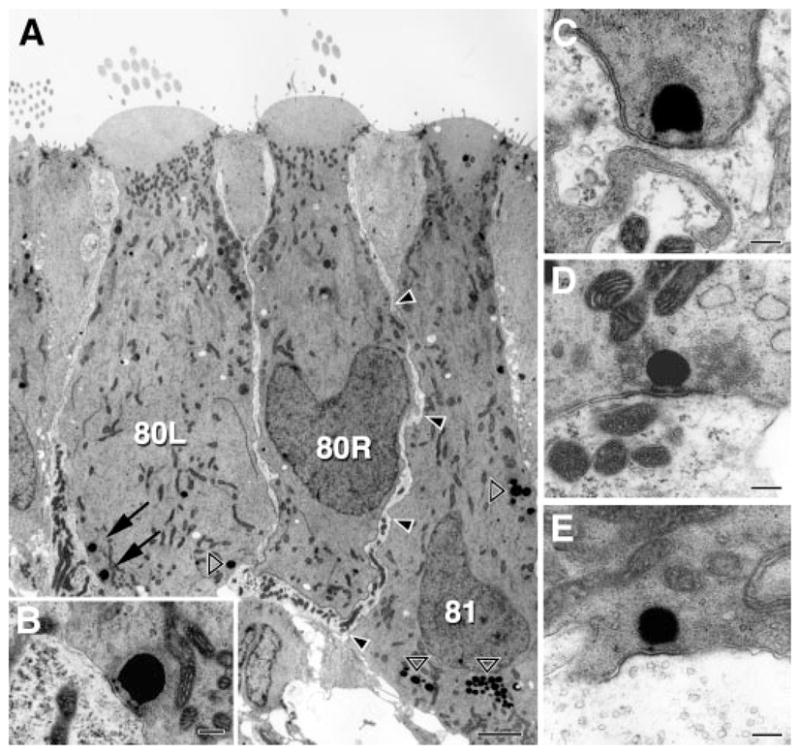
Three classes of afferent synapses. Electron micrographs from the central zone of a turtle posterior crista. A: 2 type I hair cells (80L, 80R) are innervated by a single calyx ending, whereas a type II hair cell (81) makes a long apposition (arrowheads) with the calyx ending. Two synapses are seen in cell 80L (arrows), of which the bottom one is shown at high magnification in B. Other dark, circular structures are lipid bodies (open arrowheads). B–E: synapses in type I hair cells (B, C) and in type II hair cells contacting an afferent bouton (D) and the outer face of a calyx ending (E). Scale bars: 2 μm (A) and 200 nm (B–E).
Synapses were common in both type I and type II hair cells. Our dissector estimates of the number of synapses per hair cell were 32.6 (type I) and 41.6 (type II). These numbers are larger than those found in mammals (Lysakowski and Goldberg 1997, 2007).
Our main reason for doing the ultrastructural study was to evaluate the relative numbers of inner-face and outer-face synapses converging on calyx endings and thereby assess their potential contributions to quantal activity in CD units. Long appositions between type II hair cells and calyx endings were common and might suggest that outer-face synapses were numerous. In fact, there were 5.7 such synapses per type I hair cell. Based on the numbers of synapses in type I and type II hair cells, inner-face outnumbered outer-face synapses on calyx endings by a 32.6/5.7 or 5.7:1 ratio, whereas outer-face synapses made up 13.7% of synapses in type II hair cells.
DISCUSSION
We have studied synaptic transmission in calyx-bearing (CD) afferents in the turtle posterior crista and compared results with those previously described in bouton (B) afferents (Holt et al. 2006b). The two afferent groups were distinguished by their distinctive efferent-mediated responses (Brichta and Goldberg 2000b; Holt et al. 2006a). Recordings were made with sharp electrodes from myelinated fibers sufficiently close to the neuroepithelium to make it unlikely that the cable properties of the myelinated axon would affect mEPSPs (see Supplementary Material #1). Moreover, CD fibers have compact terminal trees (Brichta and Goldberg 2000a; Brichta and Peterson 1994), which also makes cable distortion less likely than in B units.
We used quantitative methods, including spectral techniques, deconvolution, and shot-noise calculations, to characterize quantal and nonquantal transmission during rest and during mechanical stimulation. Quantal activity consists of relatively brief mEPSPs whose rate is reduced when external Ca2+ is lowered. They occur at high rates (250 –2,500/s) in the absence of vestibular stimulation and can be increased to nearly 5,000/s by excitatory indentation of the canal duct. Confirming a previous extracellular study (Bonsaquet et al. 2006), transmission can be blocked by CNQX, an AMPA-receptor blocker, but is unaffected by AP-5, an NMDA-receptor antagonist. Nonquantal transmission is indicated by the modulation in membrane potential during sinusoidal mechanical stimulation being larger than can be accounted for by quantal activity. The conclusion was verified by the persistence of modulation after quantal activity was abolished pharmacologically.
One technical point needs emphasis. Quantal events in CD units are small, typically 0.1– 0.2 mV. Recording noise is on the order of 0.05 mV so it might seem implausible that we could characterize quantal activity. Many studies of this kind rely on deconvolution algorithms, which require a good separation between synaptic events and noise. We have mainly used deconvolution to confirm our spectral estimates of quantal shape. This was made possible because, with the large spread of quantal sizes in single recordings, sufficient numbers of mEPSPs occur well above the noise. In most cases, deconvolution could not be used to estimate qrate and qsize. Rather, we used shot-noise calculations that, as shown by simulations, provide reliable estimates provided that the signal-to-noise (S/N) ratio is on the order of 2:1. Under such conditions, many of our mEPSPs are submerged in noise. This by itself is unimportant because there is an algebraic addition of variances and skews derived from the signal and noise (Cramér 1961; Rice 1944). Also, of the various sources of voltage fluctuations, including instrumental and channel noise, only quantal activity has a nonzero skew (Holt et al. 2006b; Neher and Sakaba 2003). Thus residual noise can be estimated as the variance remaining when the skew is extrapolated to zero.
Quantal transmission in CD units was characterized by small qsizes and high qrates. Our qsizes were small compared with those in the frog posterior crista (Rossi et al. 1989, 1994). Some of the difference can be attributed to a fourfold postimpalement decline in qsize. Correcting for the decline, which may be viewed as an artifact, the mean qsize in Table 1 is increased to 0.5 mV. The latter value is comparable to that seen in our B units, but three to four times smaller than the mEPSPs recorded in the frog. To see whether this species difference could be due to technical differences, we have recorded from the frog with methods similar to those we have used in the turtle. We confirm that frog mEPSPs are typically 1.5–2 mV. That qsizes are small in CD units is not surprising. Because of the large size of the calyx ending (Fig. 13) and the high density of voltage-gated conductances found there (Lysakowski and Price 2003; Lysakowski et al. 2007), it should have a low input impedance, which should contribute to its small qsize. A low calyx impedance should have virtually identical effects on inner-face inputs from type I hair cells and outer-face synapses from type II hair cells (Goldberg 1996).
The high qrates may be related to the large number of ribbon synapses converging on each calyx afferent. To determine whether the combination of small qsizes and high qrates could provide depolarization adequate to modulate spike discharge, we multiplied the quantal depolarization (Q) in Table 2 by 4 to correct for postimpalement decline. We get a Q value near 1.5 mV and a T value near 3 mV. A model of repetitive discharge (Smith and Goldberg 1986) gives a proportionality constant near 30 spikes · s−1/mV for a response of about 100 spikes/s, not an unreasonable estimate for discharge modulation (Brichta and Goldberg 2000b). At this point, it is well to ask what is the most appropriate place to record synaptic voltages. The answer is the initial segment, where spikes are initiated. Morphological criteria have been developed for recognizing initial segments (Hedstrom and Rasband 2006; Salzer 2003). We have been investigating this in calyx-bearing fibers in mammals. It would appear to be at the heminode, the junction between the unmyelinated terminal and the myelinated fiber. Our cable calculations suggest that the mEPSPs we record in the myelinated fiber are attenuated <10% from those at the heminode.
Quantal transmission
There is quantal transmission in calyx-bearing afferents in the turtle posterior crista. Sources of quantal activity include synapses between type I hair cells and the calyx ending’s inner face and type II synapses contacting the ending’s outer face or the boutons of dimorphic fibers. Several synapses are found at the base of each type I hair cell in mammals (Lysakowski and Goldberg 1997, 2007), as well as in reptiles and birds (Lysakowski 1996; Lysakowski and Goldberg 2004; Wersäll and Bagger-Sjöbäck 1974). In the turtle posterior crista, for example, there are about 30 – 40 ribbon synapses in type I and type II hair cells in the central zone, where calyx and dimorphic fibers are exclusively found. In addition, we counted an average of 5.7 outer-face ribbon synapses per type I hair. Because individual calyx endings enclose on average just under three type I hair cells (Brichta and Peterson 1994), about 95 inner-face synapses might be made on each calyx afferent, as compared with 15 outer-face synapses. Dimorphic fibers have fewer calyx endings than calyx fibers and relatively few bouton endings (Brichta and Peterson 1994). From the counts provided in the latter paper and our current ultrastructural findings, we estimate that a dimorphic unit might be contacted by 45 inner-face synapses and 22.5 synapses from type II hair cells, including those coming from boutons on thin collaterals.
The presence of large numbers of inner-face synapses in several species, including the turtle, provides strong morphological evidence for quantal transmission between type I hair cells and calyx endings as does the presence of AMPA receptors on the calyx inner face (Bonsaquet et al. 2006; Matsubara et al. 1999). There is physiological evidence as well. mEPSCs have been recorded from solitary calyx endings in contact with individual type I hair cells in the gerbil (Rennie and Streeter 2006). There is a reason for supposing that inner-face synapses make a major contribution to the quantal activity we record from the posterior ampullary nerve. In particular, quantal rates are high, in fact higher than seen in most other preparations (Glowatzki and Fuchs 2002; Keen and Hudspeth 2006; Rossi et al. 1989, 1994) and even higher than seen in B units in our preparation (Holt et al. 2006b). It would be natural to suggest that the high rates seen in our CD units can be attributed to the large number of ribbon synapses contacting the inner faces of complex calyx endings. Yet, as indicated by capacitance measurements, steady-state vesicular release rates are on the order of 200 –500/s per ribbon synapse (Edmonds et al. 2004; Parsons et al. 1994). So even the relatively small number of type II synapses on each calyx or dimorphic fiber could maintain a quantal rate in excess of 3,000/s.
If we assume that much of the quantal activity in CD afferents arises from type I hair cells, we would have to explain how synaptic activity can occur in the presence of IK,L. This is a large, outwardly rectifying, noninactivating K+ current in type I hair cells that is active at hyperpolarized potentials. As a result, resting potentials are very negative and input impedances are quite low (Brichta et al. 2002; Correia and Lang 1990; Hurley et al. 2006). Even though mechanoelectric transduction currents can be relatively large (Eatock and Lysakowski 2006; Vollrath and Eatock 2003), the combination of a negative resting potential and a low impedance would hinder such currents from depolarizing type I hair cells to levels needed to trigger neurotransmitter release (Bao et al. 2003; Dou et al. 2004). There have been two, not necessarily mutually exclusive ways out of this difficulty.
The first is the presence of NQ transmission, possibly due to K+ accumulation in the synaptic cleft (Goldberg 1996). As was first reported in the chick (Yamashita and Ohmori 1990) and confirmed here, NQ transmission occurs in CD afferents. Based on work in solitary hair cells (Eatock and Lysakowski 2006; Goldberg and Brichta 2002), 10 –25 mV of NQ depolarization would be needed to shift the hair cell from its resting potential to the point where Ca2+ channels would become activated (Bao et al. 2003; Dou et al. 2004) and quantal neurotransmission would begin. Could NQ be large enough? Because of the high concentrations of K+ channels both presynaptically and postsynaptically (Lysakowski and Price 2003), the postsynaptic NQ depolarization should provide an indication of the presynaptic depolarization as well. Postsynaptic NQ modulation evoked by indenter stimulation is never larger than a few millivolts. This might suggest that NQ is too small to overcome the hyperpolarizing effects of IK,L. But we were unable to measure the absolute level of the depolarization because we could not saturate NQ in the inhibitory direction. Thus a nonquantal mechanism remains a possible means of overcoming the effects of IK,L.
As an alternative, it has been suggested that the activation range of IK,L could be shifted in a depolarizing direction, perhaps under the influence of nitric oxide (Behrend et al. 1997; Chen and Eatock 2000; Rennie 2002), which could be released from calyx endings (Desai et al. 2004) or efferent nerve terminals (Lysakowski and Singer 2000). A glutamatergic action on hair cells could provide another means of modulating hair-cell currents. Application of glutamate has been observed to enhance neurotransmitter release (Prigioni et al. 1990; Valli et al. 1985) and there is evidence for AMPA (Bonsaquet et al. 2006; Matsubara et al. 1999), NMDA (Ishiyama et al. 1999, 2002), and mGluR (Guth et al. 1998; Hendricson and Guth 2002) receptors in hair cells.
Nonquantal transmission
It has been suggested that NQ transmission plays a unique role in transmission between type I hair cells and calyx endings (Goldberg 1996). Evidence for the suggestion came from the observation in the chick crista that the calyx ending could be depolarized by hair-cell stimulation in the apparent absence of quantal activity (Q) (Yamashita and Ohmori 1990). Although we have occasionally observed NQ in the absence of Q (Fig. 8D), both forms of transmission are present in both CD and B units (Holt et al. 2006b). NQ makes up a larger fraction of total (T) modulation in CD units, although the difference reflects in large part the postimpalement reduction in qsize that occurs in CD, but not in B, units. When the qsize reduction, which presumably would not occur in the absence of impalement, is taken into account, the Q to NQ ratio should, if anything, be larger in CD units.
What are the sources of NQ? A diffusion model suggests that shot-noise calculations would interpret spillover from neighboring synapses as NQ despite the fact that the release is quantal. This is so even in the case of CD units where the presence of the calyx ending should prevent most of the glutamate released by neighboring hair cells from reaching the calyx inner face. Nonvesicular release by a variety of means provides another source of NQ (for reviews, see Cavelier et al. 2005; Danbolt 2001). About two thirds of the NQ transmission in turtle B units was eliminated when glutamate transmission was blocked by CNQX (Holt et al. 2006b). In CD afferents, most NQ remains after glutamate receptors are blocked by CNQX (and AP-5). The NQ seen after glutamate block is probably the result of K+ accumulation, although this requires experimental proof.
One other mechanism needs to be considered. Ephaptic transmission could give rise to NQ if the extracellular flow of current from the presynaptic element altered the membrane potential of the postsynaptic element. This will happen only when the presynaptic current flow results in an appreciable extracellular voltage field, which is conceivable in the long, uninterrupted synaptic cleft of the calyx ending. Such transmission is relatively inefficient compared with conventional chemical or electrical transmission (Jefferys 1995). In the case of the type I hair cell and calyx ending, calculations suggest that the postsynaptic depolarization produced by ephaptic transmission might make a contribution to stimulus-evoked NQ modulation, but is probably too small to sustain the depolarization needed to overcome the hyperpolarizing influence of IK,L (Goldberg 1996).
Housekeeping mechanisms
Both glutamate and K+ are released from hair cells during transduction and could accumulate in the synaptic cleft of type I hair cells. The two substances have to be removed because a high concentration of either of them impairs synaptic transmission (Holt et al. 2006b). Although the present study did not concentrate on clearance mechanisms, it does provide some information as to their properties.
With few exceptions, brief mEPSPs are seen in CD units. Because diffusion from the elongated cleft should be slow, some other mechanism(s) must be operative. Three may be suggested: 1) the presence of a hitherto unidentified glutamate transporter in the hair cell or the ending; 2) desensitization of postsynaptic glutamate receptors; or 3) the clearing of glutamate arising at outer-face synapses by GLAST in supporting cells.
We now consider the removal of K+ ions from the intercellular space. In the mammalian cochlea, potassium-chloride (KCC) cotransporters in supporting cells take up the released K+ (Boettger et al. 2002, 2003). Similar mechanisms involving supporting cells may dispose of the K+ released from type II vestibular hair cells. Once again, however, because the calyx ending separates the type I hair cell from supporting cells, a novel mechanism must be used to regulate the K+ concentration in the synaptic cleft. Based on immunostaining in mammalian vestibular organs, two mechanisms may be at work. First, because KCCs are found in calyx endings (Ho et al. 2007), cotransport can be used to clear K+ from the cleft. K+ channels may also participate. There is a high concentration of KCNQ channels on calyx inner faces and a more uniform distribution of ERG channels on both faces of the ending (Hurley et al. 2006; Lysakowski and Price 2003). Here, it is important to realize that K+ accumulation in the cleft will result in K+ channels on the inner face having a more depolarized equilibrium potential than outer-face channels. As a result, there is an electromotive force favoring the circulation of K+ ions from the inner to the outer face, where they can be removed by KCCs in supporting cells. The idea, although attractive, needs experimental verification.
Disappearing quanta
A stereotyped sequence of events takes place in CD units when they are initially impaled. First, there is a high-frequency burst of spikes, which is so intense that it obscures synaptic activity. The spike rate falls over the next 10–60 s, at which point one can discern a gradual reduction in variance, which is largely the result of a decline in qsize. Although the depolarization occurring when the fiber is first impaled may trigger the initial spike burst, a comparison of B and CD units suggests that other factors may be involved. In particular, we record from myelinated axons below the neuroepithelium. Intraaxonal labeling shows that the two kinds of fibers have similar diameters (Brichta and Goldberg 2000a), so they should provide similar targets to the impaling microelectrode. Yet, most B units show at most a small, brief increase in discharge on being penetrated.
Even more clearly, the subsequent decline in qsize cannot be a direct consequence of injury because the decline continues even after the membrane potential reaches relatively hyperpolarized values. In addition, as judged by the magnitude of efferent EPSPs, the decline is not associated with a fall in the fiber’s input impedance. As an alternative, it can be suggested that the initial penetration results in a modulation of postsynaptic glutamate receptors or of ionic currents that help to determine qsize.
Postsynaptic mechanisms
At many synapses, voltage-gated conductances in the postsynaptic element help to shape quantal events (for review, see Haüsser et al. 2000). The same may be true in calyx endings. Immunostaining shows K+ conductances in mammalian calyx endings, including KCNQ4 and ERG channels (Hurley et al. 2006; Kharkovets et al. 2000; Lysakowski and Price 2003). The presence of KCNQ current was confirmed in recordings from calyx terminals isolated from vestibular organs (Hurley et al. 2006; Rennie and Streeter 2006). Because KCNQ and ERG channels can have negative activation ranges (Robbins 2001; Shi et al. 1997) they are capable of influencing qsize even under resting conditions. In addition, at least one sodium isoform (NaV1.5) is found on the calyx inner face in rats (Wooltorton et al. 2007).
To study the potential roles of ion channels, we investigated the effects of channel blockers on mEPSPs. We found that TTX drastically reduced synaptic transmission in CD units. A much smaller TTX-induced qsize reduction was seen in B units (Holt et al. 2006b). The toxin affected qsize, but not qrate, implying that its actions in CD units are postsynaptic. Although we recognize the need for a full characterization of the presumed current, a simple interpretation of our results is that the toxin worked by blocking a postsynaptic Na+ channel. Because the TTX block was associated with a hyperpolarization, we can suppose that there is a persistent (NaP) current. It is important to note that many NaP currents are TTX sensitive (Catterall et al. 2005; Crill 1996; Rush et al. 2007). NaV1.5, the one Na channel identified in the calyx inner face of mammals (Wooltorton et al. 2007), has persistence (Fozzard and Hanck 1996; Nagatomo et al. 1998), but is TTX insensitive (Catterall et al. 2005; Satin et al. 1992). However, the localization, TTX sensitivity, or inactivation parameters of NaV1.5 have not been studied in turtles.
An NaP could facilitate the flow of synaptic currents. The need for an active boost of synaptic potentials would seem required by the presumed low impedance of the calyx ending. Because there is a high concentration of K+ channels in the inner face (Hurley et al. 2006; Kharkovets et al. 2000; Lysakowski and Price 2003), synaptic currents arising from the inner or outer faces should be severely attenuated unless enhanced by some depolarizing conductance, e.g., an NaP (Goldberg 1996). That the enhancement is effective is indicated by the observation that once a correction is made for the fourfold quantal decline with impalement, qsize is comparable in CD and B units.
Linopirdine and XE-991 also affected synaptic transmission. The results with these K+ -channel blockers require some interpretation. At the concentrations used here, these drugs can affect several ion channels besides KCNQs (Lamas et al. 1997; Schnee and Brown 1998). Because our results indicate a postsynaptic action, we are mainly concerned with the blocking of conductances present in the calyx ending. Other candidates include the eag family (Wang et al. 1998) and efferent nicotinic acetylcholine receptors (Gomez-Casati et al. 2004). The lack of E-4031 effects suggests that eag channels are not involved in our linopirdine effects. Influences on nicotinic efferent channels can be discounted because in our isolated preparation, efferent axons are disconnected from the brain and are thus likely to be silent unless electrically stimulated. Perhaps for this reason, nicotinic blockers did not influence background synaptic or spike activity (Holt et al. 2006a). On this basis, we suggest that the main effect of linopirdine in our preparation is the result of a KCNQ block. The suggestion is consistent with the strong KCNQ4 staining observed in turtle calyx endings (A Lysakowski, unpublished results). At the same time, the suggestion would be strengthened by the use of several KCNQ blockers and enhancers at lower concentrations.
Active conductances can influence qdur as well as qsize. This was particularly evident by the increase in qdur when we used linopirdine. The effect can be explained were K+ channels a major contributor to terminal impedance, in which case blocking the channels would increase the terminal’s time constant. We even wondered whether quantal depolarization, by recruiting K+ channels, could contribute to the mEPSP undershoots seen in some units. Although the one test of this hypothesis was negative (Fig. 12C), it is worth pursuing.
Synaptic transmission and afferent discharge
We found that much larger mechanical stimulation is needed to produce comparable synaptic activity in CD units as seen in B units. The difference between the two unit groups is best expressed in terms of gains (the ratio of the response and stimulus amplitudes) and phases. As summarized in Table 2, the mean gain in total (T) modulation is almost 10-fold higher in B units and the mean phase leads of the latter units are larger by 20 –25°. We can correct for diminishing quanta by increasing the Q gain of CD units fourfold. When this is done, the T gain ratio decreases almost twofold (from 9.4 to 5.2), whereas the phase difference is nearly unchanged. These differences can be compared with those obtained in extracellular recordings of spike discharge. From previously published data (Brichta and Goldberg 2000a), the ratio of B to CD gains is 4.75 and the corresponding phase difference is 24°, values similar to the gain ratio and phase difference obtained from Table 2 after correction.
In using the total modulation as our benchmark, we tacitly assume that both Q and NQ contribute to the spike discharge of CD units. There can be little question about the role of Q. What about NQ? In chick CD units, the NQ response to mechanical stimulation resulted in spike discharge even though quantal activity was absent (Yamashita and Ohmori 1990). We have made similar observations in the turtle with high-frequency stimulation in the presence of CNQX. In our experiments with 0.3-Hz stimulation, Q (corrected for diminishing quanta) and NQ produce comparable postsynaptic depolarizations and both should be of functional significance in determining spike discharge.
Supplementary Material
Acknowledgments
We are grateful for the expert technical assistance of S. D. Price. A previous draft of the manuscript was read by Dr. Paul Fuchs.
GRANTS
This study was supported by National Institute on Deafness and Other Communication Disorders Grant DC-02508.
References
- Baird IL. Anatomical features of the inner ear in submammalian vertebrates. In: Keidel WD, Neff WD, editors. Handbook of Sensory Physiology. Berlin: Springer-Verlag; 1974. pp. 159–212. [Google Scholar]
- Baird RA, Desmadryl G, Fernández C, Goldberg JM. The vestibular nerve of the chinchilla. II. Relation between afferent response properties and peripheral innervation patterns in the semicircular canals. J Neurophysiol. 1988;60:182–203. doi: 10.1152/jn.1988.60.1.182. [DOI] [PubMed] [Google Scholar]
- Bao H, Wong WH, Goldberg JM, Eatock RA. Voltage-gated calcium channel currents in type I and type II hair cells isolated from the rat crista. J Neurophysiol. 2003;90:155–164. doi: 10.1152/jn.00244.2003. [DOI] [PubMed] [Google Scholar]
- Behrend O, Schwark C, Kunihiro T, Strupp M. Cyclic GMP inhibits and shifts the activation curve of the delayed-rectifier (IK1) of type I mammalian vestibular hair cells. Neuroreport. 1997;8:2687–2690. doi: 10.1097/00001756-199708180-00010. [DOI] [PubMed] [Google Scholar]
- Boettger T, Hubner CA, Maier H, Rust MB, Beck FX, Jentsch TJ. Deafness and renal tubular acidosis in mice lacking the K-Cl co-transporter KCC4. Nature. 2002;416:874–878. doi: 10.1038/416874a. [DOI] [PubMed] [Google Scholar]
- Boettger T, Rust MB, Maier H, Seidenbecher T, Schweizer M, Keating DJ, Faulhaber J, Ehmke H, Pfeffer C, Scheel O, Lemcke B, Horst J, Leuwer R, Pape HC, Volkl H, Hubner CA, Jentsch TJ. Loss of K-Cl co-transporter KCC3 causes deafness, neurodegeneration and reduced seizure threshold. EMBO J. 2003;22:5422–5434. doi: 10.1093/emboj/cdg519. [DOI] [PMC free article] [PubMed] [Google Scholar]
- Bonsaquet J, Brugeand A, Compan V, Desmadryl G, Chabbert C. AMPA type glutamate receptor mediated neurotransmission at turtle vestibular calyx synapse. J Physiol. 2006;576:63–71. doi: 10.1113/jphysiol.2006.116467. [DOI] [PMC free article] [PubMed] [Google Scholar]
- Brichta AM, Aubert A, Eatock RA, Goldberg JM. Regional analysis of whole cell currents from hair cells of the turtle posterior crista. J Neurophysiol. 2002;88:3259–3278. doi: 10.1152/jn.00770.2001. [DOI] [PubMed] [Google Scholar]
- Brichta AM, Goldberg JM. Morphological identification of physiologically characterized afferents innervating the turtle posterior crista. J Neurophysiol. 2000a;83:1202–1223. doi: 10.1152/jn.2000.83.3.1202. [DOI] [PubMed] [Google Scholar]
- Brichta AM, Goldberg JM. Responses to efferent activation and excitatory response-intensity relations of turtle posterior-crista afferents. J Neurophysiol. 2000b;83:1224–1242. doi: 10.1152/jn.2000.83.3.1224. [DOI] [PubMed] [Google Scholar]
- Brichta AM, Peterson EH. Functional architecture of vestibular primary afferents from the posterior semicircular canal of a turtle, Psedemys (Trachemys) scripta elegans. J Comp Neurol. 1994;344:481–507. doi: 10.1002/cne.903440402. [DOI] [PubMed] [Google Scholar]
- Catterall WA, Goldin AL, Waxman SG. International Union of Pharmacology. XLVII. Nomenclature and structure–function relationships of voltage-gated sodium channels. Pharmacol Rev. 2005;57:397–409. doi: 10.1124/pr.57.4.4. [DOI] [PubMed] [Google Scholar]
- Cavelier P, Hamann M, Rossi D, Mobbs P, Attwell D. Tonic excitation and inhibition of neurons: ambient transmitter sources and computational consequences. Prog Biophys Mol Biol. 2005;87:3–16. doi: 10.1016/j.pbiomolbio.2004.06.001. [DOI] [PMC free article] [PubMed] [Google Scholar]
- Chen JWY, Eatock RA. Major potassium conductance in type I hair cells from rat semicircular canals: characterization and modulation by nitric oxide. J Neurophysiol. 2000;84:139–151. doi: 10.1152/jn.2000.84.1.139. [DOI] [PubMed] [Google Scholar]
- Correia MJ, Lang DG. An electrophysiological comparison of solitary type I and type II vestibular hair cells. Neurosci Lett. 1990;116:106–111. doi: 10.1016/0304-3940(90)90394-o. [DOI] [PubMed] [Google Scholar]
- Cramér H. Mathematical Methods of Statistics. Princeton, NJ: Princeton Univ. Press; 1961. [Google Scholar]
- Crill WE. Persistent sodium current in mammalian central neurons. Annu Rev Physiol. 1996;58:349–362. doi: 10.1146/annurev.ph.58.030196.002025. [DOI] [PubMed] [Google Scholar]
- Danbolt NC. Glutamate uptake. Prog Neurobiol. 2001;65:1–105. doi: 10.1016/s0301-0082(00)00067-8. [DOI] [PubMed] [Google Scholar]
- Desai SS, Dhaliwal J, Lysakowski A. NOS immunochemical staining in calyces in chinchilla vestibular endorgans. Assoc Res Otolaryngol Abstr. 2004;853 [Google Scholar]
- Desai SS, Zeh C, Lysakowski A. Comparative morphology of rodent vestibular periphery. II. Cristae ampullares. J Neurophysiol. 2005;93:267–280. doi: 10.1152/jn.00747.2003. [DOI] [PMC free article] [PubMed] [Google Scholar]
- Dou H, Vazquez AE, Namkung Y, Chu H, Cardell EL, Nie L, Parson S, Shin HS, Yamoah EN. Null mutation of alpha1D Ca2+ channel gene results in deafness but no vestibular defect in mice. J Assoc Res Otolaryngol. 2004;5:215–226. doi: 10.1007/s10162-003-4020-3. [DOI] [PMC free article] [PubMed] [Google Scholar]
- Eatock RA, Lysakowski A. Mammalian vestibular hair cells. In: Eatock RA, Fay RR, Popper AN, editors. Vertebrate Hair Cells. Berlin: Springer-Verlag; 2006. pp. 348–442. [Google Scholar]
- Edmonds BW, Gregory FD, Schweizer FE. Evidence that fast exocytosis can be predominantly mediated by vesicles not docked at active zones in frog saccular hair cells. J Physiol. 2004;560:439–450. doi: 10.1113/jphysiol.2004.066035. [DOI] [PMC free article] [PubMed] [Google Scholar]
- Fayyazuddin A, Brichta AM, Art JJ. Organization of eighth nerve efferents in the turtle, Pseudemys scripta. Soc Neurosci Abstr. 1991;17:312. [Google Scholar]
- Fernández C, Baird RA, Goldberg JM. The vestibular nerve of the chinchilla. I. Peripheral innervation patterns in the horizontal and superior semicircular canals. J Neurophysiol. 1988;60:167–181. doi: 10.1152/jn.1988.60.1.167. [DOI] [PubMed] [Google Scholar]
- Fernández C, Lysakowski A, Goldberg JM. Hair-cell counts and afferent innervation patterns in the cristae ampullares of the squirrel monkey with a comparison to the chinchilla. J Neurophysiol. 1995;73:1253–1269. doi: 10.1152/jn.1995.73.3.1253. [DOI] [PubMed] [Google Scholar]
- Fesce R. Stochastic approaches to the study of synaptic function. Prog Neurobiol. 1990;35:85–133. doi: 10.1016/0301-0082(90)90019-d. [DOI] [PubMed] [Google Scholar]
- Fozzard HA, Hanck DA. Structure and function of voltage-dependent sodium channels: comparison of brain II and cardiac isoforms. Physiol Rev. 1996;76:887–926. doi: 10.1152/physrev.1996.76.3.887. [DOI] [PubMed] [Google Scholar]
- Glowatzki E, Fuchs PA. Transmitter release at the hair cell ribbon synapse. Nat Neurosci. 2002;5:147–154. doi: 10.1038/nn796. [DOI] [PubMed] [Google Scholar]
- Goldberg JM. Theoretical analysis of intercellular communication between the vestibular type I hair cell and its calyx ending. J Neurophysiol. 1996;76:1942–1957. doi: 10.1152/jn.1996.76.3.1942. [DOI] [PubMed] [Google Scholar]
- Goldberg JM. Afferent diversity and the organization of central vestibular pathways. Exp Brain Res. 2000;130:277–297. doi: 10.1007/s002210050033. [DOI] [PMC free article] [PubMed] [Google Scholar]
- Goldberg JM, Brichta AM. Functional analysis of whole cell currents from hair cells of the turtle posterior crista. J Neurophysiol. 2002;88:3279–3292. doi: 10.1152/jn.00771.2001. [DOI] [PubMed] [Google Scholar]
- Goldberg JM, Smith CE, Fernández C. Relation between discharge regularity and responses to externally applied galvanic currents in vestibular nerve afferents of the squirrel monkey. J Neurophysiol. 1984;51:1236–1256. doi: 10.1152/jn.1984.51.6.1236. [DOI] [PubMed] [Google Scholar]
- Gomez-Casati ME, Katz E, Glowatzki E, Lioudyno MI, Fuchs P, Elgoyhen AB. Linopirdine blocks alpha9alpha10-containing nicotinic cholinergic receptors of cochlear hair cells. J Assoc Res Otolaryngol. 2004;5:261–269. doi: 10.1007/s10162-004-4025-6. [DOI] [PMC free article] [PubMed] [Google Scholar]
- Gulley RL, Bagger-Sjoback D. Freeze-fracture studies on the synapse between the type I hair cell and the calyceal terminal in the guinea-pig vestibular system. J Neurocytol. 1979;8:591–603. doi: 10.1007/BF01208511. [DOI] [PubMed] [Google Scholar]
- Gundersen HJ. Stereology of arbitrary particles. A review of unbiased number and size estimators and the presentation of some new ones, in memory of William R. Thompson. J Microsc. 1986;143:3–45. [PubMed] [Google Scholar]
- Guth PS, Holt JC, Perin P, Athas G, Garcia M, Puri A, Zucca G, Botta L, Valli P. The metabotropic glutamate receptors of the vestibular organs. Hear Res. 1998;125:154–162. doi: 10.1016/s0378-5955(98)00145-2. [DOI] [PubMed] [Google Scholar]
- Haüsser M, Spruston N, Stuart GJ. Diversity and dynamics of dendrite signaling. Science. 2000;290:739–744. doi: 10.1126/science.290.5492.739. [DOI] [PubMed] [Google Scholar]
- Hedstrom KL, Rasband MN. Intrinsic and extrinsic determinants of ion channel localization in neurons. J Neurochem. 2006;98:1345–1352. doi: 10.1111/j.1471-4159.2006.04001.x. [DOI] [PubMed] [Google Scholar]
- Hendricson AW, Guth PS. Transmitter release from Rana pipiens vestibular hair cells via mGluRs: role for intracellular Ca(++) release. Hear Res. 2002;172:99–109. doi: 10.1016/s0378-5955(02)00519-1. [DOI] [PubMed] [Google Scholar]
- Hille B. Ion Channels of Excitable Membranes. 3. Sunderland, MA: Sinauer; 2001. p. 655. [Google Scholar]
- Ho E, Goldberg JM, Lysakowski A. Localization of the potassium-chloride cotransporters, KCC3 and KCC4, and the glutamate transporter, GLAST, in the peripheral vestibular epithelium. Assoc Res Otolaryngol Abstr. 2007;667 [Google Scholar]
- Holt JC, Lysakowski A, Goldberg JM. Mechanisms of efferent-mediated responses in the turtle posterior crista. J Neurosci. 2006a;26:13180–13193. doi: 10.1523/JNEUROSCI.3539-06.2006. [DOI] [PMC free article] [PubMed] [Google Scholar]
- Holt JC, Xue J-T, Brichta AM, Goldberg JM. Transmission between type II hair cells and bouton afferents in the turtle posterior crista. J Neurophysiol. 2006b;95:428–452. doi: 10.1152/jn.00447.2005. [DOI] [PubMed] [Google Scholar]
- Hullar TE, Della Santina CC, Hirvonen T, Lasker DM, Carey JP, Minor LB. Responses of irregularly discharging chinchilla semicircular canal vestibular-nerve afferents during high-frequency head rotations. J Neurophysiol. 2005;93:2777–2786. doi: 10.1152/jn.01002.2004. [DOI] [PubMed] [Google Scholar]
- Hurley KM, Gaboyard S, Zhong M, Price SD, Wooltorton JR, Lysakowski A, Eatock RA. M-like K+ currents in type I hair cells and calyx afferent endings of the developing rat utricle. J Neurosci. 2006;26:10253–10269. doi: 10.1523/JNEUROSCI.2596-06.2006. [DOI] [PMC free article] [PubMed] [Google Scholar]
- Ishiyama G, Lopez I, Ishiyama A. Subcellular immunolocalization of NMDA receptor subunit NR-1 in chinchilla vestibular periphery. Brain Res. 1999;851:270–276. doi: 10.1016/s0006-8993(99)02171-x. [DOI] [PubMed] [Google Scholar]
- Ishiyama G, Lopez I, Williamson R, Acuna D, Ishiyama A. Subcellular immunolocalization of NMDA receptor subunit NR1, 2A, 2B in the rat vestibular periphery. Brain Res. 2002;935:16–23. doi: 10.1016/s0006-8993(02)02419-8. [DOI] [PubMed] [Google Scholar]
- Jefferys JG. Nonsynaptic modulation of neuronal activity in the brain: electric currents and extracellular ions. Physiol Rev. 1995;75:689–723. doi: 10.1152/physrev.1995.75.4.689. [DOI] [PubMed] [Google Scholar]
- Keen EC, Hudspeth AJ. Transfer characteristics of the hair cell’s afferent synapse. Proc Natl Acad Sci USA. 2006;103:5537–5542. doi: 10.1073/pnas.0601103103. [DOI] [PMC free article] [PubMed] [Google Scholar]
- Kharkovets T, Hardelin J-P, Safieddine S, Schweizer M, El-Amraoui A, Petit C, Jentsch TJ. KCNQ4, a K+ channel mutated in a form of dominant deafness, is expressed in the inner ear and the central auditory pathway. Proc Natl Acad Sci USA. 2000;97:4333–4338. doi: 10.1073/pnas.97.8.4333. [DOI] [PMC free article] [PubMed] [Google Scholar]
- Lamas JA, Selyanko AA, Brown DA. Effects of a cognition-enhancer, linopirdine (DuP 996), on M-type potassium currents (IK(M)) and other voltage- and ligand-gated membrane currents in rat sympathetic neurons. Eur J Neurosci. 1997;9:605–616. doi: 10.1111/j.1460-9568.1997.tb01637.x. [DOI] [PubMed] [Google Scholar]
- Lewis ER, Leverenz EL, Bialek WS. The Vertebrate Inner Ear. Boca Raton, FL: CRC Press; 1985. p. 248. [Google Scholar]
- Lindeman HH. Studies on the morphology of the sensory regions of the vestibular apparatus. Ergeb Anat Entwicklungsgesch. 1969;42:1–113. [PubMed] [Google Scholar]
- Lopez I, Ishiyama G, Tang Y, Tokita J, Baloh RW, Ishiyama A. Regional estimates of hair cells and supporting cells in the human crista ampullaris. J Neurosci Res. 2005;82:421–431. doi: 10.1002/jnr.20652. [DOI] [PubMed] [Google Scholar]
- Lysakowski A. Synaptic organization of the crista ampullaris in vertebrates. Ann NY Acad Sci. 1996;781:164–182. doi: 10.1111/j.1749-6632.1996.tb15700.x. [DOI] [PubMed] [Google Scholar]
- Lysakowski A, Goldberg JM. A regional ultrastructural analysis of the cellular and synaptic architecture in the chinchilla cristae ampullares. J Comp Neurol. 1997;389:419–443. doi: 10.1002/(sici)1096-9861(19971222)389:3<419::aid-cne5>3.0.co;2-3. [DOI] [PMC free article] [PubMed] [Google Scholar]
- Lysakowski A, Goldberg JM. Morphophysiology of the vestibular periphery. In: Highstein SM, Popper A, Fay RR, editors. The Vestibular System. New York: Springer-Verlag; 2004. pp. 57–152. [Google Scholar]
- Lysakowski A, Goldberg JM. Are outer-face synapses needed for quantal synaptic transmission at the calyx ending? Assoc Res Otolaryngol Abstr. 2007;668 [Google Scholar]
- Lysakowski A, Minor LB, Fernández C, Goldberg JM. Physiological identification of morphologically distinct afferent classes innervating the cristae ampullares of the squirrel monkey. J Neurophysiol. 1995;73:1270–1281. doi: 10.1152/jn.1995.73.3.1270. [DOI] [PubMed] [Google Scholar]
- Lysakowski A, Price SD. Potassium channel localization in sensory epithelia of the rat inner ear. Assoc Res Otolaryngol Abstr. 2003;1534 [Google Scholar]
- Lysakowski A, Singer M. Nitric oxide synthase localized in a subpopulation of vestibular efferents with NADPH diaphorase histochemistry and nitric oxide synthase immunohistochemistry. J Comp Neurol. 2000;427:508–521. doi: 10.1002/1096-9861(20001127)427:4<508::aid-cne2>3.0.co;2-l. [DOI] [PMC free article] [PubMed] [Google Scholar]
- Matsubara A, Takumi Y, Nakagawa T, Usami S, Shinkawa H, Ottersen OP. Immunoelectron microscopy of AMPA receptor subunits reveals three types of putative glutamatergic synapse in the rat vestibular end organs. Brain Res. 1999;819:58–64. doi: 10.1016/s0006-8993(98)01345-6. [DOI] [PubMed] [Google Scholar]
- Merchant SN, Velazquez-Villasenor L, Tsuji K, Glynn RJ, Wall C, 3rd, Rauch SD. Temporal bone studies of the human peripheral vestibular system. Normative vestibular hair cell data. Ann Otol Rhinol Laryngol Suppl. 2000;181:3–13. doi: 10.1177/00034894001090s502. [DOI] [PubMed] [Google Scholar]
- Nagatomo T, Fan Z, Ye B, Tonkovich GS, January CT, Kyle JW, Makielski JC. Temperature dependence of early and late currents in human cardiac wild-type and long Q-T DeltaKPQ Na+ channels. Am J Physiol Heart Circ Physiol. 1998;275:H2016–H2024. doi: 10.1152/ajpheart.1998.275.6.H2016. [DOI] [PubMed] [Google Scholar]
- Neher E, Sakaba T. Combining deconvolution and fluctuation analysis to determine quantal parameters and release rates. J Neurosci Methods. 2003;130:143–157. doi: 10.1016/j.jneumeth.2003.09.020. [DOI] [PubMed] [Google Scholar]
- Ottersen OP, Takumi Y, Matsubara A, Landsend AS, Laake JH, Usami S. Molecular organization of a type of peripheral glutamate synapse: the afferent synapses of hair cells in the inner ear. Prog Neurobiol. 1998;54:127–148. doi: 10.1016/s0301-0082(97)00054-3. [DOI] [PubMed] [Google Scholar]
- Parsons TD, Lenzi D, Almers W, Roberts WM. Calcium-triggered exocytosis and endocytosis in an isolated presynaptic cell: capacitance measurements in saccular hair cells. Neuron. 1994;13:875–883. doi: 10.1016/0896-6273(94)90253-4. [DOI] [PubMed] [Google Scholar]
- Press WH, Teukolsky SA, Vettering WT, Flannery BP. Numerical Recipes in C. The Art of Scientific Computing. New York: Cambridge Univ. Press; 1992. [Google Scholar]
- Prigioni I, Russo G, Valli P, Masetto S. Pre- and postsynaptic excitatory action of glutamate agonists on frog vestibular receptors. Hear Res. 1990;46:253–259. doi: 10.1016/0378-5955(90)90006-b. [DOI] [PubMed] [Google Scholar]
- Rennie K. Modulation of the resting potassium current in type I vestibular hair cells by cGMP. In: Berlin CI, Hood LJ, Ricci A, editors. Hair Cell Micromechanics and Otoacoustic Emissions. Clifton Park, NY: Thomson Learning; 2002. [Google Scholar]
- Rennie K, Correia MJ. Potassium currents in mammalian and avian isolated type I semicircular canal hair cells. J Neurophysiol. 1994;71:317–329. doi: 10.1152/jn.1994.71.1.317. [DOI] [PubMed] [Google Scholar]
- Rennie KJ, Streeter MA. Voltage-dependent currents in isolated vestibular afferent calyx terminals. J Neurophysiol. 2006;95:26–32. doi: 10.1152/jn.00641.2005. [DOI] [PubMed] [Google Scholar]
- Rice SO. Mathematical analysis of random noise. Bell Sys Tech J. 1944;23:282–332. [Google Scholar]
- Robbins J. KCNQ potassium channels: physiology, pathophysiology, and pharmacology. Science. 2001;90:1–19. doi: 10.1016/s0163-7258(01)00116-4. [DOI] [PubMed] [Google Scholar]
- Rossi ML, Bonnifazzi C, Martini M, Fesce R. Static and dynamic properties of synaptic transmission at the cytoneural junction of frog labyrinth posterior canal. J Gen Physiol. 1989;94:303–327. doi: 10.1085/jgp.94.2.303. [DOI] [PMC free article] [PubMed] [Google Scholar]
- Rossi ML, Martini M, Pelucchi B, Fesce R. Quantal nature of synaptic transmission at the cytoneural junction in frog labyrinth. J Physiol. 1994;478:17–35. doi: 10.1113/jphysiol.1994.sp020227. [DOI] [PMC free article] [PubMed] [Google Scholar]
- Rüsch A, Eatock RA. Voltage responses of mouse utricular hair cells to injected current. Ann NY Acad Sci. 1996;781:71–84. doi: 10.1111/j.1749-6632.1996.tb15694.x. [DOI] [PubMed] [Google Scholar]
- Rush AM, Cummins TR, Waxman SG. Multiple sodium channels and their roles in electrogenesis within dorsal root ganglion neurons. J Physiol. 2007;579:1–14. doi: 10.1113/jphysiol.2006.121483. [DOI] [PMC free article] [PubMed] [Google Scholar]
- Salzer JL. Polarized domains of myelinated axons. Neuron. 2003;40:297–318. doi: 10.1016/s0896-6273(03)00628-7. [DOI] [PubMed] [Google Scholar]
- Satin J, Kyle JW, Chen M, Bell P, Cribbs LL, Fozzard HA, Rogart RB. A mutant of TTX-resistant cardiac sodium channels with TTX-sensitive properties. Science. 1992;256:1202–1205. doi: 10.1126/science.256.5060.1202. [DOI] [PubMed] [Google Scholar]
- Schessel DA, Ginzberg R, Highstein SM. Morphophysiology of synaptic transmission between type I hair cells and vestibular primary afferents. An intracellular study employing horseradish peroxidase in the lizard, Calotes versicolor. Brain Res. 1991;544:1–16. doi: 10.1016/0006-8993(91)90879-z. [DOI] [PubMed] [Google Scholar]
- Schnee ME, Brown BS. Selectivity of linopirdine (DuP 996), a neurotransmitter release enhancer, in blocking voltage-dependent and calcium-activated potassium currents in hippocampal neurons. J Pharmacol Exp Ther. 1998;286:709–717. [PubMed] [Google Scholar]
- Shi W, Wymore RS, Wang HS, Pan Z, Cohen IS, McKinnon D, Dixon JE. Identification of two nervous system-specific members of the erg potassium channel gene family. J Neurosci. 1997;17:9423–9432. doi: 10.1523/JNEUROSCI.17-24-09423.1997. [DOI] [PMC free article] [PubMed] [Google Scholar]
- Smith C, Goldberg JM. A stochastic after hyperpolarization model of repetitive activity in vestibular afferents. Biol Cybern. 1986;54:41–51. doi: 10.1007/BF00337114. [DOI] [PubMed] [Google Scholar]
- Valli P, Zucca G, Prigioni I, Botta L, Casella C, Guth PS. The effect of glutamate on the frog semicircular canal. Brain Res. 1985;330:1–9. doi: 10.1016/0006-8993(85)90002-2. [DOI] [PubMed] [Google Scholar]
- Vollrath MA, Eatock RA. Time course and extent of mechanotransducer adaptation in mouse utricular hair cells: comparison with frog saccular hair cells. J Neurophysiol. 2003;90:2676–2689. doi: 10.1152/jn.00893.2002. [DOI] [PubMed] [Google Scholar]
- Wang HS, Pan Z, Shi W, Brown BS, Wymore RS, Cohen IS, Dixon JE, McKinnon D. KCNQ2 and KCNQ3 potassium channel subunits: molecular correlates of the M-channel. Science. 1998;282:1890–1893. doi: 10.1126/science.282.5395.1890. [DOI] [PubMed] [Google Scholar]
- Wersäll J, Bagger-Sjöbäck D. Morphology of the vestibular sense organ. In: Kornhuber HH, editor. Handbook of Sensory Physiology, Vestibular System Basic Mechanisms. Berlin: Springer-Verlag; 1974. pp. 123–170. [Google Scholar]
- Wooltorton JR, Gaboyard S, Hurley KM, Price SD, Garcia JL, Zhong M, Lysakowski A, Eatock RA. Developmental changes in two voltage-dependent sodium currents in utricular hair cells. J Neurophysiol. 2007;97:1684–1704. doi: 10.1152/jn.00649.2006. [DOI] [PubMed] [Google Scholar]
- Yamashita M, Ohmori H. Synaptic responses to mechanical stimulation in calyceal and bouton type vestibular afferents studied in an isolated preparation of semicircular canal ampullae of chicken. Exp Brain Res. 1990;80:475–488. doi: 10.1007/BF00227989. [DOI] [PubMed] [Google Scholar]
- Yamashita M, Ohmori H. Synaptic bodies and vesicles in the calix type synapse of chicken semicircular canal ampullae. Neurosci Lett. 1991;129:43–46. doi: 10.1016/0304-3940(91)90716-7. [DOI] [PubMed] [Google Scholar]
Associated Data
This section collects any data citations, data availability statements, or supplementary materials included in this article.