

Abstract
Because no “gold standard” outcome measure or measures exist to allow comparison of pediatric stroke study outcomes in clinical trials, we designed a systematic review of the literature to survey the current use of pediatric stroke outcome measures. Studies that used at least one standardized measure to assess the outcome of children with ischemic or hemorrhagic stroke, ages full-term newborn to 18 years were included. Though 34 studies were included, an additional 36 studies could not be included because ad hoc, author-generated outcome measures were utilized. Excluding those measures in neuropsychological batteries, 38 unique outcome measures were used. The Wechsler Intelligence Scales, Pediatric Stroke Outcome Measure, and Bayley Scales of Infant Development were among the most used, but 79% of outcome measures were used by no more than two studies. Though many utilized measures have been validated for use in children with other medical conditions or for adults with stroke, only one measure has been specifically validated for use in pediatric ischemic stroke. To maximize comparability of future clinical trial results, agreement regarding a preferred pediatric stroke outcome scale or battery of measures is paramount; these measures should be reliable, responsive to change, and specifically validated for use in children with stroke.
Though pediatric stroke occurs in about 2–3 per 100,000 children, treatment is still largely based on low levels of evidence.1,2 Three sets of pediatric stroke guidelines exist, yet there are no clinical trials to inform treatment outside of sickle cell disease.3–5 More clinical trials aiming to improve pediatric stroke treatment are on the horizon yet no “gold standard” outcome measure is available to assess and compare the resulting outcomes.
Several institutions have recently highlighted the importance of validated, reliable outcome measures for patient-oriented research. The National Institutes of Health have begun investing in initiatives such as the Patient-Reported Outcomes Measurement System (PROMIS), which aims to develop tools to reliably and validly measure patient-reported outcomes in adults.6,7 Similarly, the goal of the common data element project at the National Institute for Neurological Disorders and Stroke is to standardize the collection of investigational data to facilitate comparison of results across studies and more effectively aggregate information into significant metadata sets.8
The aim of this systematic review is to assess the standardized outcome measures currently used in pediatric stroke studies, which will serve as a foundation for understanding the appropriate measures for clinical trials in this population.
Methods
Inclusion/Exclusion Criteria
Eligible studies included children from birth to 18 years of age with ischemic stroke, hemorrhagic stroke, or both, had > 5 subjects, and evaluated children for neurological or functional outcome status with a recognized outcome measure. Studies were excluded if the subjects were solely preterm infants, had purely intraventricular hemorrhage, or experienced stroke exclusively due to trauma. Studies with mixed study populations (e.g. term and preterm infants with stroke) were included only if data could be separated. Studies utilizing ad hoc or unrecognized outcome measures were excluded, as were reviews, non-English, non-human, and abstract-only studies.
Electronic Search Methodology
Electronic searches of CINAHL, Embase, PubMed, and Web of Science were performed in August 2010 using a combination of all relevant PubMed MeSH (Medical Subject Headings) terms and keywords relating to children, stroke, and outcomes measures. Identified studies were imported into a reference manager and duplicates of identical studies were removed.
Two raters agreed upon and independently applied inclusion and exclusion criteria to the studies in title, abstract, and full-text reviews. The reference lists of all included papers and of appropriate review articles were examined to identify additional relevant studies.
Study assessment
Study quality was assessed insofar as each study was screened for clear reporting of methods and data. Information on validity, reliability, as well as general and psychometric information on standardized outcome measures was retrieved from both the outcome measures' sources and original studies.
Statistics
Frequency of outcome measure use as well as information on validity and reliability were compiled. This study was designated exempt by the institutional review board.
Results
The initial search returned 2,996 unique studies, of which 30 were suitable for inclusion. Reasons for exclusion are detailed in Figure 1. Hand-searching found an additional four studies, resulting in 34 included studies. Of note, 36 studies were excluded because ad hoc, descriptive outcome measures were used rather than standardized measures. For example, many studies defined outcome solely by reporting neurological sequelae (e.g. hemiparesis, epilepsy, cognitive impairment, motor deficits), while others used subjective stratifications such as “mild”, “moderate”, or “severe” deficits.
Figure 1.

Study Search Flow Chart.
A detailed description of each included study with aim, sample size and characteristics, and outcome measures is provided in supplemental tables 1 and 2 (also available at http://kc.vanderbilt.edu/site/people/20692/jordan-lori.aspx). Of the 34 studies, 19 were focused on ischemic stroke only, five were focused on hemorrhagic stroke only, and ten included both types of stroke. Infants were exclusively the subjects of eight studies, eight studies included children > 1 year only, and 18 included both age groups. A median of two outcome measures were used per study (range 1–7). More than one outcome measure was used in 29 studies (85%).
The most commonly applied outcome measure was the age-appropriate form of the Wechsler Intelligence Scale (WIS), used in 34% of studies. Second-most prevalent was the Pediatric Stroke Outcome Measure (PSOM), utilized in seven studies (21%); more prevalence details are provided in Table 1. Notably, 24 of 38 outcome measures were used in one included study each (63%).
Table 1.
Most-Utilized Outcome Measures in Included Pediatric Stroke Studies
| Name | Description* | Age Range | Length | Stroke Validity? | Pediatric Validity? | Pediatric Stroke Validity? | Interrater Reliability | Used in N Studies |
|---|---|---|---|---|---|---|---|---|
| Bayley Scales of Infant and Toddler Development (BSID) |
Evaluates developmental delay in infants and pre-schoolers15 |
1–42 months15 |
30–90 min., age- dependent 15 |
No | Yes, concurrent16 |
No | ICC: 0.47– 0.96, scale- dependent15 |
6 |
| California Verbal Learning Test – Children's Version (CVLT-C) |
Assesses verbal learning and memory in children and adolescents15 |
5–16 years17 |
35–40 min 17 |
No | Yes, discriminant 17 |
No | n/a | 4 |
| Child Health Questionnaire (CHQ) |
Assesses a child's physical, emotional, and social well-being from the perspective of a parent/guardian or child. Can be administered by anyone18 |
5–18 years 19 |
10–25 min.19 |
No | Yes, discriminant 19 |
No | n/a | 2 |
| Denver Developmental Screening Tests |
Determines if a child's development is within the normal range. Can be administered by anyone20 |
<6 years21 | 20 min.22,23 | No | Yes, concurrent24 |
No | Kappa ≥ 0.7522 |
2 |
| Glasgow Outcome Scale (GOS) |
Global measure of outcome with five categories23 |
None specified |
5 min.25 | No | No | No | Weighted Kappa: 0.31– 0.7925 |
2 |
| Griffiths Scales of Mental Development |
Obtains level of mental development in infants and young children26 |
0–8 years27 | 50–60 min. 27 |
No | Yes, construct27 |
No | Overall Kappa >0.6028 |
3 |
| Modified Rankin Scale (mRS) |
Global measure that focuses on symptoms and disability after stroke27 |
Designed for > 60 years29 |
5 min.30 | Yes, construct29 |
No | No | Weighted Kappa statistic: 0.71– 0.9330 |
4 |
| Pediatric Stroke Outcome Measure (PSOM) |
Neurological assessment tool that measures right and left sensorimotor, language production and comprehension, and cognitive and behavioral performance30 |
0–18 years31 |
n/a | Yes, construct†31 |
Yes, construct‡31 |
Yes, construct‡31 |
91%‡31 | 7 |
| Short Form General Health Survey (SF-36) |
Generic measure that yields a holistic health profile. Can be administered by self, computer, or trained interviewer in person or via telephone31 |
≥ 14 years32 | 5–10 min.32 | n/a | n/a | n/a | n/a | 2 |
| Stanford-Binet Intelligence Scale |
Assesses intelligence and cognitive abilities in fluid reasoning, knowledge, quantitative processing, visual- spatial processing, and working memory32 |
≥ 2 years33 | 5 minutes per subtest33 |
No | Yes, concurrent33 |
No | IRR Coefficient Range: 0.74–0.9734 |
2 |
| Vineland Adaptive Behavior Scale (VABS) |
Assesses personal and social function via communication, daily living skills, socialization, and motor skills domains34 |
0–18 years, 35 |
20–60 min. 36 |
No | Yes, criterion35 |
No | IRR Coefficient Range: 0.62–0.7835 |
2 |
| Wechsler Intelligence Scales (WIS) |
Measures ability to adapt and constructively solve problems in the environment. Three scales: Preschool and Primary Scale of Intelligence (WPPSI-R; ages 4 – 6.5 years), WIS for Children (WISC; 6–16 years), and Adult Intelligence Scale (WAIS-III)35 |
4 years – adult37 |
60–90 min.37 |
No | Yes, concurrent38 |
No | n/a | 15 |
Unless otherwise stated, all tests administered by a psychologist or physician.
Validated for Arterial Ischemic Stroke (AIS) and Cerebral Venous Sinus Thrombosis (CVST) but not Intracerebral Hemorrhage (ICH)
From initial study. New deVeber manuscript in submission process: personal communication
Descriptions and psychometric properties of outcome measures utilized more than once are detailed in Table 1, with more detailed information and additional outcome measures provided in eTable 2. A standardized neurological examination, the PSOM, has been validated for infants and children with ischemic stroke. Of the twelve most-utilized outcome measures, nine (75%) have been validated in children. Interrater reliability data was variable both for specific outcome measures (e.g. The Glasgow Outcome Scale (GOS), ranging from 0.31–0.79 depending on the study) and across all outcome measures. Most tools are pediatric measures of cognitive ability (Children's Version of the California Verbal Learning Test; Griffiths; Stanford-Binet Intelligence Scale; Wechsler), development (Bayley Scales of Infant Development; Denver Developmental Screening Tests), or overall health (Child Health Questionnaire; GOS; modified Rankin Scale; Short Form-36; Vineland Adaptive Behavior Scales).
All included studies utilizing standardized outcome measures were conducted within the previous two decades. Figure 2A shows graphically that pediatric stroke studies using recognized outcome measures are increasingly prevalent in the literature. The temporal application of the most-used outcome measures, those used three or more times, is shown in Figure 2B, which demonstrates the increased use of a variety of outcome measures over time. Notably, use of the validated PSOM has increased.
Figure 2A.
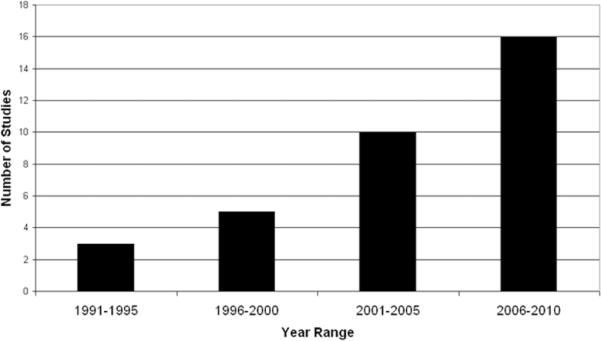
Number of Pediatric Stroke Studies Using Validated Outcome Measures.
Figure 2B.
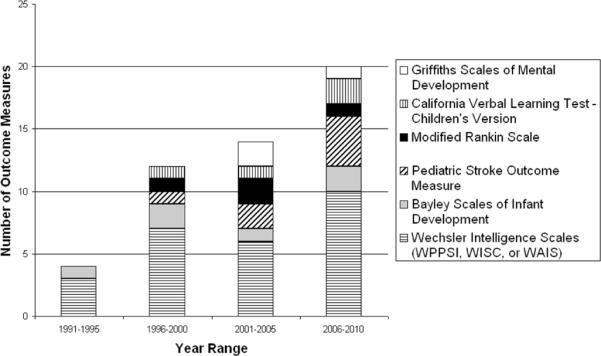
Most Utilized Outcome Measures Over Time.
Discussion
Currently, there are wide variations in the application of pediatric stroke outcome measures. At this time, the PSOM, a standardized neurological exam, is the best validated outcome measure with direct validation in children 0–18 years with ischemic stroke. Yet, in pediatric stroke there are many potential domains to assess, including but not limited to adaptive functioning, cognition, emotional health, behavior and quality of life. Preferably, overall health, cognitive development, and physical development would be assessed both objectively and subjectively, from the patient and/or caregiver's perspective.
Agreement amongst researchers, clinicians, and perhaps patients and their families regarding key outcome domains to measure is necessary prior to undertaking further validation and reliability studies for pediatric stroke outcome tools. We can learn much from other fields in this regard. For example, researchers in neuromuscular disease have pushed for outcome measures that are not only valid and reliable but also responsive to improvement or loss of function so as to capture clinically relevant change over time.9 Advanced statistical methods have also been employed to better use data from clinical trials in neurorehabilitation and multiple sclerosis.10
To chart the way forward in pediatric stroke, collaboration among pediatric stroke professionals, clinical trialists, and experts in statistics and clinimetrics is needed. There are many competing issues; for the purposes of clinical trials, investigators would prefer a single composite measure of global outcome such as the modified Rankin scale (mRS) used in adult stroke that does not require scoring by a physician or psychologist.11 A battery of measures is more costly and complex, but in theory would better capture function and disability after stroke in children. Finally, patient-reported outcomes have become increasingly important. PROMIS uses modern psychometric methods, including item response theory (IRT), to construct question banks that may be used to create computerized adaptive tests (CATs) to measure outcomes more efficiently and precisely. CATs use an algorithm whereby only the most informative items targeting an individual's functioning levels are selected, thus reducing the burden of traditional fixed-length questionnaires that may force patients to answer irrelevant items. IRT-based scales have interval level (linear) scaling for better interpretation of variation, calibration of items across a broad range to overcome floor/ceiling effects, and increased precision allowing more sensitivity to change.12 In traditional ordinal scale-based outcome measures such as the mRS, a 1 point change from 5 (severe disability) to 4 (moderately severe disability) is not the same “distance” as a 1 point change from slight to no disability, making change over time more difficult to interpret.9,10
While PROMIS has significant advantages, it is important to remember that in young children, patient reported outcomes are measured via parental responses or “proxy.” In studies of the most widely used pediatric quality of life measure, the PedsQL™ (see eTable 2), only moderate correlation was found between self and proxy-report in older children with parents consistently underestimating their child's health-related quality of life, perhaps due to anxiety. Better correlation was found in children with chronic health conditions (ranging from 0.5–0.61) and for physical rather than psychological and social proxy-reports.13,14 Given these concerns, patient-reported outcomes should not be the only outcomes in children. Particularly in young children who are difficult to assess, developmental measures may still be needed.
The creation of outcome assessment guidelines will facilitate appropriate outcome measure selection for future studies as well as communication and comparison of treatment results. If a “gold standard” pediatric stroke outcome assessment is not established, the comparability of pediatric stroke trial results will be undermined, potentially delaying the effective treatment of pediatric stroke patients for years to come.
Supplementary Material
Acknowledgments
Acknowledgements and Funding
The authors thank Victoria H. Goode, MLIS for assistance with the design and conduct of the study. Dr. Jordan is funded by NINDS K23NS062110. This funding agency had no role in design and conduct of the study; collection, management, analysis, and interpretation of the data; and preparation, review, or approval of the manuscript.
Footnotes
Disclosure: Dr. Jordan has served as a consultant for Berlin Heart.
Author Contributions: Dr. Jordan and Mr. Engelmann had full access to all the data in the study and take responsibility for the integrity of the data and the accuracy of the data analysis. Study concept and design: Jordan and Engelmann. Acquisition of data: Engelmann. Analysis and interpretation of data: Jordan and Engelmann. Drafting of the manuscript: Jordan and Engelmann. Critical revision of the manuscript for important intellectual content: Jordan and Engelmann. Statistical analysis: Jordan and Engelmann. Administrative, technical, and material support: Engelmann. Study supervision: Jordan.
References
- 1.Agrawal N, Johnston SC, Wu YW, Sidney S, Fullerton HJ. Imaging data reveal a higher pediatric stroke incidence than prior US estimates. Stroke. 2009;40(11):3415–3421. doi: 10.1161/STROKEAHA.109.564633. [DOI] [PMC free article] [PubMed] [Google Scholar]
- 2.Lynch JK, Hirtz DG, DeVeber G, Nelson KB. Report of the National Institute of Neurological Disorders and Stroke workshop on perinatal and childhood stroke. Pediatrics. 2002;109(1):116–123. doi: 10.1542/peds.109.1.116. [DOI] [PubMed] [Google Scholar]
- 3.Ganesan V. [Accessed February 21, 2011];Stroke and Neurovascular Disorders, Investigation and Management. http://www.gosh.nhs.uk/clinical_information/clinical_guidelines/cmg_guideline_00058. Updated 2009.
- 4.Monagle P, Chalmers E, Chan A, et al. Antithrombotic therapy in neonates and children: American College of Chest Physicians Evidence-Based Clinical Practice Guidelines (8th Edition) Chest. 2008;133(6 Suppl):887S–968S. doi: 10.1378/chest.08-0762. [DOI] [PubMed] [Google Scholar]
- 5.Roach ES, Golomb MR, Adams R, et al. Management of stroke in infants and children. Stroke. 2008;39(9):2644–2691. doi: 10.1161/STROKEAHA.108.189696. [DOI] [PubMed] [Google Scholar]
- 6. [Accessed February 21, 2011];Patient-Reported Outcomes Measurement Information System. http://www.nihpromis.org/default.aspx. Updated 2011.
- 7. [Accessed February 21, 2011];NIH Toolbox: Assessment of Neurological and Behavioral Function. http://www.nihtoolbox.org/default.aspx. Updated 2010.
- 8. [Accessed February 21, 2011];NINDS Common Data Elements. http://www.commondataelements.ninds.nih.gov/projreview.aspx. Updated 2010.
- 9.Merkies IS, Hughes RA. The measurement of disease. J Neurol Neurosurg Psychiatry. 2010;81(9):943. doi: 10.1136/jnnp.2010.206409. [DOI] [PubMed] [Google Scholar]
- 10.Hobart JC, Cano SJ, Thompson AJ. Effect sizes can be misleading: is it time to change the way we measure change? J Neurol Neurosurg Psychiatry. 2010;81(9):1044–1048. doi: 10.1136/jnnp.2009.201392. [DOI] [PubMed] [Google Scholar]
- 11.Saver JL, Filip B, Hamilton S, et al. Improving the reliability of stroke disability grading in clinical trials and clinical practice: the Rankin Focused Assessment (RFA) Stroke. 2010;41(5):992–995. doi: 10.1161/STROKEAHA.109.571364. [DOI] [PMC free article] [PubMed] [Google Scholar]
- 12.Thissen D, Varni JW, Stucky BD, Liu Y, Irwin DE, Dewalt DA. Using the PedsQL 3.0 asthma module to obtain scores comparable with those of the PROMIS pediatric asthma impact scale (PAIS) Qual Life Res. 2011 doi: 10.1007/s11136-011-9874-y. [DOI] [PMC free article] [PubMed] [Google Scholar]
- 13.Varni JW, Seid M, Kurtin PS. PedsQL 4.0: reliability and validity of the Pediatric Quality of Life Inventory version 4.0 generic core scales in healthy and patient populations. Med Care. 2001;39(8):800–812. doi: 10.1097/00005650-200108000-00006. [DOI] [PubMed] [Google Scholar]
- 14.Upton P, Eiser C, Cheung I, et al. Measurement properties of the UK-English version of the Pediatric Quality of Life Inventory 4.0 (PedsQL) generic core scales. Health Qual Life Outcomes. 2005;3:22. doi: 10.1186/1477-7525-3-22. [DOI] [PMC free article] [PubMed] [Google Scholar]
- 15. [Accessed March 11, 2011];Bayley Scales of Infant Development, Second Edition (BSID-II) http://www.acf.hhs.gov/programs/opre/ehs/perf_measures/reports/resources_measuring/res_meas_cdif.html.
- 16.Bayley N. Bayley Scales of Infant and Toddler Development, Third Edition (Bayley-III) [Accessed March 11, 2011];Pearson Assessment and Information Web site. http://www.pearsonassessments.com/HAIWEB/Cultures/en-us/Productdetail.htm?Pid=015-8027-23X. Updated 2005.
- 17.Delis DC, Kramer JH, Kaplan E, Ober BA. [Accessed March 11, 2011];California Verbal Learning Test - Children's Version (CVLT-C) http://www.pearsonassessments.com/HAIWEB/Cultures/enus/Productdetail.htm?Pid=015-8033-957. Updated 1994.
- 18.Jacobs ML, Donders J. Criterion validity of the California Verbal Learning Test-Second Edition (CVLT-II) after traumatic brain injury. Arch Clin Neuropsychol. 2007;22(2):143–149. doi: 10.1016/j.acn.2006.12.002. [DOI] [PubMed] [Google Scholar]
- 19. [Accessed March 11, 2011];CHQ: Child Health Questionnaire. http://www.healthact.com/survey-chq.php. Updated 2011.
- 20.Waters E, Salmon L, Wake M, Hesketh K, Wright M. The Child Health Questionnaire in Australia: reliability, validity, and population means. Aust N Z J Public Health. 2007;24(2):207. doi: 10.1111/j.1467-842x.2000.tb00145.x. [DOI] [PubMed] [Google Scholar]
- 21. [Accessed March 11, 2011];Benefits of the DENVER II. http://www.denverii.com/benefits.html. Updated 2010.
- 22.Frankenburg WK, Dodds JB. The Denver developmental screening test. J Pediatr. 1967;71(2):181–191. doi: 10.1016/s0022-3476(67)80070-2. [DOI] [PubMed] [Google Scholar]
- 23.Frankenburg WK, Dodds J, Archer P, Shapiro H, Bresnick B. The Denver II: a major revision and restandardization of the Denver Developmental Screening Test. Pediatrics. 1992;89(1):91–97. [PubMed] [Google Scholar]
- 24.Schonwald A. Screening Tools - Denver II. [Accessed March 11, 2011];Developmental Screening Tool Kit for Primary Care Providers Web site. http://www.developmentalscreening.org/screening_tools/denverii.htm. Updated 2007.
- 25.Jennett B, Bond M. Assessment of outcome after severe brain damage. Lancet. 1975;1(7905):480–484. doi: 10.1016/s0140-6736(75)92830-5. [DOI] [PubMed] [Google Scholar]
- 26.Anderson SI, Housley AM, Jones PA, Slattery J, Miller JD. Glasgow Outcome Scale: an inter-rater reliability study. Brain Inj. 1993;7(4):309–317. doi: 10.3109/02699059309034957. [DOI] [PubMed] [Google Scholar]
- 27.Smith JA, Bidder RT, Gardner SM, Gray OP. Griffiths Scales of Mental Development and different users. Child Care Health Dev. 1980;6(1):11–16. doi: 10.1111/j.1365-2214.1980.tb00792.x. [DOI] [PubMed] [Google Scholar]
- 28.Luiz DM, Foxcroft CD, Stewart R. The construct validity of the Griffiths Scales of Mental Development. Child Care Health Dev. 2001;27(1):73–83. doi: 10.1046/j.1365-2214.2001.00158.x. [DOI] [PubMed] [Google Scholar]
- 29.Rankin J. [Accessed March 11, 2011];Modified Rankin Scale. http://www.strokecenter.org/trials/scales/rankin.html.
- 30.Banks JL, Marotta CA. Outcomes validity and reliability of the modified Rankin scale: implications for stroke clinical trials: a literature review and synthesis. Stroke. 2007;38(3):1091–1096. doi: 10.1161/01.STR.0000258355.23810.c6. [DOI] [PubMed] [Google Scholar]
- 31.deVeber GA, MacGregor D, Curtis R, Mayank S. Neurologic outcome in survivors of childhood arterial ischemic stroke and sinovenous thrombosis. J Child Neurol. 2000;15(5):316–324. doi: 10.1177/088307380001500508. [DOI] [PubMed] [Google Scholar]
- 32.Ware JE. SF-36 Health Survey Update. [Accessed March 11, 2011];The SF Community Web site. http://www.sf36.org/tools/sf36.shtml.
- 33.Roid G. [Accessed March 11, 2011];Stanford-Binet Intelligence Scales, Fifth Edition (SB5) http://www.assess.nelson.com/test-ind/stan-b5.html. Updated 2003.
- 34.Roid G. [Accessed March/11, 2011];Stanford-Binet Intelligence Scale: 5th Edition (SB5) http://www.cps.nova.edu/~cpphelp/SB5.html.
- 35.Sparrow SS, Balla DA, Cicchetti DV. [Accessed March 11, 2011];Vineland Adaptive Behavior Scales. http://www.friendsnrc.org/joomdocs/vabs.pdf. Updated 1984.
- 36.Hurvitz E, Warschausky S, Berg M, Tsai S. Long-term functional outcome of pediatric stroke survivors. Top Stroke Rehabil. 2004;11(2):51–59. doi: 10.1310/CL09-U2QA-9M5A-ANG2. [DOI] [PubMed] [Google Scholar]
- 37. [Accessed March 11, 2011];The Wechsler Intelligence Scales. http://www.iupui.edu/~flip/wechsler.html.
- 38.Wechsler D. [Accessed March 11, 2011];Wechsler Intelligence Scale for Children - Fourth Edition (WISC-IV) http://www.pearsonassessments.com/HAIWEB/Cultures/en-us/Productdetail.htm?Pid=015-8979-044. Updated 2003.
Associated Data
This section collects any data citations, data availability statements, or supplementary materials included in this article.