

Abstract
Seven-transmembrane receptors (7TMRs) are involved in nearly all aspects of chemical communications and represent major drug targets. 7TMRs transmit their signals not only via heterotrimeric G proteins but also through β-arrestins, whose recruitment to the activated receptor is regulated by G protein-coupled receptor kinases (GRKs). In this paper, we combined experimental approaches with computational modeling to decipher the molecular mechanisms as well as the hidden dynamics governing extracellular signal-regulated kinase (ERK) activation by the angiotensin II type 1A receptor (AT1AR) in human embryonic kidney (HEK)293 cells. We built an abstracted ordinary differential equations (ODE)-based model that captured the available knowledge and experimental data. We inferred the unknown parameters by simultaneously fitting experimental data generated in both control and perturbed conditions. We demonstrate that, in addition to its well-established function in the desensitization of G-protein activation, GRK2 exerts a strong negative effect on β-arrestin-dependent signaling through its competition with GRK5 and 6 for receptor phosphorylation. Importantly, we experimentally confirmed the validity of this novel GRK2-dependent mechanism in both primary vascular smooth muscle cells naturally expressing the AT1AR, and HEK293 cells expressing other 7TMRs.
Keywords: β-arrestin, 7 transmembrane receptors, dynamical modeling, G protein, signal transduction
Introduction
Seven transmembrane receptors (7TMRs) regulate nearly every known physiologic processes in mammals. They represent the largest class of cell surface receptors and are the target of up to 40% of current pharmaceuticals (Ma and Zemmel, 2002). Signaling by 7TMRs is classically mediated by receptor coupling to heterotrimeric G proteins that activate a variety of effectors, including second messengers and the mitogen-activated protein kinase (MAPK) cascades (Reiter and Lefkowitz, 2006). G-protein coupling is rapidly hampered by a two step process, which begins with phosphorylation of the agonist-occupied receptor by G protein-coupled receptor kinases (GRKs; Lefkowitz, 1998). Cytoplasmic β-arrestins are subsequently recruited to the GRK-phosphorylated receptor and have key roles in both receptor desensitization and internalization (Goodman et al, 1996; Lefkowitz, 1998).
Beside this classical paradigm, a growing body of evidence has revealed that β-arrestins also serve as signal transducers and adaptors (Lefkowitz and Shenoy, 2005; Reiter and Lefkowitz, 2006). So far, the best-characterized signaling mechanism to be stimulated by β-arrestins is the extracellular signal-regulated kinase (ERK) signaling pathway. β-Arrestins have been shown to scaffold components of this MAPK cascade (i.e., Raf-1, MEK1 and ERK) in complexes with receptors, leading to activation of ERK (DeFea et al, 2000; Luttrell et al, 2001; Ahn et al, 2003). Inhibition of β-arrestin 2, using specific small interfering RNA (siRNA), impairs the angiotensin II type 1A receptor (AT1AR)-stimulated ERK signaling, while β-arrestin 1 depletion enhances AT1AR-mediated ERK activation (Ahn et al, 2004b). Spatial distribution of ERK activated by the G protein- and the β-arrestin-dependent mechanisms is distinct: the G protein-dependent pathway triggers the nuclear translocation of pERK while the β-arrestin 2-activated ERK is confined to the cytoplasm (DeFea et al, 2000; Luttrell et al, 2001; Ahn et al, 2004a). The two pathways also have distinct activation kinetics: the rapid and transient G protein-dependent activation and the slower but persistent β-arrestin 2-mediated activation (Ahn et al, 2004a). Interestingly, transient and sustained ERK activation have been shown to regulate cell fates such as growth and differentiation (Sasagawa et al, 2005). In addition, the β-arrestin 2-dependent ERK pathway can be activated independently of G proteins as shown using the (DRY/AAY) mutant of AT1AR or a modified angiotensin II peptide (SII) (Wei et al, 2003).
Noteworthy, different GRK subtypes have been shown to have specialized regulatory functions for the G protein and β-arrestin-dependent signaling mechanisms. Activation of the β-arrestin 2-dependent ERK pathway by the AT1AR (Kim et al, 2005), V2 vasopressin (Ren et al, 2005), β2 adrenergic (Shenoy et al, 2006) and follicle-stimulating hormone (FSHR) (Kara et al, 2006) receptors specifically requires GRK5 and GRK6 action. Second messenger generation by both V2 vasopressin (Ren et al, 2005) and H1 histamine (Iwata et al, 2005) receptors is negatively regulated by GRK2 but unaffected by GRK5 or 6.
A number of studies have provided mathematical models of ERK activation by EGF (Kholodenko et al, 1999; Orton et al, 2005; Borisov et al, 2009; Kholodenko et al, 2010), including the dynamics of transient and sustained ERK activation (Sasagawa et al, 2005; Nakakuki et al, 2010). ERK response to a G protein-coupled 7TMR in yeast and mammals (Hao et al, 2007; Csercsik et al, 2008) as well as the role of GRK in the desensitization, internalization and recycling of the β2 adrenergic receptor (β2AR) (Violin et al, 2008; Vayttaden et al, 2010) have also been modeled. In addition, a number of other studies have modeled different aspects of 7TMRs signaling, including calcium signaling (see Linderman, 2009 for a recent review). However, no mathematical model has been developed to address GRK-mediated regulation of ERK activation by a 7TMR. In this study, we used experimental and computational modeling approaches to decipher the molecular mechanisms governing ERK activation by the AT1AR in human embryonic kidney (HEK)293 cells.
Results
Construction of a minimal model for ERK activation by the AT1AR
Although some aspects of ERK activation by the AT1AR are understood, the mechanisms controlling the balance and distinct kinetic properties of the G protein- and β-arrestin-dependent pathways activating ERK remain largely unknown. To address this question, we have developed a deterministic dynamical model made of a system of ordinary differential equations (ODE). Previous attempts to consider all distinct biochemical species and interactions led to combinatorial complexity associated with a dramatic increase in the number of unknown parameters and, as a consequence, were impractical for dynamical simulation (Borisov et al, 2005; Hlavacek et al, 2006; Birtwistle et al, 2007). Therefore, we chose to construct a minimal model encompassing the G protein- and β-arrestin-dependent transduction mechanisms while keeping key molecules and experimentally measurable variables.
To build the structure of the model, we established and iteratively refined a simplified molecular interaction network capturing the available knowledge and experimental data. We generated an initial version of the minimal model amenable to numerical simulations and optimization of the unknown parameters by training with experimental data. Importantly, we found out that with the initial network structure, parameter estimation did not lead to simulations satisfyingly fitting experimental data. This was not surprising since, as is generally the case for biological systems, the knowledge available on the signaling network was incomplete and a number of competing hypotheses existed. We took advantage of this situation by exploring a variety of model structures to minimize discrepancies between the simulated model and the experimental data. The model structure was reassessed back and forth until a satisfactory solution was reached. Importantly, the main structural predictions that arose during this process were experimentally validated (see below). The final model resulting from this iterative process is a network of molecular interactions, which can be formally described either using a diagrammatic notation such as Systems Biology Graphical Notation (SBGN) (Figure 1; Kitano et al, 2005) or equivalently by a set of reaction rules written in the Systems Biology Markup Language (SBML) or in BIOCHAM syntax (Supplementary Figure S1).
Figure 1.
Model for ERK activation by AT1AR. Red-colored arrow indicates the starting point of the activation process (i.e., ligand binding to the receptor). Green-colored species correspond to experimental read-outs. Targeted experimental perturbations are indicated in red. Blue-colored reactions and species correspond to new features of the model as compared with classical views in GPCR transduction. Hypothesis made during the modeling process are numbered and circled in blue (1, co-existence of two distinct phosphorylated forms of the receptor, HRP1 and HRP2; 2, reversibility of β-arrestin-dependent ERK phosphorylation; 3, β-arrestin-dependent ERK phosphorylation undergoes enzymatic amplification; 4, non-phosphorylated ligand-bound receptor still has the ability to recruit β-arrestin 2 and to induce ERK phosphorylation; and 5, differential phosphorylation of the ligand-bound receptor by GRK2/3 versus GRK5/6 leading to HRP1 and HRP2). Cell Designer has been used to represent the topology of the network in Systems Biology Graphical Notation (SBGN). The following semantic is used: state transition ( ); proteins (
 ); active protein (
 ); simple molecule (
 ); receptor (
 ); catalysis (
 ); association (
 ); dissociation (
 ); phosphorylation (
 ); Boolean logic gate OR (
 ). Complexes are surrounded by a box.

For simplification purpose, only one cellular compartment (volume=1 pL) was considered. In addition, neither degradation nor synthesis of the different molecular species was taken into account, and we used mass action laws to model the dynamics of all reactions. This led to 11 kinetic reactions, depending on 26 kinetic rates (Supplementary Figure S2), and 7 conservation laws (Supplementary Figure S3).
Classical G-protein coupling
Signal transduction is initiated by hormone (i.e., angiotensin) binding to the receptor. At the angiotensin concentration used in our experiments (i.e., 100 nM), 99% of the receptor is ligand bound. Therefore, for simplification purpose, we aggregated the hormone binding process in a single variable called HR. The hormone-receptor complex then couples to heterotrimeric G protein, αq subunit is activated (G_a) by exchanging GDP with GTP and is subsequently released (Northup et al, 1980; Samama et al, 1993; Lefkowitz, 1998). Since this process is rapid, transient and dependent upon receptor activation, in the model we expressed the whole heterotrimeric G-protein activation/deactivation process as G being reversibly activated in G_a under the catalytic control of HR. GRK induces phosphorylation of the receptor thereby leading to the formation of phosphorylated receptor HRP1 (Lefkowitz, 1998). However, the phosphorylation only partially quenches G-protein activation (Benovic et al, 1987). Consequently, HRP1 also catalyzes G_a formation in the model. It is also well documented that 7TMRs induce G-protein activation constitutively (Samama et al, 1993). We took this process into account in the model by adding the activation of G into G_a in a parallel reaction independent of either HR or HRP1 catalysis.
Desensitization of G-protein activation and recycling of the receptor
Complete desensitization of G-protein activation is achieved upon β-arrestin binding to the GRK-phosphorylated receptor (Benovic et al, 1987; Lefkowitz, 1998). In the model, HRP1 interacts and forms a complex with either β-arrestin 1 (barr1) or β-arrestin 2 (barr2). Those two complexes are internalized; the receptor is then either degraded or dephosphorylated and recycled back at the plasma membrane (Lefkowitz and Whalen, 2004). As explained above, we did not consider synthesis/degradation in the model. The multiple dephosphorylation/recycling steps were shortened in one single irreversible reaction departing from each complex and providing barr1, barr2 and HR to the system.
G protein-dependent signaling to ERK
Once activated, Gαq protein induces a second messenger signaling cascade sequentially involving PLC activation, IP3 and DAG accumulation from PIP2, calcium release and PKC activation (Milligan and Kostenis, 2006). Since we were able to measure DAG accumulation and PKC activity, we included these variables in the model: all the reactions leading to DAG activation/synthesis are modeled as one reaction transforming PIP2 into DAG catalyzed by G_a (Figure 1). In turn, DAG catalyzes PKC activation in PKC_a. Both DAG accumulation and PKC activation have been shown to be deactivated through complex mechanisms (Newton, 1995), accordingly both reactions were made reversible in the model. Activated PKC triggers the activation of many downstream targets including Ras and the ERK MAPK signaling module: Raf, MEK, ERK (Wei et al, 2003; Luttrell and Gesty-Palmer, 2010). ERK phosphorylated through G protein-dependent mechanisms was noted GpERK in the model. Intermediate reaction was omitted in the model, and the whole process represented as one single reaction: PKC_a catalyzes GpERK formation from ERK. This reaction was made reversible to account for the activity of dual specificity ERK phosphatases (Dickinson and Keyse, 2006).
β-Arrestin-dependent signaling to ERK
β-Arrestin 2 contributes to ERK phosphorylation, independently of G proteins, through the formation of a multiprotein complex with the GRK-phosphorylated receptor, Raf and Mek (DeFea et al, 2000; Luttrell et al, 2001; DeWire et al, 2007). Since this mechanism is known to be differentially affected by GRK2/3 or GRK5/6 depletion (Kim et al, 2005), we made the assumption that the phosphorylated form of the receptor engaged into β-arrestin-dependent ERK phosphorylation was distinct from the desensitized form. In addition, β-arrestin 2 depletion has been reported to negatively impact β-arrestin-dependent ERK signaling while β-arrestin 1 removal leads to increased signaling by this pathway (Ahn et al, 2004b). Consistently, in the model, a distinct GRK-phosphorylated form of the receptor, HRP2, associates with β-arrestin 2 (barr2) to form the complex HRP2barr2 (Figure 1, hypothesis 1). HRP2barr2 then promotes the reversible formation of β-arrestin-dependent phosphorylated ERK (bpERK) from the cellular pool of ERK (here again Raf and MEK were omitted in the model). GpERK and bpERK were distinguished in the model since it is well documented that they exhibit distinct kinetics, subcellular localization and downstream targets (Ahn et al, 2004a; DeWire et al, 2007; Luttrell and Gesty-Palmer, 2010).
During the parameter optimization process (see below), we found that the β-arrestin-dependent pathway for ERK activation needed to be negatively regulated to fit the biological data. As shown in Supplementary Figure S4, when rate constants k17 (parameter 39 controlling HRP2 dephosphorylation), k24 (parameter 46 controlling HRP2barr2 dissociation) or k25 (parameter 47 controlling bpERK dephosphorylation) are set to 0, total pERK formation remains stable after reaching its maximum. In the experimental data, however, pERK formation clearly decreases between 5 and 90 min. As a consequence, we made the reaction leading to bpERK formation reversible (Figure 1, hypothesis 2). In addition, based on the actual quantities of receptors (0.08 μmol l−1; Ahn et al, 2004a; Kim et al, 2005) of β-arrestin 2 (0.483 μmol l−1; Ahn et al, 2004b) and of phosphorylated ERK (1.265 μmol l−1; Dupuy et al, 2009) measured in HEK293 cells, ERK phosphorylation within the β-arrestin scaffold could not work with a 1:1 stoichiometry. Therefore, we hypothesized the existence of an enzymatic amplification within the β-arrestin scaffold. Using a recently validated reverse phase protein array method (Dupuy et al, 2009), we were able to experimentally test this hypothesis. We measured the molar quantities of phosphorylated MEK and of phosphorylated ERK in the whole cell as well as within the β-arrestin 2 scaffold (i.e., cells treated with a PKC inhibitor (Ro-31-8425) to disrupt GpERK) (Supplementary Figure S5). In all cases, we found substantially more phosphorylated ERK than phosphorylated MEK (5- to 36-fold, depending on the conditions). With these data in hand, we switched from the equimolar scaffold representation to enzymatic catalysis of bpERK formation (Figure 1, hypothesis 3). Since it is well documented that ERK activated by the β-arrestin-dependent mechanism accumulates within cytosolic vesicles, which also contain the receptors and β-arrestins (Ahn et al, 2004a; DeWire et al, 2007), our current data suggest that ERK leave the β-arrestin scaffold once they are phosphorylated but remain trapped in the vesicles through a mechanism yet to be identified.
GRK-independent β-arrestin signaling
Although GRK phosphorylation is well known to significantly enhance β-arrestins’ affinity for the receptor (Lefkowitz, 1998), the main driving force for β-arrestin recruitment and activation is the agonist-induced transconformation of the receptor itself (Gurevich and Benovic, 1993; Lefkowitz and Shenoy, 2005). Moreover, DeWire et al (2007) have reported that AT1ARΔ324 with a truncated C-terminal tail is still capable of recruiting β-arrestins (albeit weakly) and inducing ERK phosphorylation in a β-arrestin-dependent manner. With that in mind, we made the assumption that β-arrestin 2 could be active even in the absence of GRK phosphorylation. We tested this hypothesis by comparing wild-type AT1AR (WT) with a mutant (13A) in which all the 13 serines and threonines present in the C-tail of the receptor were replaced by alanines (Figure 2A). When expressed in HEK293 cells at similar levels, the two receptors behaved differently. In control conditions, the 13A triggered significantly more ERK phosphorylation than the WT, which possibly reflects the lack of GRK-mediated desensitization (Figure 2B; Supplementary Figure S6). As expected, siRNA-mediated β-arrestin 2 knock-down led to a dramatic decrease in ERK phosphorylation by the WT, especially at late time points (Figure 2C; Supplementary Figure S6A and B). Importantly, using the 13A, β-arrestin 2 depletion also led to a significant inhibition of the late ERK response, strongly supporting our initial assumption that the non-phosphorylated receptor could still activate bpERK (Figure 2D; Supplementary Figure S6C). As a consequence, we added a reversible complexation reaction between HR and barr2 to form HRbarr2, which catalyzes bpERK formation (Figure 1, hypothesis 4).
Figure 2.

Role of the AT1AR C-tail phosphorylation in ERK activation. HEK293 cells were transfected with either WT or a mutant (13A) AT1AR. The indicated siRNAs were transfected simultaneously with the receptors. Values in graphs are expressed as percent of control (CTL) stimulated for 5 min with AngII (100 nM). (A) C-terminal sequence of the WT (Ser and Thr residues in blue) and 13A (mutated residues in red) AT1AR. (B) Time course of pERK response by WT versus 13A. (C, D) Effect of β-arrestin 2 depletion on pERK response by WT and 13A, respectively. (E, G) Effect of GRK2 depletion on pERK response by WT and 13A respectively. (F, H) Effect of GRK5 depletion on pERK response by WT and 13A, respectively. Mean±s.e.m. from at least four independent experiments with *P<0.05; **P<0.01; ***P<0.001 and NS, not significant, as compared with controls.
GRK isoforms act differentially at the receptor
Upon receptor activation, GRK2 and GRK3 are translocated to the plasma membrane where they form a complex with the free βγ subunits of heterotrimeric G protein, making these kinases’ activation dependent on G protein α/βγ subunit dissociation. On the other hand, GRK5 and GRK6 are constitutively bound to the plasma membrane and can therefore interact with and phosphorylate activated receptors independently of heterotrimeric G protein (Lefkowitz, 1998). Noteworthy, GRK2/3 and GRK5/6 have been shown to have specialized regulatory functions on signaling by various 7TMRs including the AT1AR: activation of the β-arrestin 2-dependent ERK pathway specifically requires GRK5 and GRK6 action while second messenger generation is negatively regulated by GRK2, but is unaffected by GRK5 or 6. In addition, GRK2 and GRK3 negatively impact on ERK phosphorylation (Kim et al, 2005; Ren et al, 2005; Gesty-Palmer et al, 2006; Kara et al, 2006). These four GRK isoforms have also been shown to participate in receptor phosphorylation, with GRK2 contributing the most (Iwata et al, 2005; Kim et al, 2005; Ren et al, 2005; Kara et al, 2006). However, it is not known from the literature whether GRKs regulate β-arrestin-dependent ERK activation by phosphorylating the activated receptor or whether they act on an unknown intermediate (Kim et al, 2005; Reiter and Lefkowitz, 2006). This question was central to the construction of our model, especially since our experimental data showed that β-arrestin signaling also occurs in the absence of receptor phosphorylation in the C-tail (Figure 2A–D). To sort out the two possibilities, we compared WT and 13A AT1AR for their sensitivity to siRNA-mediated GRK depletion. Supplementary Figure S7B–D shows representative results for siRNA-mediated depletion of the endogenous GRK2, 5 and 6, respectively. We reasoned that if GRKs acted on an intermediate, their depletion would impact ERK activation in cells expressing either the 13A or the WT AT1AR. On the contrary, if they acted by phosphorylating the receptor, then their depletion would have no effect on the 13A. As expected, GRK2 and GRK5 differentially regulated ERK response by the WT receptor (Figure 2E and F; Supplementary Figure S8A and B). In cells expressing the 13A, however, GRK2 depletion was unable to enhance ERK phosphorylation whereas GRK5 knock-down did not modify the ERK response (Figure 2G and H; Supplementary Figure S8C and D). This experiment allowed us to better delineate GRKs’ action and further supported the previously proposed concept of GRK2/3 and GRK5/6 phosphorylating distinct residue combinations on activated 7TMRs (Kim et al, 2005; Ren et al, 2005; Gesty-Palmer et al, 2006; Kara et al, 2006) (Figure 1, hypothesis 5). Since the available data (Kim et al, 2005) did not allow us to discriminate GRK2 from GRK3 or GRK5 from GRK6, we aggregated these kinases into two variables: GRK23 and GRK56 (Figure 1). In the model, HRP1 formation is catalyzed by GRK23 and HRP2 formation by GRK56 with HRP1 and HRP2 referring to receptor phosphorylated on different serine and/or threonine residue combinations.
Parameter estimation
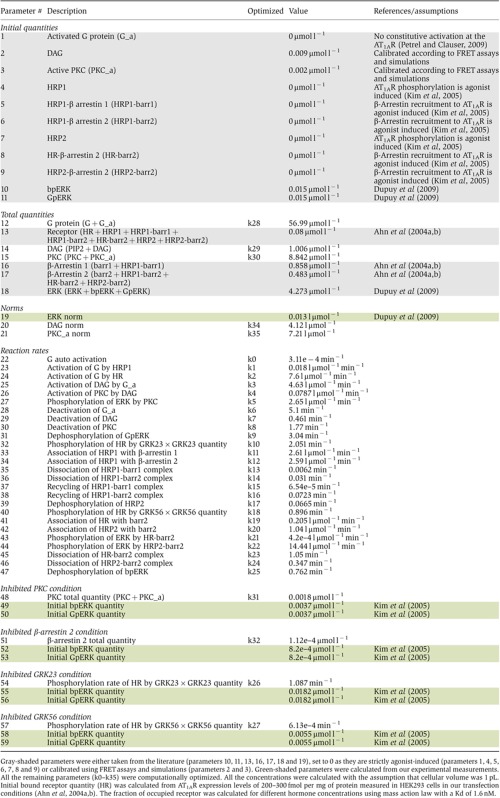
The model comprises a total of 59 parameters whose values had to be determined (Table I). Supplementary Figure S9 shows parameter numbers on the SBGN network representation. Among the 59 parameters, 16 (Table I, gray shaded) were either taken from the literature (parameters 10, 11, 13, 16, 17, 18 and 19), set to 0 because known to be strictly agonist-induced (parameters 1, 4, 5, 6, 7, 8 and 9) or calibrated using DAG and PKC activity FRET assays and preliminary simulations (parameters 2 and 3). In addition, initial quantities of bpERK and GpERK in the four perturbed conditions were calculated from the data set (Table I, green-shade, parameters 49, 50, 52, 53, 55, 56, 58 and 59) (Kim et al, 2005). As the remaining 35 parameters (i.e., k0 to k35) were experimentally unreachable, we optimized their value by training the model with experimental data according to a global optimization strategy (Supplementary Figure S10). To limit data heterogeneity, we only considered data collected in a unique cellular model (i.e., HEK293 cells). We used kinetic data on three variables of the model: (i) previously published angiotensin-induced ERK phosphorylation data (Kim et al, 2005), (ii) original DAG accumulation and (iii) PKC activity data that we measured in real time in AT1AR expressing HEK293 cells by using previously described FRET sensors (Violin et al, 2003). DAG and PKC data were available in control conditions (i.e., 90 min stimulation with 100 nM AngII) whereas ERK data were obtained in control as well as in four perturbed conditions (i.e., 90 min stimulation of cells depleted in β-arrestin 2, GRK2/3, GRK5/6 using siRNA as well as in cells treated with a PKC inhibitor. Since they were very close, the ERK data obtained in GRK2 and 3 or GRK5 and 6-depleted cells, respectively, were averaged.
Table 1. Parameters of the model (set 4).
|
The parameter optimization process was carried out in the Biochemical Abstract Machine (BIOCHAM) modeling environment (Calzone et al, 2006; Fages and Rizk, 2008). This software combines Quantifier-Free Linear Logic QFLTL(R) constraints (Rizk et al, 2008) with the Covariance Matrix Adaptation Evolution Strategy (CMA-ES), a previously validated non-linear optimization technique (Hansen and Ostermeier, 2001) to infer parameter values in high dimension. Out of 50 optimization runs, we identified 11 sets of parameter values that gave model simulations fitting with experimental data. Importantly, the initial parameter values used for each optimization were independent from the others as they were randomly chosen. To further discriminate between the parameter sets, we challenged them against published data sets that had not been used in the parameter estimation (see below). Out of the 11 parameter sets, only the 4 presenting the lowest global error (sets 1–4) were able to correctly simulate the additional data. Figure 3 shows a fit of the original data set with parameter set 4. The simulations were all within the error bars of the experimental data except for DAG between 15 and 40 min for which the simulations were not able to capture the observed rebound (Figure 3E). This problem could be due to either inappropriate model structure or experimental artifact. Further investigations will be necessary to discriminate between these two possibilities. Of note, the four sets of parameters led to very similar fits to the experimental data set (Supplementary Figure S11).
Figure 3.

Fitting of the model to the experimental data with the optimized parameter set 4. Experimental data are represented as point±s.e.m. (in black). All the curves were generated through model simulations. Data from (A–D) are from Kim et al (2005). Data from (E, F) were generated in living cells using FRET sensors for DAG and PKC activity, respectively, after stimulation with 100 nM AngII.
Parameters identifiability and sensitivity
We next compared the optimized values of each parameter across the four best parameter sets and determined their respective sensitivities. To address this question, the value of each individual parameter was scanned across 14 logs (from 10−9 to 105) and the impact on the global error (a function of the differences between simulated and observed values) was determined. When plotted against each other, these values provided a clear picture of each parameter’s identifiablity (as estimated by the convergence of the four independent optimization runs), and sensitivity/robustness. Interestingly, the parameter values showed a clear convergence (i.e., maximum 1 log difference across the four parameter sets) for 20 out of 35 of the optimized parameters (k2, k4, k5, k6, k8, k9, k10, k12, k17, k18, k19, k20, k22, k24, k25, k26, k28, k29, k30 and k34) when the four sets were compared (Figure 4; Supplementary Figure S12; Supplementary Table S1). In addition, two parameters (k3 and k16) were convergent for three parameter sets, the fourth one being tolerant (i.e., parameter values that do not significantly impact on the global behavior of the model). Five parameters (k7, k11, k13, k14 and k35) were convergent for three parameter sets. Finally, eight parameters (k0, k1, k15, k21, k23, k27, k31 and k32), even though not converging to a similar value, actually presented large and overlapping ranges of tolerance (Figure 4). Together, these data strongly suggest that our global optimization strategy led to the efficient identification of most parameters within the network. Parameter set 4 was used for figures but the four sets give very similar behavior in all envisaged situations.
Figure 4.

Comparison of four optimized parameter sets. The optimized value of each parameter is figured by a dark color line and compared side-by-side for the four parameter sets. The tolerance ranges (i.e., all the values of one parameter that induce less than a three-fold increase in the global error of the model) are figured by color-shaded bars. Set 1 is blue, set 2 is yellow, set 3 is red and set 4 is green. Parameters are numbered as presented in Table I.
Validation against independent experimental data sets
Using the same experimental design, Kim et al (2005) reported that GRK2 or 3 overexpression led to decreased ERK phosphorylation upon angiotensin stimulation. Remarkably, the observed pattern was reminiscent of the one obtained in GRK5- or 6-depleted cells. Oppositely, GRK5 or 6 overexpression caused an increase in phosphorylated ERK at all time points, similarly to what was observed in GRK2- or 3-depleted cells. When increases in GRK23 (Figure 5A) or GRK56 (Figure 5B) quantities were simulated, the model predicted phosphorylated ERK patterns which matched those reported in Figure 5 of Kim et al (2005).
Figure 5.

Model validation against published independent data sets. Control conditions are presented in blue; gradual increases or decreases (as indicated) of the targeted parameter are represented using different gradations of purple. (A) Simulation of GRK23 overexpression (GRK23 quantity multiplied by 2, 5 or 10). (B) Simulation of GRK56 overexpression (GRK56 quantity multiplied by 2, 5 and 10). (C) Inhibition of G-protein activation (total quantity of G protein divided by 2, 5 or set to 0). (D) Simulation of either β-arrestin 1 (red curve) or β-arrestin 2 (green curve) depletion on pERK response at 5 min as a function of angiotensin concentration.
Next, we took advantage of another interesting set of data generated in the same experimental conditions as those we have used (Ahn et al, 2004a). Using either a mutant version of AT1AR (DRY-AAY) or a biased ligand (SII), these authors showed that, in the absence of G-protein coupling, ERK was still triggered and displayed kinetics virtually identical to the ones obtained in cells treated with a PKC inhibitor. We therefore inhibited G proteins in the model (Figure 5C) and that resulted in simulated levels of phosphorylated ERK similar to PKC inhibition shown in Figure 3B and in perfect agreement with the data reported by Ahn et al (2004a) in their Figure 2.
Finally, another paper reported that, in the case of AT1AR, β-arrestin 1 acted as a dominant negative of β-arrestin 2 for ERK phosphorylation upon angiotensin stimulation (Ahn et al, 2004b). By simulating the effects of either β-arrestin 1 or β-arrestin 2 depletion on phosphorylated ERK response as a function of angiotensin concentration (Figure 5D), we also observed that a potentiating effect was triggered by β-arrestin 1 depletion albeit the amplitude of the effect was markedly weaker than the one observed experimentally in Figure 1C of Ahn et al (2004b). The opposite effect of β-arrestin 1 and 2 was more pronounced in simulations performed at 5 min with parameter set 3 (Supplementary Figure S13A) as well as at 10 and 30 min with parameter set 4 (Supplementary Figure S13C and D). It should be noted however that, in their experiments, Ahn et al analyzed ERK phosphorylation from cytosol-enriched extracts, predominantly containing β-arrestin-regulated phosphorylated ERK, rather than from whole cell lysates. Since the model simulates ERK phosphorylated in the whole cell, this might account for the observed difference in the kinetics.
Interestingly, our simulations provide quantitative estimations of the degrees of the different inhibition, depletion or overexpression tested (Table I; Supplementary Table S1). In particular, the values found for the perturbed parameters were dramatically diminished (>99% inhibition) in all cases except GRK23 for which the reduction was only about 50% of the control value (Table I, compare parameters 32 and 54). This result suggests that, unlike GRK5 and GRK6, GRK2 and GRK3 exert additive non-redundant effects on β-arrestin-induced ERK in vivo. We further assessed the model validity by doing a series of simulations using selected perturbations (e.g., Supplementary Figures S14, S15, S16 and S17). We found that the model generally behaved as expected, predicting activation/deactivation half-lives consistent with independent experimental measurements reported in the literature (Supplementary Table S2; Ahn et al, 2004a; Rajagopal et al, 2006; Violin et al, 2006; Lohse et al, 2008; Vilardaga, 2010; Poll et al, 2011). This further validates the model and the global optimization strategy we have used for its parameterization.
Pivotal role of GRK23 in the control of ERK activation by β-arrestin 2
Interestingly, we also made the unexpected finding that, in the absence of GRK23, the amount of HRP2 and HRP2barr2 nearly doubled, suggesting that bpERK might be substantially increased upon GRK23 depletion (Supplementary Figure S17A versus D). We then determined that when GRK23 was depleted, the model predicted an increase in both second messenger (DAG) (Figure 6A; Supplementary Figure S15) and total pERK (Figure 6C) compared with control conditions. The classical paradigm would have explained the increased ERK response as resulting from a lack of G-protein desensitization in the absence of GRK23. However, total pERK was minimally affected by PKC blockade when combined with GRK23 depletion. Simulations clearly predicted that the contribution of GpERK is decreased instead and that bpERK activation is massively amplified (Supplementary Figure S18). Importantly, these predictions were corroborated by experimental data. To reflect second messenger response, inositol uptake was measured in the presence of increasing concentrations of angiotensin. As in the simulation, second messenger accumulation was higher in GRK2-depleted cells than in control (Figure 6B). Moreover, we observed that ERK phosphorylation was strongly increased and that the PKC inhibitor had very limited effect in the absence of GRK2 (Figure 6D; Supplementary Figure S19). Although we were not able to achieve double GRK2 and GRK3 siRNA-mediated depletion experimentally, the experimental observations matched the model simulations with good accuracy.
Figure 6.

Role of GRK isoforms in regulating second messenger generation and subsequent ERK signaling by AT1AR. Simulations used the optimized parameter set with 0.1 μmol l−1 as the initial GRK23 quantity in GRK23-depleted condition. (A) DAG response at 10 min as a function of angiotensin in GRK2/3-depleted (purple) compared with control (blue). (B) Cells transfected with AT1AR and either control (blue) or GRK2 (purple) siRNAs. After 10 min of exposure to increasing angiotensin doses, inositol phosphate levels were measured. (C) Simulated pERK response at 5 min as a function of angiotensin concentration in control (blue), GRK2/3-depleted (purple), or GRK2/3-depleted and PKC-inhibited by Ro-31-8425 (black) conditions. (D) Cells were transfected with AT1AR and either control (blue) or GRK2 (purple and black) siRNAs. Serum-starved cells were pre-incubated with DMSO (blue and purple) or with Ro-31-8425 (Ro, black) and stimulated for 2 min with increasing doses of angiotensin. (E) Simulated pERK response at 2 min as a function of angiotensin concentration in either control (blue), GRK5/6-depleted (purple), PKC-inhibited (red) or GRK5/6-depleted and PKC-inhibited (green) conditions. (F, G) Cells were transfected with AT1AR and control (blue and red), GRK5 (F) or GRK6 (G) (purple and green) siRNAs. Serum-starved cells were pre-incubated with DMSO (blue and purple) or Ro-31-8425 (black and green) and stimulated for 2 min with increasing doses of angiotensin. Signals were normalized according to the amount of total ERK. Mean±s.e.m. from at least five independent experiments.
To explore the possibility that GRK23 exerts a strong negative effect on the β-arrestin-dependent pathway through its competition with GRK56 for receptor phosphorylation, we then simulated the combined effect of GRK56 depletion and PKC inhibition on ERK phosphorylation. At short stimulation time, GRK56 depletion had very little effect on the amount of ERK phosphorylation as compared with control conditions. However, PKC inhibition combined with GRK56 depletion led to complete abolition of ERK response whereas significant, albeit reduced, ERK response was predicted by the model in PKC inhibited control siRNA-transfected cells (Figure 6E). Again, these model simulations were closely corroborated by the experiments. We observed that ERK phosphorylation upon exposure to increasing doses of angiotensin was similar in control and GRK5- or GRK6-depleted cells. Moreover, the PKC inhibitor completely blocked ERK phosphorylation in GRK5- or GRK6-depleted cells while leading to only partial inhibition in control cells (Figure 6F and G; Supplementary Figure S20). These data clearly indicate that GRK5 or 6 depletion directs ERK signaling exclusively toward the G protein-dependent transduction mechanism. Interestingly, siRNA-mediated depletion of either GRK5 or 6 is sufficient to completely redirect the ERK signal. This suggests that the two kinases may have to phosphorylate the receptor on distinct residues (or combination of residues) to impart β-arrestin-mediated signaling competence to this receptor.
These data put forward the intriguing hypothesis that GRK2 might exert a strong negative effect on β-arrestin-dependent ERK activation. This suggests that this kinase, rather than being restricted to the desensitization of G-protein signaling as classically thought, might exert an equally important dampening action on β-arrestin signaling through its competition with GRK5 and 6 for receptor phosphorylation. To determine whether or not this mechanism exists in an authentic cell context, we used rat primary vascular smooth muscle cells (VSMCs) as a model. It had been previously shown that, in rat VSMC, ERK is phosphorylated upon angiotensin exposure through a bimodal mechanism involving PKC and β-arrestins similar to the one modeled in HEK293 cells (Ahn et al, 2009; Kim et al, 2009). Our data clearly demonstrate that, as observed in HEK293 cells, activation of endogenously expressed AT1AR in GRK2-depleted VSMC leads to a substantial increase in PKC-independent pERK (Figure 7A–C).
Figure 7.

Evidence for GRK2-mediated regulation of the balance between G protein and β-arrestin through endogenously expressed AT1AR in primary VSMCs and through four other GPCRs in HEK293 cells. (A) Depletion of endogenous GRK2 in control versus GRK2 siRNA-transfected VSMC. (B) Representative western blots of primary rat VSMC transiently transfected with either control (CTL) or GRK2 siRNAs. Serum-starved VSMC was pre-incubated with DMSO or with a PKC inhibitor (Gö6983 10 μM) and stimulated for the indicated time with angiotensin (1 μM). (C) Quantification of ERK phosphorylation kinetics in control versus GRK2-depleted VSMC pretreated with either DMSO or a PKC inhibitor. (D) Time course of ERK phosphorylation upon stimulation of endogenously expressed β2AR with isoproterenol (10 μM) in HEK293 cells transfected with CTL or GRK2 siRNA and pre-treated with DMSO or with a PKA inhibitor (H-89, 10 μM). (E) Time course of ERK phosphorylation upon stimulation of transiently transfected V2R with dvd-AVP (0.1 μM) in HEK293 cells co-transfected with CTL or GRK2 siRNA and pre-treated with DMSO or with a PKA inhibitor (H-89, 10 μM). (F) Time course of ERK phosphorylation upon stimulation of transiently transfected FSHR with FSH (3 nM) in HEK293 cells co-transfected with CTL or GRK2 siRNA and pre-treated with DMSO or with a PKA inhibitor (H-89, 10 μM). (G) Time course of ERK phosphorylation upon stimulation of transiently transfected NK1R with Substance P (0.1 μM) in cells co-transfected with CTL or GRK2 siRNA and pre-treated with DMSO or with a PKC inhibitor (Ro-31-8525, 1 μM). In all experiments, signals were normalized according to the amount of total ERK. Results are expressed as mean±s.e.m. from at least three independent experiments.
In addition, we provide evidence that a similar mechanism also operates with other 7TMRs. Indeed, the endogenously expressed β2AR, as well as overexpressed vasopressin V2 (V2R), FSHR and neurokinin 1 (NK1R) receptors all displayed, albeit to different extent, increased PKA or PKC-independent pERK in response to GRK2 depletion in HEK293 cells (Figure 7D–G; Supplementary Figure S21). Together, these data strongly support the notion that the GRK-regulated balance between G protein- and β-arrestin-dependent signaling that is highlighted here, is not restricted to AT1AR overexpressed in HEK293 cells. On the contrary, the uncovered mechanism likely applies to other 7TMRs and to physiologically relevant situations.
Discussion
Seven transmembrane receptor research is challenged with the question of how G protein- and β-arrestin-dependent transduction mechanisms coordinate their actions to activate common downstream signaling intermediates with distinct temporal and spatial patterns. In this study, we combined computational modeling and experiments to address this question using the well-documented dual ERK phosphorylation by AT1AR as a paradigm. We brought together previously published experimental data with our own new data and we assembled an original model inference and parameter optimization strategy to develop a dynamical model. We chose to build an abstracted model rather than a detailed mechanistic model encompassing all the molecular details because it had already been established that such an approach leads to combinatorial increase of complexity which cannot currently be computationally handled (Borisov et al, 2005; Hlavacek et al, 2006; Birtwistle et al, 2007). This model construction and analysis led to new insights into the regulation of ERK by the AT1AR.
A common limitation encountered when modeling intracellular signaling networks is that the number of measurable read-outs is very limited with respect to the number of molecular intermediates actually involved in the pathways to be modeled (Swameye et al, 2003; Raue et al, 2009). This raises problems of identifiability since many of the parameters have to be determined through an optimization process dependent on the available experimental data (Raue et al, 2009). Therefore, a limited number of read-outs implies a relative lack of constraint on the parameter optimization process, which in turn precludes the convergence of parameter sets separately optimized. In the present study, since we were limited to three read-outs (i.e., pERK, DAG and PKC), we had to approach the model identifiability problem in an innovative manner. We achieved a global fitting strategy that encompassed both control conditions and a number of targeted inhibitions within the network. We found out that, using this approach, the constraints on the parameter search were significantly higher. In addition to curve fitting, we took advantage of the capabilities of BIOCHAM to express in Linear Time Logic QFLTL(R) to combine a number of qualitative constraints further decreasing the degrees of freedom. Using this approach, starting from 50 independent sets of randomly chosen parameter values, we obtained four independent parameter sets that fitted the experimental data with very low error. Interestingly, the four parameter sets presented a high degree of convergence with most of the 35 optimized parameters being identifiable. The global optimization strategy validated in the present study allowed us to parameterize a model comprising 18 molecular species by actually measuring only three of them over time. In its principle, this global approach is versatile and could be adapted to many of the dynamical modeling needs that are encountered in systems biology.
As anticipated, having the ability to simulate a dynamical model proved to be very efficient to decipher our signaling system and its key regulatory features. However, we also realized that the model-building process itself was very insightful and led to important findings on the network structure. More specifically, we found out that the goodness of fit resulting from the parameter optimization process was a very efficient way to rank different network structures and to ultimately infer a model from prior knowledge and data. This is important since model inference remains a major challenge in systems biology (Nelander et al, 2008; Xu et al, 2010).
Besides AT1AR, a growing number of 7TMRs have been reported to activate ERK phosphorylation through dual G protein/β-arrestin-mediated transduction mechanisms, which share many attributes with the AT1AR-dependent signaling network modeled in this study (Kim et al, 2005; Gesty-Palmer et al, 2006; Kara et al, 2006; Shenoy et al, 2006; Luttrell and Gesty-Palmer, 2010). One aspect that seems to vary from one receptor to another is the role of β-arrestin 1. Some receptors require both β-arrestin isoforms to activate ERK while for others, including AT1AR, β-arrestin 1 antagonizes the action of β-arrestin 2 (Ahn et al, 2004a). Despite of this, we observed that one novel mechanism predicted by the model (i.e., GRK2-mediated inhibition of β-arrestin-dependent signaling) seems to apply to multiple 7TMRs (i.e., AT1AR, β2AR, V2R, FSHR and NK1R) and different cellular context (i.e., HEK293 versus primary VSMC). This supports the notion that our core model has a generic value, as it could predict a signaling mechanism used by other 7TMRs and/or in other cellular contexts. Of course, to achieve optimal results, the parameters would have to be optimized, on a case by case basis, using specific data sets.
The main feature revealed by our modeling approach is that ERK activation by AT1AR is tightly controlled by the antagonistic actions of the two GRK subfamilies, namely GRK2 and 3 on the one hand and GRK5 and 6 on the other. The model made the assumption that distinct phosphorylated forms of the receptor (i.e., HRP1 and HRP2) were formed as a consequence of GRK2/3- or GRK5/6-mediated actions. This assumption was supported by the indirect experimental evidence presented in Figure 2 as well as by reports from the literature. For instance, this idea is consistent with previous results showing that the presence or absence of serine and threonine clusters in the receptor C terminus regulates the affinity of β-arrestin recruitment and the pattern of intracellular trafficking for a wide number of 7TMRs (Oakley et al, 2000, 2001). It is also in agreement with the fact that different GRK subtypes differently regulate G protein- and β-arrestin-dependent signaling by various 7TMRs (Iwata et al, 2005; Kim et al, 2005; Ren et al, 2005; Kara et al, 2006; Shenoy et al, 2006). As the present study was carried out, three papers were published that strongly support the prediction of our model. A study revealed that the dynamically regulated site-specific phosphorylation of the CXCR4 by multiple kinases leads to both positive and negative regulation of CXCR4 signaling (Busillo et al, 2010). A separate study demonstrated that the M3-muscarinic receptor C terminus is preferentially phosphorylated on specific sites when stimulated with full versus partial agonists (Butcher et al, 2011). Finally, the detailed GRK-dependent phosphorylation ‘bar code’ occurring at the β2AR has been deciphered in another independent study (Nobles et al, 2011). Interestingly, six GRK2- and two GRK6-dependent non-overlapping sites were identified. Both GRK2- and GRK6-dependent sites contributed to desensitization and internalization. However, only GRK6-dependent sites were required for β-arrestin-mediated ERK activation. Remarkably, carvedilol, a previously characterized weak β-arrestin-biased ligand (Wisler et al, 2007), only induced phosphorylation on the GRK6 sites, whereas isoproterenol, a full agonist at the β2AR, triggered phosphorylation on both GRK2 and GRK6 sites. Importantly, phosphorylation on the GRK6 sites was increased in GRK2-depleted cells, providing direct experimental evidence for the existence of a competition between the two GRKs for receptor phosphorylation.
In addition, our simulations and experimental data suggest that these GRKs operate as the major control gate regulating ERK activation in time and space. In the absence of GRK5 or 6, there is virtually no β-arrestin-dependent ERK activation whereas, more surprisingly, in the absence of GRK2, β-arrestin-dependent ERK activation clearly overwhelms G protein-mediated ERK. In the absence of GRK action, both pathways co-exist but the potential for regulation is much reduced. This reveals a new and unexpected function of GRK2: beyond its well-documented role in G-protein desensitization, this kinase strongly dampens β-arrestin signaling. Eventually, it is the interplay between GRK2 and GRK5/6 that defines the duration and intensity of each transduction mechanism. We propose that GRKs endow ERK activation (and potentially other signaling pathways) by 7TMRs with adaptability. The balance in the action of both GRK subfamilies will vary with the receptor (i.e., different phosphorylation patterns present in the receptors’ C terminus), the cell type and the cellular context (i.e., differences in stoichiometries and subcellular localizations).
The fact that GRK2 on the one hand and GRK5 and 6 on the other are both required for the regulatory process to operate emphasizes the importance of tightly controlling the balance between the G protein- and the β-arrestin-dependent transduction mechanisms. Importantly, this is consistent with the mounting evidence that they both lead to distinct biological outcomes (DeWire et al, 2007; Luttrell and Gesty-Palmer, 2010).
Importantly, β-arrestin-dependent signaling is not limited to ERK activation. Instead, β-arrestins are now considered to be G protein-independent signal transducers acting as multifunctional scaffolds that interact with many protein partners (Xiao et al, 2007) and protein kinases, thereby leading to the phosphorylation of numerous intracellular targets (Christensen et al, 2010; Xiao et al, 2010). The model developed in the present study provides a robust core encompassing the proximal transduction events involving G proteins and β-arrestins as well as their regulatory mechanisms. We believe that our model could provide a solid core module that could accommodate the incorporation of additional G protein- and/or β-arrestin-dependent signaling cascades.
The concept of ‘biased agonism’ that has recently emerged in pharmacology defines another important application field for our model. In particular, one class of ‘biased ligands’ that has the ability to alter the balance between G protein-dependent and β-arrestin-dependent signal transduction engenders a lot of interest both in academia and in pharmaceutical industry (Reiter et al, 2012). In that context, a real added value of our model is that it provides a clear and rational mechanistic basis to this novel class of compounds. In that, the model proposed here represents a first step toward rational discovery of G protein and β-arrestin-biased drugs active at different 7TMRs. In particular, the model will help identify better suited methods allowing the screening and/or characterization of new biased compounds.
Materials and methods
Materials
Radiolabeled [125I] Tyr4-angiotensin II (AngII) was obtained from Perkin-Elmer Life Sciences (Boston, MA). PKC (Ro-31-8425 and Gö6983) and PKA (H89) inhibitors were purchased from Calbiochem (Darmstadt, Germany). GeneSilencer reagent was from Gene Therapy Systems (San Diego, CA). All other reagents were purchased from Sigma (St. Louis, MO). Expression plasmids encoding the rat hemagglutinin epitope-tagged (HA-) AT1AR (Wei et al, 2003), human FLAG-V2R (Ren et al, 2005), rat FLAG-FSH-R (Reiter et al, 2001) and human FLAG-NK1R have been used. All the 13 Ser and Thr residues present in the C-tail of the rat AT1AR have been mutated to alanine (13A) using the QuickChange site-directed mutagenesis kit (Stratagene, La Jolla, CA).
Synthesis of siRNAs
Chemically synthesized double-stranded siRNAs with 19 nt duplex RNA and 2 nt 3′ dTdT overhangs were purchased from Dharmacon (Lafayette, CO) or Xeragon (Germantown, MD) in deprotected and desalted form. The siRNA sequences used in the present study to target the different human β-arrestins and GRKs have been previously validated (Ahn et al, 2003; Kim et al, 2005; Ren et al, 2005; Kara et al, 2006): β-arrestin 1, 5′-AGCCUUCUGCGCGGAGAAU-3′ (positions 441–459 relative to the start codon); β-arrestin 2, 5′-GGACCGCAAAGUGUUUGUG-3′ (positions 150–168); GRK2, 5′-GAAGUACGAGAAGCUGGAG-3′ (positions 270–288); GRK 5, 5′-GCCGUGCAAAGAACUCUUU-3′ (positions 408–426); GRK6, 5′-CAGUAGGUUUGUAGUGAGC-3′ (positions 726–744). The siRNA sequence used to target rat GRK2 in VSMC cells was 5′-AAGAAAUAUGAGAAGCUGGAG-3′ (positions 270–288). A non-silencing RNA duplex (5′-UUCUCCGAACGUGUCACGU-3′) was used as a control.
Cell culture and RNA transfection
HEK293 cells were cultured in minimum Eagle’s medium supplemented with 10% fetal bovine serum and 1% penicillin/streptomycin. HEK293 cells were transiently transfected as described (Kim et al, 2005; Kara et al, 2006). Briefly, 30–40% confluent, slow growing early passage (<10) cells in 100 mm dishes were transfected simultaneously with 20 μg of siRNA and plasmid encoding the AT1AR (WT: 0.5 μg; 13A: 2.0 μg), V2R (1.0 μg), FSHR (1.0 μg) or NK1R (1.0 μg) using the GeneSilencer Transfection reagent (Gene Therapy System, San Diego, CA). Forty-eight hours after transfection, cells were divided into poly-D-lysine-coated 12-well plates (Becton Dickinson Labware, Bedford, MA) for receptor binding, or 12-well plates to prepare cell extracts. AT1AR expression was determined by radioligand binding assays, as described previously (Laporte et al, 1996), and was 300–600 fmol per mg of protein in all experiments. Expression levels of V2R, FSHR and NK1R in CTL versus GRK2 siRNA-transfected cells were monitored by ELISA using anti-FLAG antibody. In the GRK siRNA experiments, the amount of plasmid transfected was adjusted to obtain equivalent receptor levels at the plasma membrane as in the controls.
Rat VSMCs were prepared from aorta of male Sprague-Dawley rats by enzymatic digestion and maintained in DMEM supplemented with 1% glutamine, 10% fetal bovine serum and 1% penicillin-streptomycin as previously reported (Kim et al, 2009). In all, 80–90% confluent, slow growing early passage (<6) cells in 100 mm dishes were transfected with 20 μg of either control or rat GRK2 siRNA using 60 μl of Lipofectamine 2000 transfection reagent (Invitrogen, Carlsbad, CA). Forty-eight hours after transfection, cells were starved with media with 0.1% bovine serum albumin for least 24 h before stimulation (Ahn et al, 2009; Kim et al, 2009).
Preparation of cell extracts and immunoblotting
Three days after transfection, cells were starved for at least 6 h in serum-free medium before stimulation. After stimulation, cells were solubilized in 2 × SDS-sample buffer (pH 6.8), followed by sonication or boiling. Equivalent amounts of proteins were separated by SDS/PAGE on Tris·glycine polyacrylamide gels (Invitrogen), transferred onto nitrocellulose, and immunoblotted with rabbit polyclonal antibodies. The phospho (1:2000 dilution) and total (1:6000 dilution) ERK antibodies were from Cell Signaling Technology (Beverly, MA) and Upstate (Charlottesville, VA), respectively. Endogenous β-arrestins and GRKs were detected as described (Ahn et al, 2003; Kim et al, 2005). Chemiluminescent detection was performed using the SuperSignal West Pico or West Femto reagent (Pierce, Rockford, IL) and was quantified by densitometry with a Fluor-S MultiImager (Bio-Rad, Hercules, CA) or with ImageMaster 1D Elite version 4 software (Amersham Biosciences, Pittsburgh, PA).
FRET
HEK293 cells expressing the AT1AR (600 fmol per mg of protein) were transiently transfected with either DAG (DAGR) or PKC (CKAR) plasmid-encoded FRET sensors (Violin et al, 2003). Twenty-four hours after transfection, cells were split and seeded on imaging dishes (BD Biocoat, BD Biosciences, San Jose, CA, USA). Twenty-four hours later, cells were serum starved for 90 min and imaged in the dark on a 37°C temperature-controlled stage. Cells were imaged on a Leica DM IRBE (Leica Microsystems, Wetzlar, Germany) microscope with a CoolSnap fx cooled charge-coupled device camera (Roper Scientific, Ottobrunn, Germany) controlled by METAFLUOR 7.5 (Universal Imaging Corporation, Downingtown, PA). Dual emission ratio imaging used a 436DF10 excitation filter, a 436–510 DBDR dichroic mirror, and 480AF30 and 550AF30 emission filters for CFP and YFP, respectively. The filters were alternated by a Lambda 10-2 filter changer (Sutter Instruments, Novato, CA). Exposure time was 100–500 ms, and images were taken every 15 s. Typically, 15 sensor-positive cells and 5 non-specific areas were chosen in the field of the microscope. Baseline signals at the wavelength corresponding to YFP and CFP were recorded for 5 min before the hormone was added to the dish. Signals were recorded for the next 90 min. Fluorescent image background corrections were carried out by subtracting the intensity of non-specific areas. The FRET ratios were calculated for each individual cell. The mean values±s.e.m. corresponding to individual cells from three different plates were plotted.
RPPA
Serial dilutions of phosphorylated human recombinant ERK2 (Proteinkinase, Biaffin GmbH & Co KG, Germany) and of phosphorylated human recombinant MEK1 (Millipore, Billerica, MA) were prepared in RPPA lysis buffer. We previously determined that >99% of the purified pERK2 was indeed dually phosphorylated (Dupuy et al, 2009). In the case of pMEK1, based on the provider certificate of analysis, we made the assumption that 86.5% of the preparation was dually phosphorylated MEK1. For cell lysates (1.7 mg ml−1 concentration in average), three two-fold serial dilutions were done in RPPA lysis buffer. Samples were printed on nitrocellulose-coated slides (Fast Slides, Whatman, Maidstone, UK) using a 32-pin manual arrayer (Glass Slide Microarrayer, VP478, V&P Scientific, San Diego, CA), immunodetected and revealed in near infrared according to previously reported procedures (Dupuy et al, 2009). Anti-pERK (Cell Signaling Technology Inc., Beverly, MA; 1/400), anti-pMEK (Cell Signaling Technology Inc.; 1/300) and anti-ERK2 (Santa Cruz Biotechnology Inc., Santa Cruz, CA; 1/1000) antibodies were used. Finally, slides were air dried by centrifugation at 2500, r.p.m. for 25 min and scanned at 700 nm with an Odyssey IR imaging system (LI-COR Biosciences, Lincoln, NE) at a 42-μm resolution. Scanned images of arrays were analyzed with GenePix Pro 6.0 software (Molecular Devices, Sunnyvale, CA) as described (Dupuy et al, 2009).
Inositol phosphate determination
HEK293 cells expressing the AT1AR were transiently transfected in 100 mm dishes with siRNA targeted against the different GRK subtypes. Two days post transfection, cells were plated onto poly-D-lysine-coated 12-well plates (BD Biosciences Labware, San Jose, CA). To assay for inositol phosphate production, cells were incubated overnight at 37°C in labeling medium (2.5 μCi of myo-[3H] inositol in 0.5 ml of minimum Eagle’s medium with 10% fetal bovine serum/well). Cells were washed with Hank’s balanced salt solution containing 20 mM LiCl for 15 min at 37°C and then treated with agonist in Hank’s balanced salt solution for 10 min. The reactions were terminated by the addition of perchloric acid, and total inositol phosphates were isolated by anion-exchange chromatography on Dowex AG1-X8 columns as described previously (Cotecchia et al, 1992).
Statistical analysis
Statistical analysis of the data was performed with two-way analysis of variance to compare entire curves (GraphPad Software Inc., San Diego, CA).
Parameter optimization
For parameter estimation, we used a newly established parameter optimization approach combining quantifier-free linear time logic QFLTL(R) (Fages and Rizk, 2008; Rizk et al, 2009) for expressing qualitative constraints, with the covariance matrix adaptation evolution strategy CMA-ES (Hansen and Ostermeier, 2001) for non-linear optimization. The whole parameter optimization process was carried out in the BIOCHAM modeling environment (Calzone et al, 2006; Fages and Rizk, 2008). Fifty global optimizations were made each starting from a random set of parameters and therefore independent from each other. Eleven optimizations reached global errors <0.1. When challenged against the additional published data (Figure 5), only the four parameter sets presenting the lowest global errors led to simulations that matched with the experimental data. These four parameter sets were selected for further analysis (Supplementary Table S1). The ODE model and best parameter set are available from the Biomodels database under the ID: MODEL1012080000 ( http://www.ebi.ac.uk/biomodels/).
Additional constraints to the objective function
To infer the unknown (kinetic and quantitative) parameter values from the experimental data obtained under various conditions, we expressed the objective function to be minimized in temporal logic properties with quantifier free LTL(R) formulae (QFLTL(R); Rizk et al, 2008). This formalism allowed us to define, in addition to curve fitting, a number of constraints that were integrated to the objective function: (i) each parameter value had to be within 0 and 200; (ii) HRP2 recruited at least five times more barr2 than HR (parameter 42>5 × parameter 41); (iii) HRP1 recruited more barr1 than barr2 (parameter 33>parameter 34); (iv) inhibited parameter<control parameter (siRNA depletions of GRK23, GRK56 and barr2, PKC inhibition); (v) constant boundaries (as defined by standard deviations) imposed for DAG (between 5 and 35 min) and PKC (between 20 and 80 min) values instead of all the discrete time points; and (vi) basal levels of phosphorylated ERK were low (if HR=0, then 1%<GpERK+bpERK<6%).
Sensitivity analysis
We carried out a sensitivity analysis to test the robustness and the identifiability of each of the computationally optimized parameter across the four best parameter sets. The value of each individual parameter was scanned across 14 logs (from 10−9 to 105) and the impact on the global error of the fitting to the learning data set was determined. Variations of the global errors were then plotted as a function of each parameter’s value. To assess the convergence of the four independent optimization runs, the errors were normalized and compared on the same plot for each parameter. In addition, the relative ‘tolerance range’ was calculated for each parameter as being the range of a parameter value that increases the global error less than three-fold. These data were then compared for all the optimized parameters across the four parameter sets using box plots. Box plots present for each parameter the optimized value within its ‘tolerance range’.
Supplementary Material
Supplementary Figures S1–21, Supplementary Tables S1–2
Acknowledgments
We thank Drs WG Barnes for the 13A construct and N Hansen for helpful discussion and advices on the CMA-ES. GD was funded by a fellowship from the French MRT. This work was supported by the INRA AIP AgroBI, ‘Action d’envergure’ AE INRIA/INRA Regate and by ‘Agence Nationale de Recherche’ ANR-Blanc GPCRnet.
Author contributions: DH and GD contributed equally to this work. FC, FF and ER designed the study. DH, AP, FC and FF did the modeling and biological interpretations were done by PC and ER. AR, DH, AP and FF performed the parameter optimizations. DH and AP performed sensitivity analyses. SA, JK and RJL contributed to the generation and conceptualization of the biological data. GD, NG and ER did the experimental validation. CG and LD performed the reverse phase protein array analyses. VP and JDV contributed to the FRET experiments. DH and ER wrote the manuscript with inputs from the other authors.
Footnotes
The authors declare that they have no conflict of interest.
References
- Ahn S, Kim J, Hara MR, Ren XR, Lefkowitz RJ (2009) {beta}-Arrestin-2 mediates anti-apoptotic signaling through regulation of BAD phosphorylation. J Biol Chem 284: 8855–8865 [DOI] [PMC free article] [PubMed] [Google Scholar]
- Ahn S, Nelson CD, Garrison TR, Miller WE, Lefkowitz RJ (2003) Desensitization, internalization, and signaling functions of beta-arrestins demonstrated by RNA interference. Proc Natl Acad Sci USA 100: 1740–1744 [DOI] [PMC free article] [PubMed] [Google Scholar]
- Ahn S, Shenoy SK, Wei H, Lefkowitz RJ (2004a) Differential kinetic and spatial patterns of beta-arrestin and G protein-mediated ERK activation by the angiotensin II receptor. J Biol Chem 279: 35518–35525 [DOI] [PubMed] [Google Scholar]
- Ahn S, Wei H, Garrison TR, Lefkowitz RJ (2004b) Reciprocal regulation of angiotensin receptor-activated extracellular signal-regulated kinases by beta-arrestins 1 and 2. J Biol Chem 279: 7807–7811 [DOI] [PubMed] [Google Scholar]
- Benovic JL, Kuhn H, Weyand I, Codina J, Caron MG, Lefkowitz RJ (1987) Functional desensitization of the isolated beta-adrenergic receptor by the beta-adrenergic receptor kinase: potential role of an analog of the retinal protein arrestin (48-kDa protein). Proc Natl Acad Sci USA 84: 8879–8882 [DOI] [PMC free article] [PubMed] [Google Scholar]
- Birtwistle MR, Hatakeyama M, Yumoto N, Ogunnaike BA, Hoek JB, Kholodenko BN (2007) Ligand-dependent responses of the ErbB signaling network: experimental and modeling analyses. Mol Syst Biol 3: 144. [DOI] [PMC free article] [PubMed] [Google Scholar]
- Borisov N, Aksamitiene E, Kiyatkin A, Legewie S, Berkhout J, Maiwald T, Kaimachnikov NP, Timmer J, Hoek JB, Kholodenko BN (2009) Systems-level interactions between insulin-EGF networks amplify mitogenic signaling. Mol Syst Biol 5: 256. [DOI] [PMC free article] [PubMed] [Google Scholar]
- Borisov NM, Markevich NI, Hoek JB, Kholodenko BN (2005) Signaling through receptors and scaffolds: independent interactions reduce combinatorial complexity. Biophys J 89: 951–966 [DOI] [PMC free article] [PubMed] [Google Scholar]
- Busillo JM, Armando S, Sengupta R, Meucci O, Bouvier M, Benovic JL (2010) Site-specific phosphorylation of CXCR4 is dynamically regulated by multiple kinases and results in differential modulation of CXCR4 signaling. J Biol Chem 285: 7805–7817 [DOI] [PMC free article] [PubMed] [Google Scholar]
- Butcher AJ, Prihandoko R, Kong KC, McWilliams P, Edwards JM, Bottrill A, Mistry S, Tobin AB (2011) Differential G-protein coupled receptor phosphorylation provides evidence for a signalling barcode. J Biol Chem 286: 11506–11518 [DOI] [PMC free article] [PubMed] [Google Scholar]
- Calzone L, Fages F, Soliman S (2006) BIOCHAM: an environment for modeling biological systems and formalizing experimental knowledge. Bioinformatics 22: 1805–1807 [DOI] [PubMed] [Google Scholar]
- Christensen GL, Kelstrup CD, Lyngso C, Sarwar U, Bogebo R, Sheikh SP, Gammeltoft S, Olsen JV, Hansen JL (2010) Quantitative phosphoproteomics dissection of seven-transmembrane receptor signaling using full and biased agonists. Mol Cell Proteomics 9: 1540–1553 [DOI] [PMC free article] [PubMed] [Google Scholar]
- Cotecchia S, Ostrowski J, Kjelsberg MA, Caron MG, Lefkowitz RJ (1992) Discrete amino acid sequences of the alpha 1-adrenergic receptor determine the selectivity of coupling to phosphatidylinositol hydrolysis. J Biol Chem 267: 1633–1639 [PubMed] [Google Scholar]
- Csercsik D, Hangos KM, Nagy GM (2008) A simple reaction kinetic model of rapid (G protein dependent) and slow (beta-Arrestin dependent) transmission. J Theor Biol 255: 119–128 [DOI] [PubMed] [Google Scholar]
- DeFea KA, Vaughn ZD, O'Bryan EM, Nishijima D, Dery O, Bunnett NW (2000) The proliferative and antiapoptotic effects of substance P are facilitated by formation of a beta -arrestin-dependent scaffolding complex. Proc Natl Acad Sci USA 97: 11086–11091 [DOI] [PMC free article] [PubMed] [Google Scholar]
- DeWire SM, Ahn S, Lefkowitz RJ, Shenoy SK (2007) Beta-arrestins and cell signaling. Annu Rev Physiol 69: 483–510 [DOI] [PubMed] [Google Scholar]
- Dickinson RJ, Keyse SM (2006) Diverse physiological functions for dual-specificity MAP kinase phosphatases. J Cell Sci 119: 4607–4615 [DOI] [PubMed] [Google Scholar]
- Dupuy L, Gauthier C, Durand G, Musnier A, Heitzler D, Herledan A, Sakanyan V, Crepieux P, Reiter E (2009) A highly sensitive near-infrared fluorescent detection method to analyze signalling pathways by reverse-phase protein array. Proteomics 9: 5446–5454 [DOI] [PubMed] [Google Scholar]
- Fages F, Rizk A (2008) On temporal logic constraint solving for the analysis of numerical data time series. Theor Comp Sci 408: 55–65 [Google Scholar]
- Gesty-Palmer D, Chen M, Reiter E, Ahn S, Nelson CD, Wang S, Eckhardt AE, Cowan CL, Spurney RF, Luttrell LM, Lefkowitz RJ (2006) Distinct beta-arrestin- and G protein-dependent pathways for parathyroid hormone receptor-stimulated ERK1/2 activation. J Biol Chem 281: 10856–10864 [DOI] [PubMed] [Google Scholar]
- Goodman OB Jr., Krupnick JG, Santini F, Gurevich VV, Penn RB, Gagnon AW, Keen JH, Benovic JL (1996) Beta-arrestin acts as a clathrin adaptor in endocytosis of the beta2-adrenergic receptor. Nature 383: 447–450 [DOI] [PubMed] [Google Scholar]
- Gurevich VV, Benovic JL (1993) Visual arrestin interaction with rhodopsin. Sequential multisite binding ensures strict selectivity toward light-activated phosphorylated rhodopsin. J Biol Chem 268: 11628–11638 [PubMed] [Google Scholar]
- Hansen N, Ostermeier A (2001) Completely derandomized self-adaptation in evolution strategies. Evol Comput 9: 159–195 [DOI] [PubMed] [Google Scholar]
- Hao N, Behar M, Elston TC, Dohlman HG (2007) Systems biology analysis of G protein and MAP kinase signaling in yeast. Oncogene 26: 3254–3266 [DOI] [PubMed] [Google Scholar]
- Hlavacek WS, Faeder JR, Blinov ML, Posner RG, Hucka M, Fontana W (2006) Rules for modeling signal-transduction systems. Sci STKE 2006: re6. [DOI] [PubMed] [Google Scholar]
- Iwata K, Luo J, Penn RB, Benovic JL (2005) Bimodal regulation of the human H1 histamine receptor by G protein-coupled receptor kinase 2. J Biol Chem 280: 2197–2204 [DOI] [PubMed] [Google Scholar]
- Kara E, Crepieux P, Gauthier C, Martinat N, Piketty V, Guillou F, Reiter E (2006) A phosphorylation cluster of five serine and threonine residues in the C-terminus of the follicle-stimulating hormone receptor is important for desensitization but not for beta-arrestin-mediated ERK activation. Mol Endocrinol 20: 3014–3026 [DOI] [PubMed] [Google Scholar]
- Kholodenko BN, Demin OV, Moehren G, Hoek JB (1999) Quantification of short term signaling by the epidermal growth factor receptor. J Biol Chem 274: 30169–30181 [DOI] [PubMed] [Google Scholar]
- Kholodenko BN, Hancock JF, Kolch W (2010) Signalling ballet in space and time. Nat Rev Mol Cell Biol 11: 414–426 [DOI] [PMC free article] [PubMed] [Google Scholar]
- Kim J, Ahn S, Rajagopal K, Lefkowitz RJ (2009) Independent beta-arrestin2 and Gq/protein kinase Czeta pathways for ERK stimulated by angiotensin type 1A receptors in vascular smooth muscle cells converge on transactivation of the epidermal growth factor receptor. J Biol Chem 284: 11953–11962 [DOI] [PMC free article] [PubMed] [Google Scholar]
- Kim J, Ahn S, Ren XR, Whalen EJ, Reiter E, Wei H, Lefkowitz RJ (2005) Functional antagonism of different G protein-coupled receptor kinases for {beta}-arrestin-mediated angiotensin II receptor signaling. Proc Natl Acad Sci USA 102: 1442–1447 [DOI] [PMC free article] [PubMed] [Google Scholar]
- Kitano H, Funahashi A, Matsuoka Y, Oda K (2005) Using process diagrams for the graphical representation of biological networks. Nat Biotechnol 23: 961–966 [DOI] [PubMed] [Google Scholar]
- Laporte SA, Servant G, Richard DE, Escher E, Guillemette G, Leduc R (1996) The tyrosine within the NPXnY motif of the human angiotensin II type 1 receptor is involved in mediating signal transduction but is not essential for internalization. Mol Pharmacol 49: 89–95 [PubMed] [Google Scholar]
- Lefkowitz RJ (1998) G protein-coupled receptors. III. New roles for receptor kinases and beta-arrestins in receptor signaling and desensitization. J Biol Chem 273: 18677–18680 [DOI] [PubMed] [Google Scholar]
- Lefkowitz RJ, Shenoy SK (2005) Transduction of receptor signals by beta-arrestins. Science 308: 512–517 [DOI] [PubMed] [Google Scholar]
- Lefkowitz RJ, Whalen EJ (2004) Beta-arrestins: traffic cops of cell signaling. Curr Opin Cell Biol 16: 162–168 [DOI] [PubMed] [Google Scholar]
- Linderman JJ (2009) Modeling of G-protein-coupled receptor signaling pathways. J Biol Chem 284: 5427–5431 [DOI] [PubMed] [Google Scholar]
- Lohse MJ, Nikolaev VO, Hein P, Hoffmann C, Vilardaga JP, Bunemann M (2008) Optical techniques to analyze real-time activation and signaling of G-protein-coupled receptors. Trends Pharmacol Sci 29: 159–165 [DOI] [PubMed] [Google Scholar]
- Luttrell LM, Gesty-Palmer D (2010) Beyond desensitization: physiological relevance of arrestin-dependent signaling. Pharmacol Rev 62: 305–330 [DOI] [PMC free article] [PubMed] [Google Scholar]
- Luttrell LM, Roudabush FL, Choy EW, Miller WE, Field ME, Pierce KL, Lefkowitz RJ (2001) Activation and targeting of extracellular signal-regulated kinases by beta-arrestin scaffolds. Proc Natl Acad Sci USA 98: 2449–2454 [DOI] [PMC free article] [PubMed] [Google Scholar]
- Ma P, Zemmel R (2002) Value of novelty? Nat Rev Drug Discov 1: 571–572 [DOI] [PubMed] [Google Scholar]
- Milligan G, Kostenis E (2006) Heterotrimeric G-proteins: a short history. Br J Pharmacol 147: Suppl 1S46–S55 [DOI] [PMC free article] [PubMed] [Google Scholar]
- Nakakuki T, Birtwistle MR, Saeki Y, Yumoto N, Ide K, Nagashima T, Brusch L, Ogunnaike BA, Okada-Hatakeyama M, Kholodenko BN (2010) Ligand-specific c-Fos expression emerges from the spatiotemporal control of ErbB network dynamics. Cell 141: 884–896 [DOI] [PMC free article] [PubMed] [Google Scholar]
- Nelander S, Wang W, Nilsson B, She QB, Pratilas C, Rosen N, Gennemark P, Sander C (2008) Models from experiments: combinatorial drug perturbations of cancer cells. Mol Syst Biol 4: 216. [DOI] [PMC free article] [PubMed] [Google Scholar]
- Newton AC (1995) Protein kinase C: structure, function, and regulation. J Biol Chem 270: 28495–28498 [DOI] [PubMed] [Google Scholar]
- Nobles KN, Xiao K, Ahn S, Shukla AK, Lam CM, Rajagopal S, Strachan RT, Bressler EA, Hara MR, Shenoy SK, Gygi SP, Lefkowitz RJ (2011) Distinct GRK phosphorylation sites on the β2-adrenergic receptor: a “bar code” which differentially encodes β-arrestin functions. Science signaling 4: ra51. [DOI] [PMC free article] [PubMed] [Google Scholar]
- Northup JK, Sternweis PC, Smigel MD, Schleifer LS, Ross EM, Gilman AG (1980) Purification of the regulatory component of adenylate cyclase. Proc Natl Acad Sci USA 77: 6516–6520 [DOI] [PMC free article] [PubMed] [Google Scholar]
- Oakley RH, Laporte SA, Holt JA, Barak LS, Caron MG (2001) Molecular determinants underlying the formation of stable intracellular G protein-coupled receptor-beta-arrestin complexes after receptor endocytosis*. J Biol Chem 276: 19452–19460 [DOI] [PubMed] [Google Scholar]
- Oakley RH, Laporte SA, Holt JA, Caron MG, Barak LS (2000) Differential affinities of visual arrestin, beta arrestin1, and beta arrestin2 for G protein-coupled receptors delineate two major classes of receptors. J Biol Chem 275: 17201–17210 [DOI] [PubMed] [Google Scholar]
- Orton RJ, Sturm OE, Vyshemirsky V, Calder M, Gilbert DR, Kolch W (2005) Computational modelling of the receptor-tyrosine-kinase-activated MAPK pathway. Biochem J 392: 249–261 [DOI] [PMC free article] [PubMed] [Google Scholar]
- Petrel C, Clauser E (2009) Angiotensin II AT1 receptor constitutive activation: from molecular mechanisms to pathophysiology. Mol Cell Endocrinol 302: 176–184 [DOI] [PubMed] [Google Scholar]
- Poll F, Doll C, Schulz S (2011) Rapid dephosphorylation of G protein-coupled receptors by protein phosphatase 1beta is required for termination of beta-arrestin-dependent signaling. J Biol Chem 286: 32931–32936 [DOI] [PMC free article] [PubMed] [Google Scholar]
- Rajagopal K, Whalen EJ, Violin JD, Stiber JA, Rosenberg PB, Premont RT, Coffman TM, Rockman HA, Lefkowitz RJ (2006) Beta-arrestin2-mediated inotropic effects of the angiotensin II type 1A receptor in isolated cardiac myocytes. Proc Natl Acad Sci USA 103: 16284–16289 [DOI] [PMC free article] [PubMed] [Google Scholar]
- Raue A, Kreutz C, Maiwald T, Bachmann J, Schilling M, Klingmuller U, Timmer J (2009) Structural and practical identifiability analysis of partially observed dynamical models by exploiting the profile likelihood. Bioinformatics 25: 1923–1929 [DOI] [PubMed] [Google Scholar]
- Reiter E, Ahn S, Shukla AK, Lefkowitz RJ (2012) Molecular mechanism of beta-arrestin-biased agonism at seven-transmembrane receptors. Annu Rev Pharmacol Toxicol 52: 179–197 [DOI] [PMC free article] [PubMed] [Google Scholar]
- Reiter E, Lefkowitz RJ (2006) GRKs and beta-arrestins: roles in receptor silencing, trafficking and signaling. Trends Endocrinol Metab 17: 159–165 [DOI] [PubMed] [Google Scholar]
- Reiter E, Marion S, Robert F, Troispoux C, Boulay F, Guillou F, Crepieux P (2001) Kinase-inactive G-protein-coupled receptor kinases are able to attenuate follicle-stimulating hormone-induced signaling. Biochem Biophys Res Commun 282: 71–78 [DOI] [PubMed] [Google Scholar]
- Ren XR, Reiter E, Ahn S, Kim J, Chen W, Lefkowitz RJ (2005) Different G protein-coupled receptor kinases govern G protein and {beta}-arrestin-mediated signaling of V2 vasopressin receptor. Proc Natl Acad Sci USA 102: 1448–1453 [DOI] [PMC free article] [PubMed] [Google Scholar]
- Rizk A, Batt G, Fages F, Soliman S (2008) Continuous valuations of temporal logic specifications with applications to parameter optimization and robustness measures. InCMSB'08 Heiner M, Uhrmacher AM (eds), pp251–268Berlin, Heidelberg: Springer-Verlag [Google Scholar]
- Rizk A, Batt G, Fages F, Soliman S (2009) A general computational method for robustness analysis with applications to synthetic gene networks. Bioinformatics 25: i169–i178 [DOI] [PMC free article] [PubMed] [Google Scholar]
- Samama P, Cotecchia S, Costa T, Lefkowitz RJ (1993) A mutation-induced activated state of the beta 2-adrenergic receptor. Extending the ternary complex model. J Biol Chem 268: 4625–4636 [PubMed] [Google Scholar]
- Sasagawa S, Ozaki Y, Fujita K, Kuroda S (2005) Prediction and validation of the distinct dynamics of transient and sustained ERK activation. Nat Cell Biol 7: 365–373 [DOI] [PubMed] [Google Scholar]
- Shenoy SK, Drake MT, Nelson CD, Houtz DA, Xiao K, Madabushi S, Reiter E, Premont RT, Lichtarge O, Lefkowitz RJ (2006) Beta-arrestin-dependent, G protein-independent ERK1/2 activation by the beta2 adrenergic receptor. J Biol Chem 281: 1261–1273 [DOI] [PubMed] [Google Scholar]
- Swameye I, Muller TG, Timmer J, Sandra O, Klingmuller U (2003) Identification of nucleocytoplasmic cycling as a remote sensor in cellular signaling by databased modeling. Proc Natl Acad Sci U S A 100: 1028–1033 [DOI] [PMC free article] [PubMed] [Google Scholar]
- Vayttaden SJ, Friedman J, Tran TM, Rich TC, Dessauer CW, Clark RB (2010) Quantitative modeling of GRK-mediated beta2AR regulation. PLoS Comput Biol 6: e1000647. [DOI] [PMC free article] [PubMed] [Google Scholar]
- Vilardaga JP (2010) Theme and variations on kinetics of GPCR activation/deactivation. J Recept Signal Transduct Res 30: 304–312 [DOI] [PMC free article] [PubMed] [Google Scholar]
- Violin JD, Dewire SM, Barnes WG, Lefkowitz RJ (2006) G protein-coupled receptor kinase and beta-arrestin-mediated desensitization of the angiotensin II type 1A receptor elucidated by diacylglycerol dynamics. J Biol Chem 281: 36411–36419 [DOI] [PubMed] [Google Scholar]
- Violin JD, DiPilato LM, Yildirim N, Elston TC, Zhang J, Lefkowitz RJ (2008) beta2-adrenergic receptor signaling and desensitization elucidated by quantitative modeling of real time cAMP dynamics. J Biol Chem 283: 2949–2961 [DOI] [PubMed] [Google Scholar]
- Violin JD, Zhang J, Tsien RY, Newton AC (2003) A genetically encoded fluorescent reporter reveals oscillatory phosphorylation by protein kinase C. J Cell Biol 161: 899–909 [DOI] [PMC free article] [PubMed] [Google Scholar]
- Wei H, Ahn S, Shenoy SK, Karnik SS, Hunyady L, Luttrell LM, Lefkowitz RJ (2003) Independent beta-arrestin 2 and G protein-mediated pathways for angiotensin II activation of extracellular signal-regulated kinases 1 and 2. Proc Natl Acad Sci USA 100: 10782–10787 [DOI] [PMC free article] [PubMed] [Google Scholar]
- Wisler JW, DeWire SM, Whalen EJ, Violin JD, Drake MT, Ahn S, Shenoy SK, Lefkowitz RJ (2007) A unique mechanism of beta-blocker action: carvedilol stimulates beta-arrestin signaling. Proc Natl Acad Sci USA 104: 16657–16662 [DOI] [PMC free article] [PubMed] [Google Scholar]
- Xiao K, McClatchy DB, Shukla AK, Zhao Y, Chen M, Shenoy SK, Yates JR 3rd, Lefkowitz RJ (2007) Functional specialization of beta-arrestin interactions revealed by proteomic analysis. Proc Natl Acad Sci USA 104: 12011–12016 [DOI] [PMC free article] [PubMed] [Google Scholar]
- Xiao K, Sun J, Kim J, Rajagopal S, Zhai B, Villen J, Haas W, Kovacs JJ, Shukla AK, Hara MR, Hernandez M, Lachmann A, Zhao S, Lin Y, Cheng Y, Mizuno K, Ma'ayan A, Gygi SP, Lefkowitz RJ (2010) Global phosphorylation analysis of beta-arrestin-mediated signaling downstream of a seven transmembrane receptor (7TMR). Proc Natl Acad Sci USA 107: 15299–15304 [DOI] [PMC free article] [PubMed] [Google Scholar]
- Xu TR, Vyshemirsky V, Gormand A, von Kriegsheim A, Girolami M, Baillie GS, Ketley D, Dunlop AJ, Milligan G, Houslay MD, Kolch W (2010) Inferring signaling pathway topologies from multiple perturbation measurements of specific biochemical species. Sci Signal 3: ra20. [PubMed] [Google Scholar]
Associated Data
This section collects any data citations, data availability statements, or supplementary materials included in this article.
Supplementary Materials
Supplementary Figures S1–21, Supplementary Tables S1–2