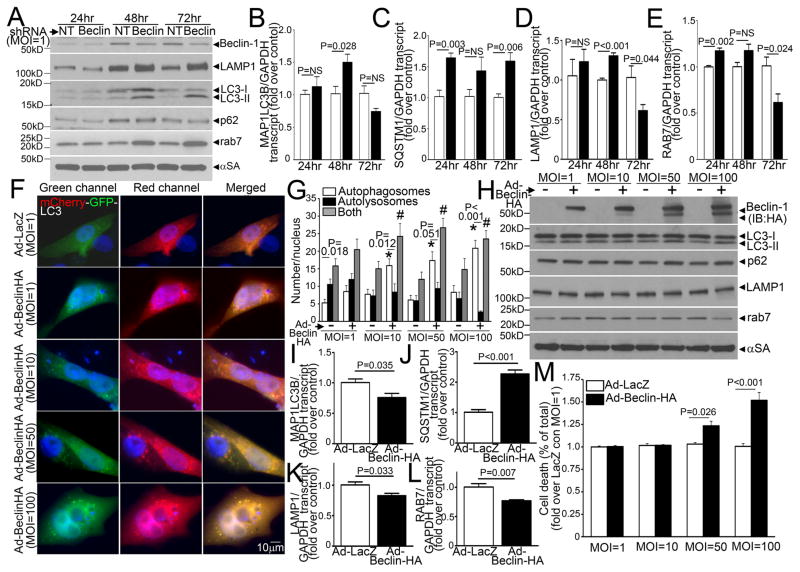
Figure 8.
BECLIN-1 levels regulate transcription of autophagy genes to affect autophagosome processing. A) Representative immunoblot depicting the time course of changes in protein levels of LAMP1, LC3, p62 and RAB7 in NRCMs adenovirally transduced with shRNA targeting Beclin-1 or a LacZ as non-targeting (NT) shRNA control (both at MOI=1), at 24, 48 and 72 hours after treatment with viral particles. Representative of n=2 experiments. B–E) Real-time PCR-based quantitation of MAP1LC3B (coding for LC3), SQSTM1 (for p62), LAMP1 and RAB7 transcripts in samples treated as in A. N=4/group at each time point. P values are by t-test vs control at each time point. F) Representative immunofluorescence images (630X) demonstrating mCherry-GFP-LC3 localization in NRCMs infected with increasing doses of adenoviruses (MOI=1, 10, 50 and 100) coding for HA tagged-BECLIN-1 or LacZ as control for 48 hours. G) Quantitative analysis of autophagosomes (white bars), autolysosomes (black bars) and both (gray bars) in NRCMs treated as in A; n=10–20 nuclei/group. * and # indicate P< 0.05 vs respective control for autophagosomes and both (autophagosomes and autolysosomes), respectively, by post-hoc test. P value within each group is by paired t-test. H) Immunoblots (representative of n=2 experiments) depicting Beclin-1 (HA), LC3, p62, RAB7 and LAMP1 expression in NRCMs treated as in F. I–L) Real-time PCR-based quantitation of MAP1LC3B, SQSTM1, LAMP1and RAB7 transcripts in NRCMs adenovirally transduced with Beclin-1-HA or LacZ (100MOI) as control for 24 hours. N=4/group at each time point. P values are by t-test vs control. M) Cell death in NRCMs treated as in F; n=8–16/group. P values noted are by post-hoc test.

