Abstract
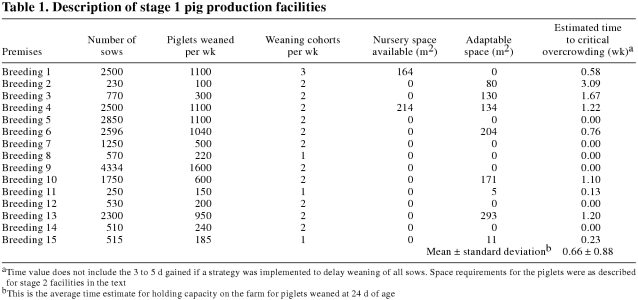
Canada maintains a stamping-out policy for control of foreign animal disease. Integral to stamping out, there are obligatory animal movement restrictions that, over time, can result in severe animal welfare problems. The purpose of this study was to estimate the time to critical overcrowding in a sample of Manitoba swine farms, if they were placed under movement restriction. Time to critical overcrowding in both static and dynamic populations was estimated by modeling swine growth and projecting anticipated on-farm stocking density through time and comparing it with a standard maximal stocking density. The time to critical overcrowding of 15 isowean piglet production units was 0.66 ± 0.88 weeks. On average, 7 isolated nursery facilities reached critical overcrowding in 52 ± 14 days and 5 farrow-to-finish operations reached critical overcrowding in 43 ± 18 days. Animal welfare concerns should be included in contingency plans to control foreign animal disease.
Introduction
Foreign animal disease (FAD) refers to a disease in animals caused by a transmissible infectious agent, currently exotic to Canada, with the potential for rapid spread, the introduction of which would seriously affect foreign market access to Canadian animal products. If a disease, such as classical swine fever (CSF), were identified in a Canadian swine herd, federal and local authorities would respond rapidly to eliminate the infectious agent from the swine population. The tools of stamping out disease include killing all known infected animals, tracing all high-risk contacts, the application of herd quarantine, testing of populations at risk, and placing geographic swine production areas under animal movement restriction (1,2). The European Community (EC) has developed comprehensive legislation to support operational activities necessary to stamp out CSF or foot-and-mouth disease (FMD) when it is introduced into a member state or states (3,4).
Recent experience in Europe in stamping out FAD has shown that swine populations on farms placed under movement restriction will quickly grow to exceed space available in pens, resulting in significant animal suffering (5,6). Welfare slaughter is a term used in European FAD eradication programs to refer to uninfected animals, residing in a control zone or under quarantine, that are killed due to overcrowding. Meat from the carcasses of these animals can not be salvaged under EC regulations and is usually sent to rendering. A review of recent CSF eradication efforts in Europe, as applied to the 1990, 1993, 1994, and 1997 outbreaks in Belgium and the 1997 outbreak in the Netherlands, revealed the largest single direct cost of eradication was associated with welfare slaughter, at roughly 50% of the total cost (5).
In Canada, the Canadian Food Inspection Agency (CFIA) has a clear legislative ability to order destruction and compensation for infected animals or animals in contact with an infected animal (7). Current CFIA contingency plans and strategy documents related to FAD eradication do not contain any recommendations for responding to welfare problems that are likely to occur, secondary to disease control initiatives (1,2).
This study was undertaken to estimate the time that is likely to pass before animal welfare problems related to overcrowding on Manitoba swine farms would arise should animal movement be restricted. Movement restrictions could occur as part of a domestic FAD eradication effort or subsequent to border closure as part of an FAD eradication effort in the United States.
Materials and methods
Farms were referred to the project, as opportunity arose, by veterinary practitioners, based on their knowledge of the management and likelihood of cooperation. All farms were visited and data on the inventory and physical attributes of each production unit were collected from May 5 to July 31, 2001.
Modern pork production systems can be quite complex, and standardized nomenclature to describe production systems has been developed (8). Briefly, there are 3 production stages; breeding-farrowing-weaning (stage 1), nursery pigs (stage 2), and grow-finisher pigs (stage 3). Any particular farm may be a combination of these 3 stages of production. A farrow-to-finish farm includes all stages of production. In this study, 15 stage 1, 7 stage 2, and 4 stage 1/2/3 facilities were evaluated. In addition, a standard designed stage 1/2/3 unit, as described by an agricultural engineering firm (Clarence Froese, DGH Engineering, St. Andrews, Manitoba), was evaluated. In this idealized unit, each breeding sow produced 22 weaned pigs per year and pigs reached market weight at 175 d of age with no death loss in stages 2/3 of production. For each sow place, there are 2.5 nursery pig places at 0.316 m2 (3.4 ft2) and 6.5 grow-finish pig places at 0.743 m2 (8 ft2). Standard nursery pen size is 1.83 m × 3.66 m (6 ft × 12 ft), and grow-finish pen size is 2.44 m × 7.32 m (8 ft × 24 ft).
Each farm included in the study was classified as a specific or a combination of production stages and a mathematical model was developed using software (Excel; Microsoft Corporation, Redmond, Washington, USA) to predict changing pen stocking density over time, if the farm were to be placed under absolute animal movement restriction. Farm models were projected through time to estimate the time to critical overcrowding on the particular farm. Critical overcrowding was defined as the situation when the floor pressure measured in kg bodyweight (BW)/m2 in the average pen was predicted to exceed the maximum allowed based on BW of pigs at stage 1 and 2 farms; near critical means a situation where the addition of 1 pig of similar BW to a pen would result in the pen floor pressure exceeding the maximum allowed at stage 1/2/3 farms.
Farm specific data that was used in modeling included available pen space and current pig inventory. For breeding populations, additional pig births were estimated from previous records. Predicted growth of individual pigs was estimated by using a standard growth curve. Pig inventory, where not already age segregated, was divided into cohorts, based on week of birth, in order to estimate average individual pig BW in a cohort at any time. In the model, average pig BW was estimated for age and served as input to the maximal allowed pen pressure for stages 1 and 2 of production and maximal numbers of pigs per pen in stage 1/2/3 operations.
Weight of pigs at any time was estimated by using a model described by the Gompertz function y = a × exp(-exp(b-cx)), where y = weight of a pig in kg, x = age of the pig in days, and a,b, and c are constants (a = 186.4, b = 1.509, and c = 0.01247) (9). This combination of parameters was used to characterize a typical growth curve for pigs from birth to market weight. This model predicted a 4.8 kg pig at 17 d of age, end of stage 1; a 21.3 kg pig at 59 d of age, end of stage 2; and a 112 kg pig at 175 d of age, end of stage 3. The mean BW of slaughter hogs in Manitoba was 112 kg in the year 2000 (10). This growth curve is also compatible with recent production data from the United States, where the average commercial pig leaves the nursery at 63.3 d of age and is marketed at 177.6 d of age (11). The Gompertz function was chosen since it is a relatively simple mathematical function that requires a minimum number of parameters to generate reasonable growth curves (9).
The minimum space allowed per pig by regulation in Europe has been approximated by a continuous function (12). The Spoolder approximation of the European regulatory standard for minimal space allowance is A = 0.030 × M0.67, where A is the minimal area per pig in m2 and M is the average BW (12). Minimum space per animal can be converted mathematically to an equivalent maximum allowed pen floor pressure. Converting the Spoolder minimum space allowance formula to a maximal allowed pen pressure generates the formula Pp = 33.3 × M0.33, where Pp is the maximal allowed pen pressure (kg BW/m2) and M is the BW of the average pig in kg. These 2 formulas describe the same maximal stocking density standard either in units of maximal BW per area or minimum space per animal. Maximal allowed pen floor pressure increases with increasing average pig BW in the pen.
In the stage 1 units examined, piglets are normally weaned at 17 to 19 d of age, 1 to 3 times a wk, and immediately removed to an isolated nursery facility. Critical overcrowding in these facilities was evaluated by measuring space available that was suitable to hold newly weaned pigs or could be converted quickly to weanling holding. To convert available area to time, the area available was divided by the area needed to hold 1 or more wk of expected weanling production. The space needs of weanling cohorts were estimated by using the Spoolder approximation at 24, 31, and, in one case, 38 d of age in order to estimate the number of wk of holding capacity within the unit. It was assumed that all farms would respond to immediate quarantine by holding off weaning pigs for 3 to 5 d.
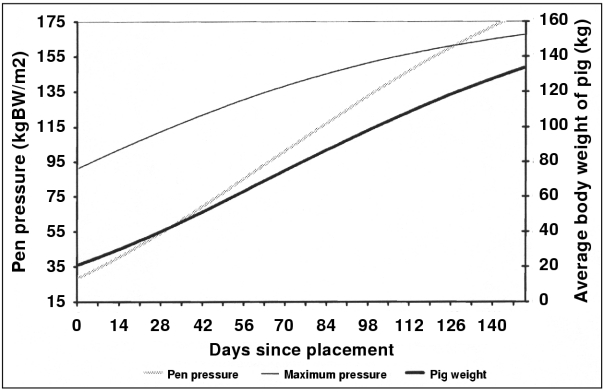
Evaluation of an area containing pigs of the same age, pen floor pressure (kg BW/m2) at any time, was calculated from the number and individual weights, as estimated from the age, of the pigs in the pen. In stage 2 barns, critical overcrowding occurred when the pen floor pressure, combined BW of all the pigs in a space, predicted by the pig growth model, divided by the area allotted, exceeded the maximal allowed floor pressure for that weight of pig. The model approach, applied to a typical grow-finish pen, stage 3 of production, filled with 59-day-old pigs on the date of quarantine, is described by Figure 1. In this example, pigs are placed, allowing 0.743 m2 (8 ft2) per animal. The model predicts that this pen becomes critically overcrowded at day 127 of quarantine, when the pigs are 186 d old and their average weight is 120 kg. In all-in-all-out (AIAO) facilities with pigs of the same age, it is simple to estimate the time to critical overcrowding by using a growth curve and a maximal stocking density standard. However, on many production units, the pig flow is continuous or there are many different age cohorts of pigs.
Figure 1. Visual representation of the model applied to predict the time to critical overcrowding for a single age group of feeder pigs. In this example, each pen has a floor area of 17.84 m2, placing 24, 59-day-old pigs in each pen on day 0. Pigs are quarantined on the day of placement. The line pig weight is derived from the standard growth curve based on animal age in days, (right hand scale). The pen pressure is calculated by dividing the total body weight of pigs in the pen by pen area, and the maximum allowable pressure is converted from the approximation of the European minimum space allowance standard (12), (left hand scale). Critical overcrowding was when the pen pressure equaled the maximal allowed pressure on day 127 of quarantine, when the pigs are 186 days old and have an average body weight of 120 kg.
The stage 2 multibarn sites studied were AIAO, either by room or barn, with respect to pig flow. The model assumed no new pigs would be added to a facility after a standstill order was placed on the day of visit (TQ). Records of numbers of pigs received were verified by partial pen counting and used to describe the resident animal inventory profile. Pens were inspected to verify dimensions, and the number of pens currently awaiting fill was recorded. The occupancy percentage at TQ was defined as the combined area of all pens containing pigs divided by the total pen area.
In modeling stage 2 production units, it was assumed that pigs could be given more space (more pens), with the restriction that pigs of different age cohorts would not be mixed in any pen. Total space allocated to a cohort and total BW of pigs in a cohort were treated as continuous variables. The time to overcrowding was estimated without adjustment for ongoing mortality.
The modeling technique for stage 2 multibarn sites was as follows. At TQ, each unit contained several cohorts of pigs, with each cohort of pigs containing a finite number of individuals and having been assigned a finite space. The average BW of pigs in each cohort was estimated from age by using the Gompertz function, assuming 17 d of age at the time of placement and number of days in residence. Average weight, number of pigs, and space assigned were used to calculate actual pen floor pressure for each age cohort. Allowable pen floor pressure in each cohort was calculated from the converted Spoolder approximation formula by using the estimated average pig BW. A spreadsheet was generated where each line contained values for actual and allowable pen pressure for each cohort in the unit. Subsequent lines of data were generated to represent all cohorts of pigs 1 d older than the previous line. Eventually, one day, the actual pen floor pressure would exceed the maximal allowed for a cohort and trigger an intervention. At intervention, pens would be reassigned from another cohort of pigs not yet critical, allowing for the redistribution of the critical pigs into more space and the immediate increase in crowding of the cohort of pigs that had surrendered their pens.
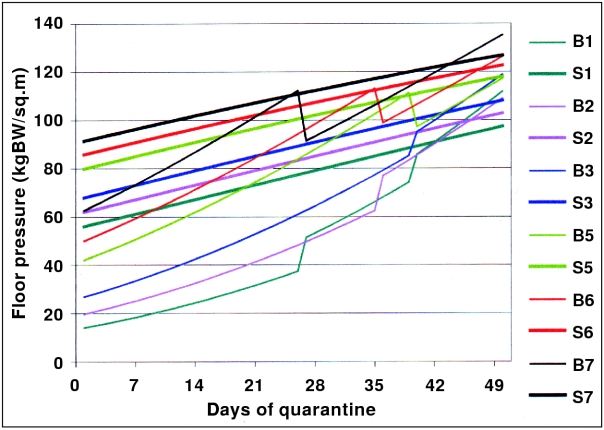
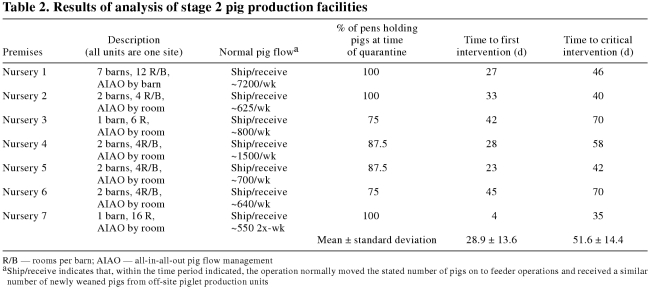
In a quarantined stage 2 production unit, the oldest cohort of pigs would reach critical overcrowding first; as, in every farm studied, each cohort of pigs was given the same allotment of space at the time of placement, regardless of actual numbers of piglets placed. When the first cohort of pigs became critically overcrowded, it was allocated more pens from the least critically crowded age cohort and both cohorts were redistributed to approximate equal numbers of pigs per pen within a cohort. The time to the first intervention (T1), where pigs were redistributed, was calculated for each nursery. Subsequent interventions of this nature were carried out as required, until further intervention would not result in relief of overcrowding and the entire nursery was considered critically overcrowded (TC). The model is most easily explained graphically (Figure 2).
Figure 2. Changing floor pressure over time as a measure of maximal allowable stocking density in an isolated nursery holding 7 age cohorts of pigs, 6 cohorts shown (Nursery 1 in Table 2). The maximal pen density allowed based on the weight of the pigs in Barn 1 is represented by S1; B1 is the actual pen density in Barn # 1. Intervention strategy; on day 27 of quarantine, Barn 7 pigs are at critical crowding. Three rooms in the least critically crowded barn, Barn 1, are reallocated to pigs in the B7 cohort. The B7 cohort would then occupy 15 rooms, 12 in Barn 7 and 3 in Barn 1. The B1 cohort would be restricted to 9 rooms in Barn 1. Pigs in both cohorts would be redistributed to even out the number of pigs per pen. Similarly on day 35, Barn 6 is critically crowded, and 2 rooms in Barn 2 are taken over by pigs from the B6 cohort. Pigs in both cohorts would be redistributed into pens within their cohort. On day 39, Barn 5 is critically crowded, and 2 rooms in Barn 3 and 1 in Barn 1 are reallocated to hold B5 pigs. One week subsequent to this intervention, that is on day 46 of quarantine, 4 of the 7 barns are critically crowded, the other 3 are near critically crowded, and no relocation of pigs will result in significant improvement of the overcrowding. Barn 4 (not shown) holding the median age cohort of pigs becomes critical on day 45 without introduction of other pigs.
In modeling stage 1/2/3 farms, stage 2/3 pig inventory at the TQ, was divided into 23 cohorts, each representing a group of pigs differing in age by 7 d and differing in BW, as predicted by the standard growth curve. The number of animals in a cohort was determined from weekly weaning records, where these were available, or by simple division of the inventory of nursery and grow-finish pigs into 23 cohorts. Piglets were assumed to be 21 d old at weaning; so on the day of quarantine, the youngest cohort of pigs was 21 d old and the oldest cohort of pigs was 175 d old. On TQ, all stage 2/3 pigs on hand were sham placed into pens of the actual dimensions available on the farm at the critically overcrowded point, starting with the oldest cohort. Each pen was filled to near critical crowding and the remaining pigs in a cohort that did not fill a pen were moved into the adjacent younger cohort, so that at the end of the placing exercise, the number of placed pigs was within 0.5% of the actual farm inventory.
The floor area available and the total BW of pigs in a cohort were not treated as continuous functions in stage 1/2/3 units, as they were in stage 2 units. The integer function in the software (Excel; Microsoft Corporation) was used in stage 1/2/3 modeling to allow for only whole pigs per pen. Some finishing units contained pens designed to hold a maximum of 10 slaughter-weight pigs. In the model, pigs were expected to grow well beyond market weight. The effect of having half a pig in excess in a pen holding 8 pigs would be expected to result in more severe crowding in stage 1/2/3 production units than in stage 2 production units where at TC pens still contained 15 to 25 pigs and half a pig in excess would be less significant.
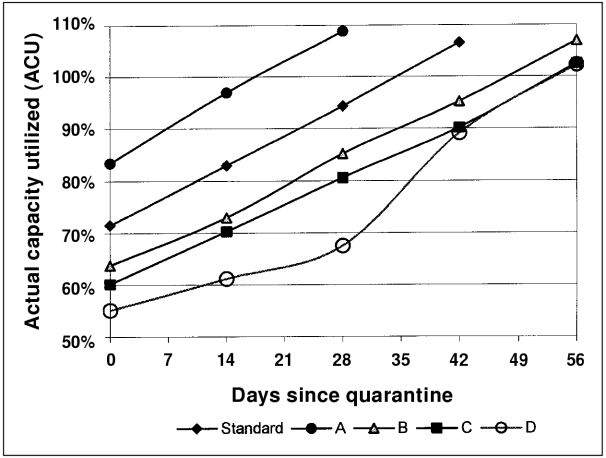
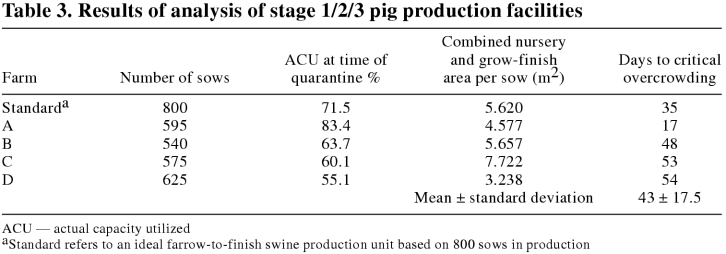
The placing exercise attempted to estimate actual space currently in use on the farm. It modeled a situation where all pens containing pigs were at near critical capacity and many pens were still empty. Actual capacity utilized (ACU) is defined as the combined area of pens holding pigs divided by the total area of pens available on the farm as a percent, where every pen containing pigs is critically overcrowded. Actual capacity utilized is a point-in-time estimate of the whole farm stocking density. The model was then reconstructed, using the ACU concept, to estimate a second ACU 14 d in the future with 2 new cohorts of weaned pigs making 25 cohorts and all cohorts of pigs sized to reflect the anticipated individual pig growth. The model was subsequently reconstructed at 14-day intervals to generate an ACU time line to estimate the day on which the whole facility was critically overcrowded (Figure 3). No attempt was made to account for ongoing pig mortality.
Figure 3. Change in percentage of actual capacity utilized over time for 5 farrow-to-finish farms placed under quarantine on day 0. The line 100% describes the situation where every pen of pigs in the nursery and grow-finish areas of the farm are critically overcrowded. The slope of lines describes the rate of consumption of available remaining space over time in the units of percent of overall capacity per day (0.829 ± 0.0675%). Farm D, the only farm model where the data did not highly conform to a straight line, was a replacement gilt production unit with the majority of female pigs being sold off the farm at less than market weight. With the placement of quarantine, this farm became critically overcrowded after a similar passage of time as for other farms.
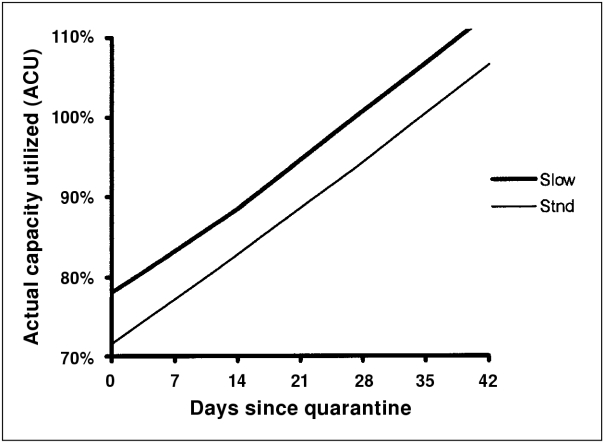
The sensitivity of the stage 1/2/3 model to changes in the average pig growth rate was evaluated by reconstructing the whole farm model for the standard 800 sow farm by using a growth curve where the average pig was marketed at 189 d instead of at 175 d (Figure 4). Extending the time to market by 2 wk by simulating less efficient growth resulted in 25 cohorts of pigs in residence at TQ.
Figure 4. Graphical comparison of time to critical overcrowding in an idealized 800-sow farrow-to-finish unit with standard growth of pigs reaching market weight at 175 d (thin line) and the same unit with slow growth of pigs reaching market weight at 189 d (thick line). Lines graphed describe the consumption of space over time in the units placed under quarantine at time zero. Critical overcrowding occurs when the situation specific change in actual capacity utilized line intersects the 100% ACU line on the y-axis. The % ACU is different for the 2 performance situations at time 0, because slow growing pigs swell the inventory of animals on the farm at the time of quarantine in comparison to the same farm with standard pig growth. The slope of the lines, which reflects the rate of utilization of available space, is essentially identical under both growth rate assumptions.
No isolated AIAO feeder barns were evaluated, as it was expected that the time to critical overcrowding in isolated stage 3 production units would be a simple function of the allocated space per pig and the age of pigs at the time of quarantine (Figure 1).
Statistical analysis of data was done by using slope, mean, and standard deviation statistical functions (Excel; Microsoft Corporation) and by Pearson correlation (Analyse-It; Analyse-It Software, Leeds, England).
Results
Fifteen stage 1 production units were evaluated (Table 1). The standard practice in this type of management system is to hold no piglets on the farm after weaning. Producers reported that piglets are weaned at 17 to 19 d of age directly off the sow into a trailer and moved immediately to a different geographic location. Six of these production units had no available space to hold weaned piglets and no space that could be quickly converted for holding piglets. These 6 production units could respond to movement restriction only by delaying weaning for 3 to 5 d. Further delays in weaning would prevent new sows being moved into the farrowing area and risk having sows farrow in the gestation stall area of the barn. Farrowing in gestation stalls would result in extremely poor welfare with death of the newborn piglets. The average farm had space to hold 0.66 ± 0.88 wk of production. If all of the 9385 piglets weaned per week in these 15 systems were considered as a group, the average pig (Σ (# pig in a unit × specific unit holding time) /total # pigs all units) lives in a system with a holding capacity of 0.51 wk of production, as larger units tended to have proportionally less holding space.
Table 1.
Seven isolated Stage 2 facilities were evaluated (Table 2). Time to first intervention was 29 ± 13.6 d and the average TC was 52 ± 14.4 d. The percentage of pens occupied at the time of quarantine was found to be significantly associated with TC, with a correlation coefficient of -0.91 (P < 0.05, Pearson correlation). Herd size was not significantly associated with T1 or TC. On the day of sham quarantine, 4 farms had open rooms and were waiting for piglets to arrive later that week. These farms could utilize this empty space to house growing pigs and delay the onset of TC.
Table 2.
Four stage 1/2/3 operations and a standard engineered farm were evaluated (Table 3). The average time to critical overcrowding in these premises was 43 ± 17.5 d. Time to critical overcrowding was significantly associated with ACU at the time of quarantine, correlation coefficient -0.987 (P < 0.05 Pearson correlation). The change in available space in a production unit over time, the ΔACU/d, is described by the slope of the respective line in Figure 3. The percentage of available space consumed per day for the 5 farms analyzed was 0.829 ± 0.0675%. Farm D did not conform to a straight line in Figure 3. This farm was a gilt multiplier unit and had roughly half of the stage 2 and stage 3 holding space on a per sow basis that the other farms studied did (Table 3). This operation did not breed sows to even out weekly farrowings but to meet specific gilt replacement contracts. The operation also sold gilts intended for breeding off the farm at a variety of ages and generally only fed barrows out to slaughter weight. At TQ, weekly cohort size varied between 65 and 350 pigs. Once put under movement restriction, this farm reached critical capacity in a similar time period as the other commercial farms.
Table 3.
When the model for the standardized farm was reconstructed assuming the average pig reached market weight at 189 d of age from the original 175 d of age, the ΔACU/d essentially remained the same (0.8269 slow growth vs 0.8343 standard growth % ΔACU/d). The production system under slow growth performance reached TC at day 28 of quarantine versus day 35 with the standard growth. This model is, therefore, more sensitive to stage 2/3 pig inventory on the day of quarantine than it is to individual animal growth rate. The model suggests that stage 1/2/3 production units experiencing poor grow-finish performance have a shorter TC if placed under movement restriction than do similar systems with superior individual animal growth rate.
Discussion
Mathematical models, by necessity, rely on reasonable assumptions to provide input to calculations. The 17- and 59-day-old individual pig BWs predicted in this study are probably lighter than is common in actual swine production in Manitoba. As growing pigs are in stage 2 for 6 or 7 wk and in the stage 3 for 16 wk or more, we considered any mathematical model devised to predict overcrowding would be sensitive to inflated piglet weights at the end of the nursery stage. We chose a growth curve to be conservative for stage 2 production. Our predicted times to critical overcrowding in stage 2 are, therefore, conservative.
We chose the European standard to describe overcrowding, as it is in legislation and allows for more severe crowding than does the Canadian Code of Practice for pigs (13). The Canadian Code recommends space allowance for growing pigs based on floor type. The Code recommends minimum space allowance for growing pigs based on separate prediction formulas for fully slatted, partially slatted, and solid bedded floors. The Code recommendations for these types of flooring are 115%, 128%, and 148%, respectively, of the European standard. The Canadian Code recommends 0.81 m2 (8.7 ft2) for market weight pigs 110 kg BW on fully slatted floors (13). Fully slatted floor systems can operate without significant overcrowding while allowing less than 0.81 m2 per feeder pig, since, in the marketing of a pen of pigs, the fastest growing individuals can be removed and marketed, starting as early as 155 d of age. In a recent study of a large integrated system in the United States, grow-finish pigs were regularly allocated 0.641 m2 (6.9 ft2) per pig (14). The predicted time to critical overcrowding presented in this paper is compatible with the time when the pigs have 15% less space than the minimum recommended by Canadian standard for fully slatted floors.
In model application to stage 2 premises, the increase in mass of live pig and the space available were treated as continuous functions; that is, all pig BWs in a cohort and all floor space assigned to a cohort were treated as a pool. This allowed for an accurate estimate of when the average pen would be overcrowded. However, pens and pigs are both integer functions and, at the point in time the model predicted critical pen pressure, on average, half of the pens would be overcrowded.
In stage 1/2/3 operations that were modeled, the rate of consumption of available space was remarkably consistent. This very high consistency may be an artifact of the modeling exercise, as all the farms were modeled by using the same growth performance. However, taking the standard farm as an example and applying a growth curve where the average pig went to market at 189 d instead of at 175 d did not change the rate of consumption of available space. A decrease in the growth rate of 8.3% actually decreased the time to TC by 20%, from 35 to 28 d. In this modeling exercise, slower growth did not result in a decrease in the rate of consumption of available space. Slower growing pigs have the effect of increasing the inventory on TQ, increasing the ACU on TQ, and decreasing the protective effect of slower growth performance on TC.
The information provided by the concept of the ΔACU/d could be very useful in managing farm welfare situations, subsequent to a significant animal movement restriction of stage 1/2/3 production units. If an approximate ΔACU/d could be established for administrative purposes, it would allow prediction of TC in stage 1/2/3 units solely by calculating the ACU on the day of quarantine. Secondly, as stage 1/2/3 farms become critically overcrowded and intervention becomes necessary, it would allow the calculation of how many pens would need to be emptied to allow for a given time until the next TC. In the example of the standard 800 sow stage 1/2/3 unit described with average pig marketed at 175 d, an intervention strategy to provide 45 d of production space at TC would have to free up 37% of the floor space (45 d × 0.83%/d). In this example, if pigs were removed on day 35 of quarantine (TC), starting with the oldest cohort, about 2870 of the 9518 pigs in the stage 2/3 inventory on that date (30%) would have to be removed to clear 37% of the floor space.
More accurate estimates could possibly be made for a unit by using data from that farm to derive farm specific growth curves. The extra effort may not be worthwhile if pens were intended to hold 20 pigs, because the pen pressure difference between stocking 19 and 20 pigs (5%) may be larger than the differences between an actual and a standard growth model at any point in time.
Ongoing death losses were not accounted for in modeling time to critical overcrowding in this study. The current inventory on the day of quarantine would be expected to account for about half of the mortality, as half of the pigs should be past the mid point of time where they are at risk for death loss. Overall, stage 2 mortality would be expected to be around 2.6% and stage 3 mortality around 2.9% (11). In a stage 1/2/3 unit and TC predicted to be 35 d in the current model, a combined stage 2/3 mortality of 5% would be expected to extend the TC by maximum of 2.1 d.
An alternative strategy that is not considered in this paper is nutritional modification to manipulate growth rates after movement restrictions are in place. Reducing feed available and feeding diets that support only slow growth rates could be useful tools to prolong TC during periods of restricted animal movement. Also, the physical crowding of pigs will in itself have a direct effect to suppress growth rates and increase TC (9).
Discussion of this project with veterinarians and swine production management staff identified many practical welfare concerns not addressed in this paper. For instance, in stage 2 units at TC, some cohorts of pigs would also be too large to use the feeders. Intervention options, which result in the continual mixing of pigs in stage 2 pens, would result in aggression, and the mixing of different ages of pigs in a room was perceived to be a significant disease risk. The consequences of solving one welfare problem may generate other welfare problems, increased death, costs to the producer, and the basis for reluctance on the part of the producer to redistribute pigs. It was also considered that in management of stage 1/2/3 production units, it may be difficult, physically and logistically, to balance the numbers of pigs in pens to ensure that all sizes of pigs are experiencing similar crowding simultaneously.
This study does provide a reasonable method to predict critical overcrowding on swine farms placed under movement restrictions. It also provides some structure with which to talk about animal welfare concerns related to FAD eradication or interruption of access to export markets for live pigs. Discussions in Canada related to FAD response have thus far centered on planning for disease control operations, with very little discussion of response to consequential impacts of the disease control actions. In recent CSF outbreaks in Europe, especially in areas of high pig density, the resources needed to respond to animal welfare concerns greatly exceed the resources required to deal with infected premises during the stamping-out period. Contingency planning for a FAD incursion into a region should include considerations related to welfare consequences of stamping-out procedures.
Footnotes
Acknowledgments
This work was made possible by the cooperation and support of individual Manitoba swine producers. The veterinarians and staff of Sheridan, Heuser, Provis Swine Health Services Ltd. Steinbach, and Dr. Claude Mason, Winnipeg, were instrumental in providing access to producers and facilities. CVJ
Manitoba Agriculture and Food Veterinary Services Branch provided financial and technical support. Financial support was also provided by funding from the Student Temporary Employment Program, Manitoba Education Training and Youth.
Address correspondence and reprint requests to Dr. Terry Whiting.
References
- 1.Anonymous. Foot-And-Mouth Disease Strategy (Draft). Canadian Food Inspection Agency. Nepean: Canadian Food Inspection Agency, Disease Control Section, 2001.
- 2.Anonymous. Classic Swine Fever Strategy (Draft). Canadian Food Inspection Agency. Nepean: Canadian Food Inspection Agency, Disease Control Section, 1997.
- 3.European Union. Council Directive 80/217/EEC of 22 January 1980 introducing Community measures for the control of classical swine fever (with amendments from: 08/07/1993 last updated: 07/08/2000). Available at: http://europa.eu.int/eur-lex/en/consleg/main/1980/en_1980L0217_index.html. Accessed on June 12, 2002.
- 4.European Union. Council Directive 85/511/EEC of 18 November 1985 introducing Community measures for the control of foot-and-mouth disease (with amendments). Available at: http://europa.eu.int/eur-lex/en/lif/reg/en_register_035030.html. Accessed on June 12, 2002.
- 5.Saatkamp HW, Berentsen PB, Horst HS. Economic aspects of the control of classical swine fever outbreaks in the European Union. Vet Microbiol 2000;73:221–237. [DOI] [PubMed]
- 6.Meuwissen MP, Horst SH, Huirne RB, Dijkhuizen AA. A model to estimate the financial consequences of classical swine fever outbreaks: principles and outcomes. Prev Vet Med 1999;42:249–270. [DOI] [PubMed]
- 7.Statutes of Canada, Health of Animals Act, SOR/2000-233. Compensation for destroyed animals regulations. Registration: June 8, 2000 Available at: http://laws.justice.gc.ca./en/H-3.3/SOR-2000-233/index.html. Accessed on June 12, 2002.
- 8.Harris DL. Multi-Site Pig Production. Ames, Iowa: Iowa State Univ Pr, 2000.
- 9.Schinckel AP, de Lange CFM. Characterization of growth parameters needed as inputs for pig growth models. J Anim Sci 1996;74:2021–2036. [DOI] [PubMed]
- 10.Honey J. Manitoba Livestock Industry Profiles 2000. Winnipeg: Manitoba Agriculture and Food, Market Analysis and Statistics Section, 2000:9–18
- 11.Reference of swine health and management in the United States. #N338.0801. Fort Collins, Colorado: NAHMS, 2001. National Animal Health Monitoring System.
- 12.Spoolder HAM, Edwards SA, Corning S. Legislative methods for specifying stocking density and consequences for the welfare of finishing pigs. Livestock Prod Sci 2000;64:167–173.
- 13.Recommended code of practice for the care and handling of farm animals: Pigs. Ottawa: Canadian Agri-Food Research Council, 1993.
- 14.Maes D, Larriestra A, Deen J, Morrison R. A retrospective study of mortality in grow-finish pigs in a multi-site production system. J Swine Health Prod 2001;9:267–273.


