Abstract
We have recently developed a spectral re-shaping technique to simultaneously measure nonlinear refractive index and nonlinear absorption. In this technique, the information about the nonlinearities is encoded in the frequency domain, rather than in the spatial domain as in the conventional Z-scan method. Here we show that frequency encoding is much more robust with respect to scattering. We compare spectral re-shaping and Z-scan measurements in a highly scattering environment and show that reliable spectral re-shaping measurements can be performed even in a regime that precludes standard Z-scans.
1. Introduction
The Z-scan technique can be considered the gold standard for measuring nonlinear absorptive and dispersive coefficients [1,2] and it has been used to study the nonlinear properties of a wide range of optical materials, such as pure or doped glasses [3,4], semiconductors [5], liquids, and liquid crystals [6]. However, its reliance on detecting small beam variations restricts the use of Z-scans to clean, transparent materials. Therefore, highly scattering media, such as biological tissue (other than clear liquids such as vitreous humor [7]) are not suitable for studies with this technique.
Nonlinear absorption and dispersion is, however, ubiquitous in biological materials and can offer a range of novel contrast mechanisms. Conventionally, the use of nonlinear contrast in tissue is limited to processes that create light of a wavelength that is sufficiently distinct from the wavelength used for excitation [8], such as in two-photon fluorescence [9], second-harmonic generation [10], or coherent anti-Stokes Raman scattering [11]. Using recently developed measurement techniques we have shown that nonlinear absorption has the potential to offer contrast of diagnostic value [12–14]. In addition, parametric processes are beginning to be used in biological samples, such as stimulated parametric emission [15] and self-phase modulation (SPM) [16].
We have recently developed a spectral re-shaping technique that can simultaneously measure two-photon absorption and self-phase modulation with good sensitivity [17,18]. While this technique has been shown to provide contrast in biological samples [16,19], here we perform the first quantitative comparisons between spectral re-shaping and the Z-scan method in scattering media. In regimes where both methods can be used we show that scattering prevents accurate quantification of nonlinear refractive index with the Z-scan technique. The spectral re-shaping technique does not suffer from this limitation. We also demonstrate that spectral re-shaping can extract nonlinearities even in such highly scattering media that preclude the use of the traditional Z-scan technique.
2. The Z-scan and the spectral re-shaping technique
In the standard Z-scan technique, the sample is translated through the focus of a laser beam in the direction of beam propagation (the Z-direction). Because nonlinear processes have higher-order dependence on light intensity, the light-matter interaction is predominantly localized to the focal region. In case of a two-photon absorbing media a transmission minimum occurs when the focus position is centered in the sample. The two-photon absorption (TPA) coefficient can be extracted by fitting the transmission as a function of sample position (the open-aperture scan). In the case that a sample exhibits self-phase modulation (SPM) only, the total transmitted power remains constant, but small phase shifts are imposed on the high-intensity parts of the beam. For a Gaussian beam profile this effect leads to self-focusing or self-defocusing in the sample, resulting in changes in the far-field diffraction pattern. The conventional way of detecting these changes in the spatial profile is by measuring the power transmitted through a small aperture placed in the far-field region of the beam. The recorded transmission as a function of sample position (the closed-aperture scan) shows dispersive-type features from which the SPM coefficient can be extracted. If the material exhibits both TPA and SPM the two contributions can be disentangled by fitting the open- and closed-aperture scans [20].
Over the years various modifications have been introduced for the Z-scan technique to enhance its sensitivity and applicability [21–23]. The sensitivity to beam shape changes can be enhanced over closed-aperture measurements by eclipse-type measurements [24] or by numerically fitting complete beam profiles acquired with an imaging device [25]. Still, a well characterized and clean input beam profile is required for precise measurements [20]. Bridges et al. have demonstrated a technique which partially relaxes the stringent beam shape requirement by measuring the nonlinearity of the sample relative to a reference sample [26]. The key mechanism of the Z-scan technique is to measure the SPM-induced phase shift via its effect on the far-field diffraction pattern. In a strongly scattering medium these small changes in the beam profile are masked by the diffusive nature of multiple scattering. Beam profiles in such samples are “washed out” and Z-scan traces do not provide the information required to extract nonlinear coefficients. Scattering therefore not only decreases the amount of light available for detection, but also leads to quantitative errors in the estimation of the nonlinear parameters. Higher sensitivity versions of the Z-scan (such as eclipse or pump-probe type) still suffer from this inherent lack of accuracy.
In contrast, the spectral re-shaping technique encodes the nonlinear signature in the spectral rather than the spatial domain. As described in [17], the self-induced phase shift results in a small change in the frequency spectrum of an ultrafast laser pulse. For moderate power levels this spectral change is generally quite small but can be distinguished from the large background by appropriately pre-shaping the laser pulse. Using femtosecond pulse shaping techniques we introduce a spectral hole in the center of the pulse spectrum. Due to their nonlinear nature, both TPA and SPM alter the spectrum in such a way as to partially refill the spectral hole. These effects can be separated by the phase of the polarization in the spectral hole: TPA is an absorptive process and adds a field that is 180° out of phase with the remainder of the pulse, whereas SPM is dispersive and adds a field 90° out of phase. By adding a well-defined reference field (referred to as the local oscillator) in the spectral hole these two contributions can be separated. This homodyne scheme not only provides a phase measurement but also a dramatic signal enhancement due to the amplification effect of the local oscillator. In contrast to the beam shape, the frequency spectrum of a pulse is largely unaffected by linear scattering events. Therefore we can extract nonlinear signatures imprinted on the spectrum even if only a small fraction of the light passing through the focus can be collected by the detector. Moreover, even if only a small, scattered fraction of light can be collected for detection, an accurate determination of nonlinear coefficients is possible. This also means that back-scattered light could be used to extract the spectral information, making this technique suitable for thick, non-transmissive samples.
3. Experimental setup
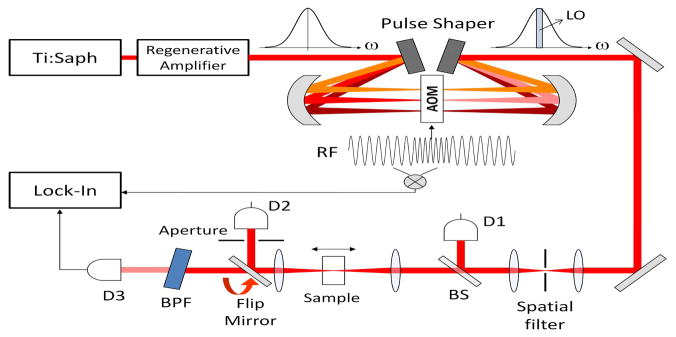
Figure 1 shows a simplified schematic of our experimental setup. Our laser source was a Coherent RegA regenerative amplifier seeded by a mode-locked Ti:Sapphire oscillator (Vitesse, Coherent). The output pulse length was about 50 femtoseconds at a repetition rate of 20 kHz. The spectral shaping was performed using a standard 4–f acousto-optic pulse shaper [27]. The phase of the central portion of the pulse spectrum (~3 nm) was rotated at 5 kHz to create the local oscillator (LO). The beam was then spatially filtered to achieve a near-Gaussian beam profile for use with the Z-scan technique. Part of the beam was diverted by a beam splitter (BS) onto a photodiode (D1) for input power monitoring. The beam was then focused using a 100 mm focal length lens into the sample, which was mounted on a translation stage for scanning along the beam axis. The beam radius at the focus was about 9 μm. For each sample we performed traditional Z-scans and spectral re-shaping scans in succession. For the spectral re-shaping trace the beam was passed through a band-pass filter (BPF, an angle-tuned interference filter). The central 1 nm portion of the LO passed through the filter and was collected onto a photodiode (D3). The signal from the photodiode was time-gated with a boxcar integrator and analyzed in a lock-in amplifier. A 5 kHz (LO rotation frequency) reference signal was provided to the lock-in amplifier by the pulse shaper electronics. For the Z-scan data we acquired two closed-aperture traces: a “high power” trace and a “low power” trace that was used as normalization in order to compensate for linear sample distortions and for variations in the input beam profile. To acquire these closed aperture Z-scan traces a 150 μm pinhole was placed in the far field and the light passing through this aperture was collected by a photodiode (D2). This signal was also time-gated and analyzed in a lock-in amplifier. Here, the incoming pulses were amplitude modulated with the same modulation frequency of 5 kHz.
Fig. 1.
Simplified schematic of the experimental setup.
Our sample consisted of a 1 mm thick glass slide placed in a scattering medium (intralipid in water) contained in a 20 mm × 20 mm glass cuvette. Varying the concentration of the intralipid solution changes the scattering strength of the medium. The incident power onto the sample was 1.7 mW (85 nJ/pulse) for the spectral re-shaping and 4.9 mW (245 nJ/pulse) for the Z-scan measurements.
4. Results
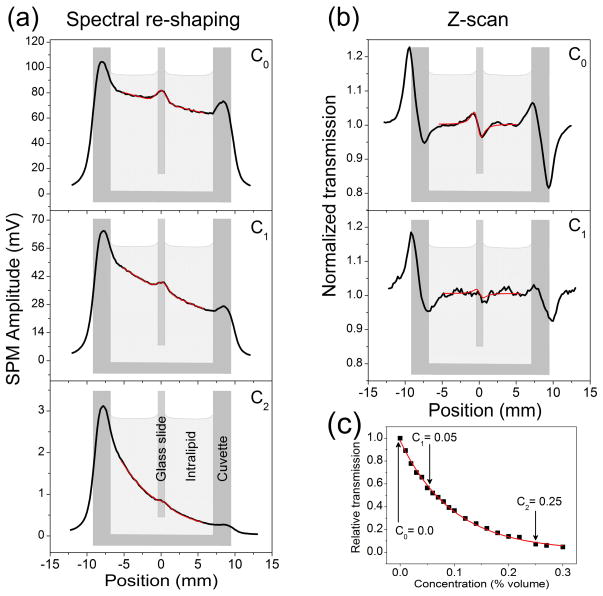
Figure 2 shows sample traces for the spectral re-shaping (a) and the Z-scan technique (b) at different concentrations of the intralipid solution. To calibrate the scattering strength as a function of intralipid concentration, we performed a set of linear transmission measurements. For these measurements we recorded only the unscattered light passing through the cuvette (the ballistic photons). We fit the resulting transmission data with the exponential function T = exp(−a0 C L) (Beer’s law), where C is the concentration (in % vol) and L is the length of the cuvette. We obtained an exponential reduction parameter of b0 = a0 L = 10.4.
Fig. 2.
Part (a) shows spectral re-shaping scans at concentrations C0, C1 and C2. Part (b) shows averaged Z-scan traces at concentrations C0 and C1. The red lines in the graphs are the corresponding fit traces. Part (c) shows relative linear transmission of the sample as a function of concentration of intralipid in water. Also marked in (c) are the concentrations C0, C1 and C2 used in parts (a) and (b). The spectral re-shaping and Z-scan traces are averages of 9 scans performed at multiple transverse positions of the cuvette (to reduce the influence of possible sample impurities).
The traces in Fig. 2(a) and 2(b) show qualitative differences. The spectral re-shaping traces in (a) provide a signal that is proportional to the nonlinear coefficient at every position within the sample [18]. It is apparent that glass exhibits a larger self-phase modulation coefficient than water and the intralipid solution. We can also see that in a scattering sample, the signal decays exponentially as a function of focus position, because scattering reduces the amount of light reaching the focal volume (the left side of the graph corresponds to the light entrance side). Even in the case of pure water (C0 = 0) we observe a reduction in signal when moving the focus towards the exit surface. We traced this behavior to the combination of two effects: the dispersive broadening of the ultrafast pulse in the solution and the small loss of power due to the refractive index mismatch at the water/glass interface.
The Z-scan traces in Fig. 2(b) exhibit the typical features of self-focusing/defocusing. The transmission changes occur near interfaces (air/glass and glass solution) and are sensitive to the relative change of nonlinear index (this is in contrast to the absolute nature of the spectral re-shaping signal). Here, too, a signal decrease due to scattering, index mismatch and dispersion is apparent in the asymmetry of the peaks at the air/glass and glass/air interfaces.
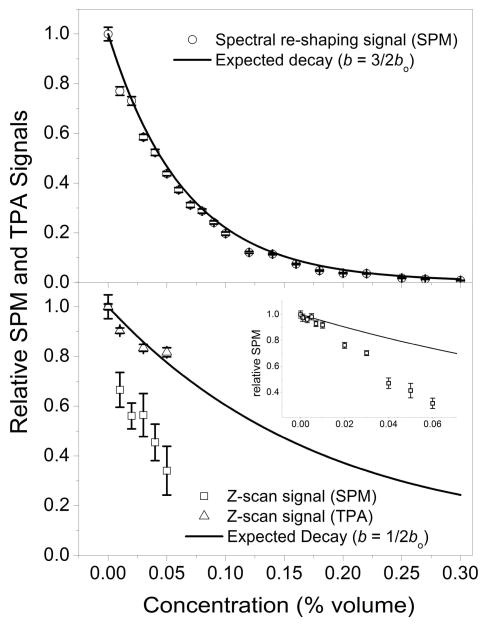
To quantify the influence of scattering on the two measurement techniques we performed nonlinear least-square fits on the signal trace averages (9 traces were averaged for each concentration). For the spectral re-shaping method, we approximated the trace within the cuvette as the sum of an exponential decay and a Gaussian peak centered at the position of the glass slide. Note that with this model function, the Gaussian amplitude measures the difference in nonlinear coefficients between the glass and the surrounding solution (in analogy to the Z-scan case). The traces in Fig. 2(a) show the best fit curve as thin red lines. We then extracted the values of the Gaussian amplitude and normalized this set to the case of pure water. The resulting data set is shown in Fig. 3 (top).
Fig. 3.
Relative nonlinear self-phase modulation (SPM) signals in the glass slide as a function of concentration of the intralipid solution. Shown are spectral re-shaping (top) and Z-scan results (bottom). The inset shows a high-resolution scan for low concentrations. In the bottom panel we also show two-photon absorption (TPA) signals in a colored glass filter. The values and error bars are best fit values and fit errors, respectively. The fit was performed on an average of 9 traces and the resulting fit values were normalized by the value for pure water. Also shown as lines in each graph is the expected signal drop-off based on a focal intensity reduction due to scattering.
The influence of scattering in these measurements can be estimated as follows. Once the light has entered the cuvette it is attenuated by the factor exp(−a0C L / 2) on its way to the focus assuming that the glass is centered in the cuvette. Since the spectral re-shaping scales quadratically with intensity, the signal at the focus is reduced by exp(−a0C L). The resulting spectral signature is further attenuated by exp(−a0C L / 2) between the focus (glass slide) and the exit side of the cuvette. This results in a reduction of exp(−3/2 a0C L), yielding bSpec = 3/2 b0, where b0 is the reduction parameter for linear transmission. An exponential curve with this parameter is indicated in the top panel of Fig. 3 and is seen to match the experimental data very well (note that this curve has not been obtained by fitting the SPM data).
We also extracted quantitative data from the Z-scan traces via nonlinear least-square fitting. The model function we used is applicable to “thick” refractive samples (Eq. (29) in ref [20]). For concentrations above C1 we were are not able to fit Z-scan traces due to extremely low signal to noise ratios. We normalized the obtained value for nonlinear refraction (dφ0R in ref [20]) to the pure water case. The results are displayed in Fig. 3 (bottom). The estimation for the influence of scattering can be performed similarly. However, in a Z-scan trace the signal that is analyzed is the power transmitted through the aperture divided by the transmission when the sample is out of focus (i.e. the linear transmission through the aperture). The absolute reduction of aperture transmission also scales quadratically with focal intensity, leading to a reduction of exp(−3/2 a0C L). However, division by the linear transmission (proportional to exp(−a0C L) ) results in a reduction parameter of bZ-scan=½ b0. A curve with such a behavior is displayed in Fig. 3 (bottom). To further test this model, we replaced the glass sample with a 1 mm thick color glass filter (RG665), which shows strong two-photon absorption (TPA) at our laser wavelength. We then performed an open aperture Z-scan to extract the TPA coefficient for several concentrations of the surrounding scattering solution. The resulting relative TPA values are also plotted in Fig. 3. In contrast to the SPM values, the TPA values fit the expected reduction curve well.
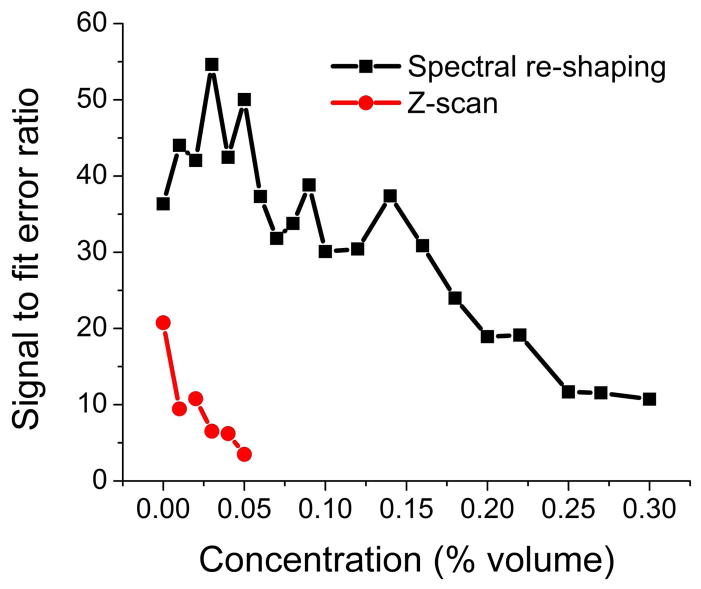
In order to illustrate the difficulty in measuring nonlinear refractive index in scattering media we plotted the ratio of fit value to the statistical fit error obtained by the nonlinear least-squares fit in Fig. 4 for both measurement techniques. It is apparent that the reliability of the fit decreases rapidly with increased scattering. For the Z-scan only concentrations below 0.05 percent by volume resulted in reliable fit values.
Fig. 4.
Ratio of best fit values for the nonlinear coefficient to the fit error (standard deviation) for the spectral re-shaping and Z-scan technique as a function of concentration of the intralipid solution. The fit was performed on a 9-trace average. Note that the incident power used for the Z-scan was about three times higher than the power used for the spectral re-shaping technique.
5. Discussion
From the data in Fig. 3 it is apparent that the spectral re-shaping method can be described well by a model that accounts for the intensity of ballistic photons at the focal spot. The effect of scattering (other than the reduction of focal intensity) does not interfere with the actual measurement. However, Z-scan measurements of the nonlinear refractive index are highly sensitive to the spatial profile of the transmitted beam (two-photon absorption measurements are not). Any variation in this profile will be recorded and interpreted as nonlinear in origin. The situation can be partially alleviated by normalizing each Z-scan with a corresponding “low power” trace (as was done in our experiments). This procedure aims at separating linear transmission changes, such as those caused by sample distortions, from changes induced by nonlinearities in the sample. Even though the effect of scattering (the broadening and “smearing”) on the linearly transmitted beam can be accounted for, the nonlinear beam changes wash out equally, leading to a decrease in measured nonlinearity, therefore decreasing accuracy.
We also observed differences between the two techniques in the way scattering influences the measurement precision. While it is natural to expect an increase in uncertainty for increasing amount of scattering, the Z-scan method is substantially more susceptible to this effect. In the Z-scan technique, only very low concentrations (less than 0.05% vol) allowed reliable extraction of the nonlinear coefficient. In contrast, the spectral re-shaping method showed an acceptable signal to fit error ratio even at concentrations as high as 0.3% vol (where only about 5% of the input power is transmitted through the sample).
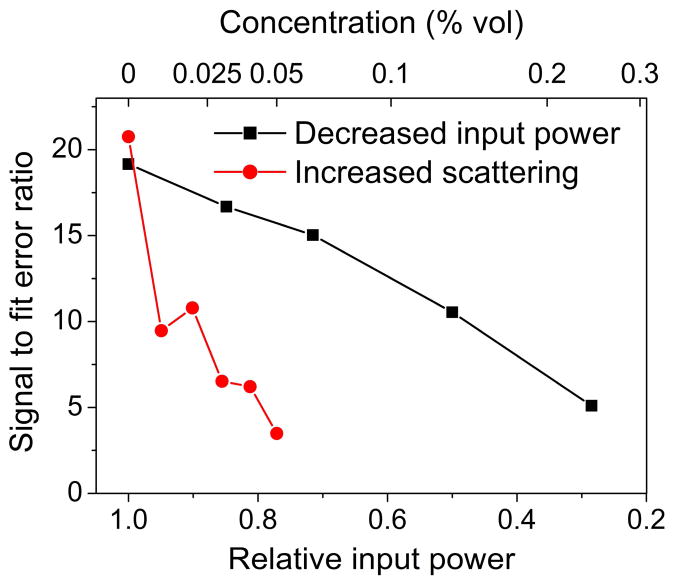
In order to demonstrate that the increase in Z-scan’s uncertainty as scattering increases is not simply due to a loss of nonlinear signal, we investigated the direct influence of focal power on the Z-scan signal to fit error ratio. In a clean water sample we varied the input power and compared the signal to error ratio with the scattering case. Figure 5 shows both measurements, where the two x-axes were scaled to match the power at the focus in both cases. We can see that the power reduction alone cannot account for the lower signal to error ratio in Z-scan. To confirm this finding we removed the aperture and recorded time-lapse images of the transmitted beam profile on a CCD camera (data not shown). For scattering samples we observed increasing fluctuations in the beam profile on a wide range of spatial and temporal scales. In comparison, for the spectral re-shaping measurements in a clean water cuvette the reduction of input power by a factor of 3 did not appreciably affect the measured signal to error ratio.
Fig. 5.
Ratio of best fit values for the nonlinear coefficient to the fit error (standard deviation) for the Z-scan technique with decreasing input power in comparison to increased scattering. The two x-axes are scaled to match the power reaching the sample at each point.
6. Conclusions
We have demonstrated that the spectral re-shaping technique can measure the nonlinear refractive index in scattering media that are unsuitable for measurements with the Z-scan technique. Here we have performed spectral re-shaping measurements of self-phase modulation only, but we have previously demonstrated that this technique is equally capable of measuring nonlinear absorptive effects [18].
Because this technique is much more robust with regards to detrimental influence of scattering it opens up a wide range of possible targets, primarily biological tissue that was inaccessible with standard measurement techniques, such as neuronal tissue [16]. The localized nature of this measurement technique also promises to offer a new intrinsic contrast for nonlinear microscopy that is complementary to existing techniques.
Acknowledgments
This work was supported by the National Institutes for Health (1RC1CA145105) and funding from Duke University.
References and links
- 1.Sheik-Bahae M, Said AA, Van Stryland EW. High-sensitivity, single-beam n(2) measurements. Opt Lett. 1989;14(17):955–957. doi: 10.1364/ol.14.000955. [DOI] [PubMed] [Google Scholar]
- 2.Sheik-Bahae M, Said AA, Wei TH, Hagan DJ, van Stryland EW. Sensitive measurement of optical nonlinearities using a single beam. IEEE J Quantum Electron. 1990;26(4):760–769. [Google Scholar]
- 3.DeSalvo R, Said AA, Hagan DJ, VanStryland EW, Sheik Bahae M. Infrared to ultraviolet measurements of two-photon absorption and n2 in wide bandgap solids. IEEE J Quantum Electron. 1996;32(8):1324–1333. [Google Scholar]
- 4.Bindra KS, Oak SM, Rustagi KC. Intensity dependence of Z-scan in semiconductor-doped glasses for separation of third and fifth order contributions in the below band gap region. Opt Commun. 1999;168(1–4):219–225. [Google Scholar]
- 5.Sheik-Bahae M, Hutchings DC, Hagan DJ, van Stryland EW. Dispersion of Bound Electronic Nonlinear Refraction in Solids. IEEE J Quantum Electron. 1991;27(6):1296–1309. [Google Scholar]
- 6.Gómez SL, Cuppo FLS, Figueiredo Neto AM, Kosa T, Muramatsu M, Horowicz RJ. Z-scan measurement of the nonlinear refractive indices of micellar lyotropic liquid crystals with and without the ferrofluid doping. Phys Rev E Stat Phys Plasmas Fluids Relat Interdiscip Topics. 1999;59(3):3059–3063. [Google Scholar]
- 7.Rockwell BA, Roach WP, Rogers ME, Mayo MW, Toth CA, Cain CP, Noojin GD. Nonlinear refraction in vitreous humor. Opt Lett. 1993;18(21):1792–1794. doi: 10.1364/ol.18.001792. [DOI] [PubMed] [Google Scholar]
- 8.Warren WS, Fischer MC, Ye T. Cellular imaging-Novel nonlinear contrast improves deep-tissue microscopy. Laser Focus World. 2007;43:99–103. [Google Scholar]
- 9.Denk W, Strickler JH, Webb WW. Two-photon laser scanning fluorescence microscopy. Science. 1990;248(4951):73–76. doi: 10.1126/science.2321027. [DOI] [PubMed] [Google Scholar]
- 10.Guo Y, Ho PP, Savage H, Harris D, Sacks P, Schantz S, Liu F, Zhadin N, Alfano RR. Second-harmonic tomography of tissues. Opt Lett. 1997;22(17):1323–1325. doi: 10.1364/ol.22.001323. [DOI] [PubMed] [Google Scholar]
- 11.Cheng JX, Xie XS. Coherent anti-Stokes Raman scattering microscopy: Instrumentation, theory, and applications. J Phys Chem B. 2004;108(3):827–840. [Google Scholar]
- 12.Fu D, Ye T, Matthews TE, Chen BJ, Yurtserver G, Warren WS. High-resolution in vivo imaging of blood vessels without labeling. Opt Lett. 2007;32(18):2641–2643. doi: 10.1364/ol.32.002641. [DOI] [PubMed] [Google Scholar]
- 13.Fu D, Ye T, Matthews TE, Grichnik J, Hong L, Simon JD, Warren WS. Probing skin pigmentation changes with transient absorption imaging of eumelanin and pheomelanin. J Biomed Opt. 2008;13(5):054036. doi: 10.1117/1.2976424. [DOI] [PubMed] [Google Scholar]
- 14.Fu D, Ye T, Matthews TE, Yurtsever G, Warren WS. Two-color, two-photon, and excited-state absorption microscopy. J Biomed Opt. 2007;12(5):054004. doi: 10.1117/1.2780173. [DOI] [PubMed] [Google Scholar]
- 15.Isobe K, Kataoka S, Murase R, Watanabe W, Higashi T, Kawakami S, Matsunaga S, Fukui K, Itoh K. Stimulated parametric emission microscopy. Opt Express. 2006;14(2):786–793. doi: 10.1364/opex.14.000786. [DOI] [PubMed] [Google Scholar]
- 16.Fischer MC, Liu HC, Piletic IR, Escobedo-Lozoya Y, Yasuda R, Warren WS. Self-phase modulation signatures of neuronal activity. Opt Lett. 2008;33(3):219–221. doi: 10.1364/ol.33.000219. [DOI] [PubMed] [Google Scholar]
- 17.Fischer MC, Ye T, Yurtsever G, Miller A, Ciocca M, Wagner W, Warren WS. Two-photon absorption and self-phase modulation measurements with shaped femtosecond laser pulses. Opt Lett. 2005;30(12):1551–1553. doi: 10.1364/ol.30.001551. [DOI] [PubMed] [Google Scholar]
- 18.Fischer MC, Liu HC, Piletic IR, Warren WS. Simultaneous self-phase modulation and two-photon absorption measurement by a spectral homodyne Z-scan method. Opt Express. 2008;16(6):4192–4205. doi: 10.1364/oe.16.004192. [DOI] [PubMed] [Google Scholar]
- 19.Fischer MC, Liu H, Piletic IR, Ye T, Yasuda R, Warren WS. Self-phase modulation and two-photon absorption imaging of cells and active neurons. Progress in Biomedical Optics and Imaging - Proceedings of SPIE (SPIE; Bellingham WA, United States. 2007. p. 64421J. [Google Scholar]
- 20.Chapple PB, Staromlynska J, Hermann JA, McKay TJ, McDuff RG. Single-beam Z-scan: measurement techniques and analysis. J Nonlinear Opt Phys Mater. 1997;6(3):251–293. [Google Scholar]
- 21.Wang J, Sheik-Bahae M, Said AA, Hagan DJ, van Stryland EW. Time-resolved Z-scan measurements of optical nonlinearities. J Opt Soc Am B. 1994;11(6):1009–1017. [Google Scholar]
- 22.Guedes I, Misoguti L, De Boni L, Zilio SC. Heterodyne Z-scan measurements of slow absorbers. J Appl Phys. 2007;101(6):063112. [Google Scholar]
- 23.Ménard JM, Betz M, Sigal I, van Driel HM. Single-beam differential z-scan technique. Appl Opt. 2007;46(11):2119–2122. doi: 10.1364/ao.46.002119. [DOI] [PubMed] [Google Scholar]
- 24.Xia T, Hagan DJ, Sheik-Bahae M, Van Stryland EW. Eclipsing Z-scan measurement of λ/10(4) wavefront distortion. Opt Lett. 1994;19(5):317–319. doi: 10.1364/ol.19.000317. [DOI] [PubMed] [Google Scholar]
- 25.Tsigaridas G, Fakis M, Polyzos I, Persephonis P, Giannetas V. Z-scan technique through beam radius measurements. Appl Phys B. 2003;76(1):83–86. [Google Scholar]
- 26.Bridges RE, Fischer GL, Boyd RW. Z-scan measurement technique for non-Gaussian beams and arbitrary sample thicknesses. Opt Lett. 1995;20(17):1821–1823. doi: 10.1364/ol.20.001821. [DOI] [PubMed] [Google Scholar]
- 27.Hillegas CW, Tull JX, Goswami D, Strickland D, Warren WS. Femtosecond laser pulse shaping by use of microsecond radio-frequency pulses. Opt Lett. 1994;19(10):737–739. doi: 10.1364/ol.19.000737. [DOI] [PubMed] [Google Scholar]


