

Abstract
Study Objectives:
Sodium oxybate (SO) is a GABAB agonist used to treat the sleep disorder narcolepsy. SO was shown to increase slow wave sleep (SWS) and EEG delta power (0.75-4.5 Hz), both indexes of NREM sleep (NREMS) intensity and depth, suggesting that SO enhances recuperative function of NREM. We investigated whether SO induces physiological deep sleep.
Design:
SO was administered before an afternoon nap or before the subsequent experimental night in 13 healthy volunteers. The effects of SO were compared to baclofen (BAC), another GABAB receptor agonist, to assess the role of GABAB receptors in the SO response.
Measurements and Results:
As expected, a nap significantly decreased sleep need and intensity the subsequent night. Both drugs reversed this nap effect on the subsequent night by decreasing sleep latency and increasing total sleep time, SWS during the first NREMS episode, and EEG delta and theta (0.75-7.25 Hz) power during NREMS. The SO-induced increase in EEG delta and theta power was, however, not specific to NREMS and was also observed during REM sleep (REMS) and wakefulness. Moreover, the high levels of delta power during a nap following SO administration did not affect delta power the following night. SO and BAC taken before the nap did not improve subsequent psychomotor performance and subjective alertness, or memory consolidation. Finally, SO and BAC strongly promoted the appearance of sleep onset REM periods.
Conclusions:
The SO-induced EEG slow waves seem not to be functionally similar to physiological slow waves. Our findings also suggest a role for GABAB receptors in REMS generation.
Citation:
Vienne J; Lecciso G; Constantinescu I; Schwartz S; Franken P; Heinzer R; Tafti M. Differential effects of sodium oxybate and baclofen on EEG, sleep, neurobehavioral performance, and memory. SLEEP 2012;35(8):1071–1084.
Keywords: Narcolepsy, hypnotic, EEG delta activity, sleep homeostasis, memory
INTRODUCTION
Sodium oxybate (SO, sodium salt of γ-hydroxybutyric acid [GHB]) is an endogenously produced fatty acid, recently approved for the treatment of narcolepsy with cataplexy.1 GHB has been shown to increase slow wave sleep (SWS) and EEG delta power (0.75-4.5 Hz), in a dose-dependent manner in healthy subjects2–4 and in patients with narcolepsy and fibromyalgia.5–7 The physiological increase of SWS and EEG delta power is proposed to represent cortical recovery from prior wakefulness.8,9 Like other restorative functions, sleep is homeostatically regulated. Sleep loss produces proportional increase in the tendency to fall asleep10 and in the EEG delta power during recovery sleep.11 Conversely, an afternoon/evening nap reduces the SWS duration and EEG delta power during the subsequent nocturnal sleep.12 EEG delta power varies as a function of the sleep-wake history in a highly predictive manner not only in humans but in all mammalian species studied so far, and is therefore widely used as a marker of sleep need/intensity.13–15
We recently reported that the increase in EEG delta power produced by γ-butyrolactone (GBL), a GHB-precursor, did not affect physiological sleep regulation in mice.16 This finding is supported by others describing paradoxical EEG delta waves induced by GHB and GHB precursors in waking humans3,17 and animals,18,19 thus challenging the claimed physiological sleep-promoting effects of GHB. The first aim of this study was to investigate whether pharmacological enhancement of EEG delta power and SWS duration with SO affects the homeostatic regulation of sleep in humans. The second aim was to better understand the role of GABAB receptors in response to GHB by comparing SO with another GABAB receptor agonist; i.e., baclofen (BAC). To this end, we used an afternoon nap protocol to decrease sleep pressure during the subsequent night and investigated how EEG delta power and increased SWS duration, induced by GHB and BAC, modulate sleep need/intensity. If SO and BAC indeed produce physiological deep sleep, then naps under these drugs would be expected to show an increased SWS duration and a higher EEG delta power compared to a placebo (PL) condition, and sleep need during subsequent nighttime sleep would be expected to be lower than in a PL condition. On the other hand, when taken before nighttime sleep (i.e., after a PL nap), SO and BAC would be expected to counter the nap’s effects by producing more EEG delta power and SWS duration. Besides sleep and EEG, psychomotor vigilance, subjective alertness and memory were also assessed to further test whether the recuperative value of sleep is increased by SO and/or BAC.
METHODS
Subjects and Procedures
Participants were healthy, right-handed Caucasian males (n = 13; mean age: 23.5 ± 1.6 years; age range: 20-26 years; body mass index range: 18.5-24.8 kg/m2) recruited by a public advertisement at the University of Lausanne (Switzerland) and the Centre Hospitalier Universitaire Vaudois (CHUV, Lausanne, Switzerland). Subjects were paid for participation in this study. They reported no personal or family history of neurologic, psychiatric, or sleep disorders, no recent stressful life events, transmeridian flight, and no medication or illicit drug intake ≥ 2 months before the study. All were nonsmokers or “light” smokers (≤ 5 cigarettes per day), GHB-naive, and reported no excessive consumption of alcoholic beverages and stimulant drinks (e.g., coffee, tea, cola, or energy drinks). Subjects had to be able to refrain from drinking any of these beverages during study days without problem and were allowed to smoke ≤ 3 cigarettes per day, but to refrain from smoking ≥ 3 h before sleep periods. Four subjects out of 13 were light smokers. Their sleep, anxiety and depression questionnaires revealed that they were good sleepers with regular bedtime (23:00-00:00), no subjective sleep disturbance, no anxiety and depression (normal score at: Epworth sleepiness scale, Horne and Ostberg questionnaire [neutral type], and Beck anxiety and depression inventories). Upon reception of their written informed consent, they were screened by brief medical history, physical examination, blood test, and wrist actimetry for 2 weeks, and also for chronic or acute cardiovascular, respiratory, hepatic, or renal diseases. They first performed an assessment session during which they spent 2 nights and a day in the sleep laboratory for diagnostic polysomnography to rule out sleep disorders such as sleep apnea and/or periodic limb movements in sleep (PLMS), and to assess their ability to nap at 15:00. Subjects with an apnea-hypopnea index and/or a PLMS index ≥ 5/h, sleep efficiency < 85%, disturbances in sleep architecture, or unable to nap > 30 min were excluded.
The local ethics committee for research on human subjects and the Swiss federal agency for therapeutic products, Swissmedic, approved the study protocol, which was carried out in accordance with the declaration of Helsinki. The study included 5 weekly sessions of 3 consecutive nights. In each session, the first and the second night served as habituation and baseline (BLN) nights, respectively (Figure 1). The day following the BLN night, subjects stayed in the lab and were instructed to take a nap at 15:00. The third night, referred to as the experimental (EXP) night, concluded each session. For each night, bedtime was scheduled from 23:00 to 07:00. The nap lasted a maximum 2 h but was stopped at the first appearance of REMS after one NREMS episode. If REMS appeared before SWS (stages 3 and 4), the nap was not terminated. If the nap lasted < 30 min and/or did not include SWS, the nap and the subsequent night were excluded from analysis. These criteria served to reduce nap variability. REMS occurrence was minimized because NREMS regulation was the main focus of this study. Standardized meals containing normal fat levels were served to the subjects at specific hours when they were in the lab (Figure 1). No food intake was allowed 2.5 h before nap and nighttime sleep, but a light snack was offered after the nap. During each night and nap, electroencephalogram (EEG), electromyogram (EMG), electrooculogram (EOG), and electrocardiogram (ECG) were recorded. Vigilance and memory were assessed as illustrated (Figure 1).
Figure 1.
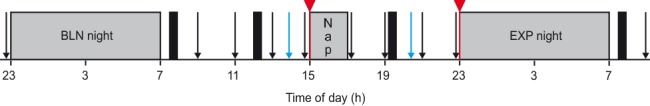
Schedule of a typical study session. Each subject performed 5 sessions, which differed only by the drug treatment condition that they received. Sessions were separated by one week. Subjects started a session with an 8-h habituation night (not shown), spent the day outside the lab, and came back for an 8-h baseline (BLN) night. Before the BLN night, subjects performed vigilance tasks (PVT and KSS, black arrows). The following day, they stayed in the lab executing vigilance tasks every 2 h and 3 memory tasks (blue arrows) before and after a 2-h nap opportunity starting at 15:00. Finally, they spent a last 8-h experimental (EXP) night and left the lab in the morning after having performed the last vigilance tasks. Gray bars indicate times of scheduled sleep periods, and black bars depict mealtimes. In each session, subjects received either 2 placebos (PL) or a placebo and a drug (sodium oxybate [SO] or baclofen [BAC]). Drugs could be administered either before the nap (SO-nap or BAC-nap) or before the EXP night (SO-exp or BAC-exp) (red triangles and lines).
Drugs
A dose of 30 mg/kg of SO (Xyrem, oral solution, 500 mg/mL, USB-Pharma SA, Bulle, Switzerland) and a dose of 0.35 mg/kg of BAC (oral suspension prepared from tablets of Lioresal 10 mg, Novartis-Pharma, Basel, Switzerland) were given once; either before the nap or before the EXP night according to a randomized, placebo-controlled, double-blind, crossover design. Thus, per session subjects received either one drug and one PL or 2 PLs. Specifically, the 5 sessions were abbreviated PL, SO-nap, BAC-nap, SO-exp, and BAC-exp, where the suffix “–nap” and “–exp” were used when the drug was administered before the nap or before the EXP night, respectively. Drugs and PL were taken 5 min before the nap and 5 min before the EXP night of each session (Figure 1).
To avoid side effects occurring minutes after drug administration (i.e., dizziness, sleepiness, nausea and vomiting) as well as side effects occurring hours after drug administration (i.e., sleepiness and drowsiness after the nap), we chose relatively low doses that are nevertheless known to affect sleep.4,20 In healthy adults, the half-life and the median Tmax of SO (oral solution) are 30-50 min and 30-60 min,21 respectively, and of BAC (tablets) 3.8-4.0 h22 and 1.8 h,23 respectively.
Vigilance Assessment
Psychomotor vigilance task (PVT) is a simple visual reaction time task with no learning and virtually independent of aptitude.24 Ten-minute PVT (PVT-192 Psychomotor Vigilance Task Monitor, Ardsley, NY) were performed 15 min before the BLN night, every 2 h during the following day starting at 09:00, and around 1 h after the wake-up time of the EXP night. Before and after a PVT, subjects carried out a Karolinska sleepiness scale (KSS). The KSS is a 9-point rating scale which provides a subjective and momentary measurement of alertness/sleepiness (1 = very alert, 9 = very sleepy).25
Memory Assessment
An unrelated word-pair associate learning task and a 2-D face-location memory task were used to assess declarative memory, while a finger sequence tapping task evaluated procedural memory. The memory test battery was initiated at 14:00.
The unrelated word-pair learning task would benefit particularly from SWS.26–28 Five sets of 36 different French word-pairs, one per session, were chosen randomly from a list of 866 concrete and high imageable French words.29 Words consisted of 4-10 letters and pairs were of low semantic relatedness. They were presented on a computer screen. Subjects were instructed to learn 36 word-pairs by forming a mental association between the two images corresponding to each word-pair. Each pair was presented once for 4 s with an inter-stimulus interval of 100 ms. Immediately after the first run, subjects performed a cued recall; i.e., the first word of each pair was presented for 10 s and they were instructed to type the second word. Visual feedback was given in each case by presenting the correct second word for 2 s independent of their response, to enable re-encoding of the correct word-pair. The first word of the next pair was shown after an inter-stimulus interval of 3 s. At retrieval testing at 20:00, the same cued recall procedure was used as during the encoding phase.
The 2-D face-location memory task was based on a similar task used in a previous study.27 Performance on this type of task relies on temporal lobe structures including the hippocampus30,31; the word-pair learning task benefits from SWS.27 Here we used 10 card-pairs showing pictures of faces (Karolinska Directed Emotional Faces System, KDEF).32 One set of 10 different face-pairs was chosen randomly from the KDEF for each session. Throughout the task, all 20 possible spatial locations are shown in a 4 × 5 matrix as gray squares (i.e., “the back of the cards”) on a computer screen. Subjects were instructed to memorize the 2 locations associated with each individual face. The first face of each face-pair was presented alone for 1 s followed by the presentation of both faces for 4 s. After an inter-stimulus interval of 1 s, the next face-pair was presented in the same way. The whole set of face-pairs was presented once. After this first run, immediate recall of the spatial locations was tested using a cued recall procedure; i.e., the first face of each pair was presented and the subject had to indicate the location of the second face with a computer mouse. Visual feedback was given in each case by presenting the second face at the correct location for 2 s independent of the response, to enable re-encoding of the correct location. After presenting a face-pair, both faces were replaced by gray squares again, so that guessing probability remained the same throughout the run. Feedback was given about the number of correctly recalled face-pairs. At retrieval testing at 20:00, the same cued recall procedure was used as during the encoding phase.
The finger sequence tapping task was adapted from previous studies that indicated a robust sleep-dependent improvement on this motor skill learning task, especially REMS and stage 2.33–35 It requires the subject to press repeatedly one of five 5-element sequences (“1-2-4-3-1,” “2-1-3-4-2,” “3-4-2-1-3,” “4-1-3-2-4,” or “2-3-1-4-2”) on a keyboard with the fingers of the non-dominant hand as fast and as accurately as possible for 30-s epochs interrupted by 30-s breaks. The numeric sequence remained on the screen during the whole experimental session to keep working memory demands at a minimum. Each 30-s trial was scored for speed (number of correctly completed sequences) and error rate (number of errors relative to total number of tapped sequences). Subjects completed twelve 30-s trials. The average score for the last 3 of these trials was used to indicate performance at training. At retest subjects performed another 3 trials, and performance was computed by averaging these 3 trials.
The order of memory tasks at encoding and retest as well as the different sets of word-pairs, face-pairs, and tapping sequences was counterbalanced across subjects and sessions. E-Prime software (Psychology Software Tools, Pittsburgh, PA) was used to design and run word-pair memory task and face-location memory task, while the finger-tapping task was performed using MATLAB R2007a (The MathWorks Inc, Natick, MA). Memory performance on the 3 tasks was calculated for retrieval performance (after the nap) as a percentage of learning performance (before the nap) set to 100%.
Polysomnographic and Actigraphic Recordings
Six EEG channels (F3, C3, O1 and F4, C4, O2 referenced against linked mastoids A2 and A1 respectively), 2 EOG (one to each outer cantus), 2 surface submental EMG electrodes, and one ECG signal were recorded throughout each night and nap of each session in individual bedrooms using Embla N7000 recording system (Embla Systems, Broomfield, CO). Only data from C3-A2 EEG derivation are reported here. Signals were filtered by a high-pass filter (EEG and EOG: −3 dB at 0.5 Hz; EMG: 10 Hz; ECG: 1 Hz), a low-pass filter (EEG: −3 dB at 35 Hz, EMG: 70 Hz), and a notch filter at 50 Hz. Signals were recorded at 100 (EEG, EOG, and ECG) or 200 Hz (EMG). Infrared video was also simultaneously recorded. Raw signals were stored on-line on a computer hard drive and off-line on DVDs and a hard disk. Sleep stages during nights and naps were visually scored by a registered PSG technologist on a 20-s epoch basis (Somnologica Software, Embla systems, Broomfield, CO) according to standard criteria.36 EEG power spectra for consecutive 20-s epochs (average of five 4-s epochs, fast Fourier transform routine, Hamming window, frequency resolution 0.25 Hz) were calculated using MATLAB R2007a (The MathWorks, Natick, MA) and matched with the sleep scores. Movement- and arousal-related artifacts were visually identified and excluded. If > 50% of a 20-s epoch contained artifacts, the entire epoch was removed from the spectral analysis.
NREMS-REMS cycles were defined according to the criteria of Feinberg and Floyd.37 For the completion of the first and the last cycle, no minimal criterion for the REMS duration was applied. Sleep-onset REM period (SOREMP) was defined as ≥ 1 20-s epoch of REMS occurring within the first 18 min of sleep (NREMS stage 1, 2, 3, 4, and REMS). The SOREMP did not contribute to sleep cycle length; i.e., when a SOREMP was present, the first cycle started after the SOREMP according to above-mentioned criteria (succession of a NREMS episode and a REMS episode). At least 3 NREMS–REMS cycles were completed in all night recordings.
Ten days, at least, before the assessment session, 7 days before the beginning of the study and throughout the entire study, an Actiwatch (Mini-Mitter, Bend, OR) was worn by subjects on their left wrist, and a sleep agenda was filled out to control their sleep schedule (23:00-07:00), their sleep quality, and their activity. The Actiwatch sampled activity once per 30 s.
Data Analyses and Statistics
The effect of treatments and nap on sleep variables, the EEG in REMS, NREMS (stage 2 and SWS) and waking, sustained vigilant attention (PVT), subjective alertness (KSS), and memory were analyzed in 13 subjects. Of these, one took antihistamine medication for a rash provoked by a soap allergy. The 2 affected sessions of this subject were excluded (sessions: SO-exp and BAC-nap; for study design see Figure 1). Because of insufficient sleep during naps (< 30 min), 2 sessions of another subject were also excluded from analysis except sleep and EEG data for the 2 baseline nights (sessions: BAC-exp and PL). Finally, the last night of one subject was excluded due to adverse effects provoked by SO (dizziness and anxiety) at the beginning of the night (session: SO-exp). However, after a negative general clinical exam, the subject slept and reported a good night of sleep (monitored). Thus, for the following analysis, we included n = 13, 12, 11, 12, and 12 for SO-nap, BAC-nap, SO-exp, BAC-exp, and PL, respectively; and for analysis including only the nap without the EXP night, n = 13, 12, and 36 for SO, BAC, and PL, respectively. In addition, for all variables tested below, the BLN nights of the 5 conditions (PL, BAC-nap, SO-nap, BAC-exp, and SO-exp) did not significantly differ (P > 0.05). The same was true for the 3 placebos administered before the nap (PL, SO-exp, and BAC-exp), which allowed us to group them as the “PL” condition. Spectral analysis was performed on C3-A2 derivation. Due to large extent of artifacts on A2 for one subject, the trace was not included in the following analysis, reducing the number of subjects for spectral analysis to 12.
To approximate a normal distribution, absolute power densities were log-transformed before statistical tests. The SAS 9.1 statistical software (SAS Institute, Cary, NC) was used. The effects of nap and treatments on sleep variables and the EEG were assessed by a 2-way mixed-model analysis of variance (ANOVA) with the within-subject factors “treatment” (PL, BAC-nap, SO-nap, BAC-exp, and SO-exp) and “night” (EXP and BLN). Sleep cycle and treatment effects on SWS and REMS duration, and EEG frequency ranges were estimated by performing a 2-way mixed-model ANOVA with the within-subject factors “treatment” and “cycle” (1st-3rd) on the BLN and EXP night or on the ratio EXP/BLN (see Results). One-way mixed-model ANOVA with the within-subject factor “treatment” (PL, BAC, and SO) served to evaluate effects of treatment on sleep variables and the EEG during the nap and on memory tasks. Finally, to estimate treatment effects on sustained vigilant attention and subjective alertness, a 2-way mixed-model ANOVA for the within-subject factors “treatment” (PL, BAC, and SO) and “time” (time points when tasks were performed) and a one-way mixed-model ANOVA with the within-subject factors “treatment” at specific time points were used. The significance level was set at P < 0.05. To localize differences within subjects, paired 2-tailed t-tests, Tukey-Kramer tests, or Dunnett-Hsu tests (control = PL) were performed only if main effects or interactions of the ANOVA were significant. Most statistics are indicated in figure legends. EEG power was computed for consecutive 0.25-Hz bins and for specific frequency bands. The frequency bins and bands are indicated by the encompassing frequency ranges (e.g., 0.75-4.5 Hz band denotes 0.625-4.625 Hz).
RESULTS
SO Strongly Affects Nap Sleep
During the scheduled nap, subjects had a sleep episode between 42 and 116 min with an average of 30.1 ± 1.7 min of SWS (range = 3-73 min). Compared to the PL condition, naps under SO showed an increase in total sleep time (TST), sleep efficiency, SWS, and REMS, as well as a decrease in REMS latency and light sleep (NREMS stage 1) (Table 1 and Figure 3C, D). Naps under BAC were intermediate between the PL and SO conditions for sleep variables including SWS (Table 1 and Figure 3C). Moreover, like SO, BAC increased sleep efficiency and decreased light sleep compared to PL (Table 1). These results confirmed previous nap results in drug-free conditions12 and suggest that SO, during the nap, promotes deep sleep, while there is only a tendency for BAC.
Table 1.
Sleep variables during the nap after placebo (PL), baclofen (BAC), or sodium oxybate (SO) administration

Figure 3.

SWS and REMS during the three first sleep cycles of the nighttime sleep and during the nap. (A) During the 1st cycle of the EXP night, SWS was decreased in the PL, SO-nap and BAC-exp conditions, but did not differ from the BLN night in the BAC-nap and SO-exp conditions (left panel: 2-way mixed-model ANOVA for factors “night” P = 0.0001, “treatment” P < 0.03, and their interaction P = 0.05; connected lines: Tukey-Kramer test by treatment for factor “night” P < 0.05). Moreover, SWS was significantly higher when SO was given before the EXP night compared to the PL condition. Overall, during the 2nd and the 3rd cycle, SWS was significantly lower in the EXP night compared to the BLN night (2-way mixed-model ANOVA for factors “night” P < 0.05, “treatment” P > 0.1 and their interaction P > 0.6; paired t-test: factor “night” P < 0.05). (B) REMS was significantly higher in the EXP night compared to the BLN night for the 1st cycle only (left panel (1st cycle): 2-way mixed-model ANOVA for factors “night” P < 0.0001, “treatment” P > 0.4, and their interaction P > 0.4). Interestingly, the SO-exp condition was the unique condition which did not show a significant increase in REMS during the EXP night compared to the BLN night (Tukey-Kramer test by treatment for factor “night” P < 0.05). Moreover, in the 2nd cycle, this same treatment condition exhibited a shorter duration of REMS than the BLN night (1-way mixed-model ANOVA for the PL-SO condition: factor “night” P = 0.002). (C) During the nap, SO increased SWS compared to PL but not compared to BAC (1-way mixed-model ANOVA for factor “treatment” P < 0.03; Tukey-Kramer test P < 0.05). (D) Naps were stopped when REMS was visually identified except when it was a SOREMP (see Materials and Methods and Figure 2). Only SO and BAC treatments showed a significant increase of REMS duration (paired t-tests P < 0.05:*) due to SOREMPs. SO induced a longer duration of REMS than BAC and PL (1-way mixed-model ANOVA for factor “treatment” P < 0.0001, Tukey-Kramer test P < 0.05). For all panels, bars depict the mean values of each variable (mean ± SEM; n = 12-13).
Interestingly, several cases of SOREMP (i.e., REMS latency < 18 min) were observed particularly under drug treatment (SO: 8/13 naps [62%], BAC: 5/12 naps [42%], and PL: 7/36 naps [19%]). The subjects exhibiting a SOREMP were allowed to sleep until the beginning of the following REMS episode or until the end of the 2-h sleep opportunity. For 4 naps out of a total of 61, subjects had to be awakened without having terminated a complete NREMS episode. All 4 had a long SOREMP (30-50 min) and were under SO. These naps were included in the analysis because subjects slept efficiently with a sufficient SWS duration (sleep latency: 7-8 min, SWS duration: 36-73 min, and sleep efficiency > 92%).
The number and duration of SOREMPs were higher in naps under SO than PL. Number of SOREMPs in naps under BAC was intermediate between the 2 other treatments, whereas duration of SOREMPs was lower in the BAC and PL conditions than in the SO condition (Figure 2B, C and Table 1). As a result, average REMS latency was lower in the SO condition than in the BAC and PL conditions. It is noteworthy that REMS duration during these naps reflects the duration of SOREMPs because naps were stopped at the end of the first NREMS episode at the first appearance of REMS (Figure 3D and Table 1). Moreover, the SOREMPs were not entirely responsible for the longer time in bed (TIB) or TST observed in the SO condition compared to the PL condition, because naps under SO showed also a significantly longer SWS duration than naps under PL (Table 1).
Figure 2.
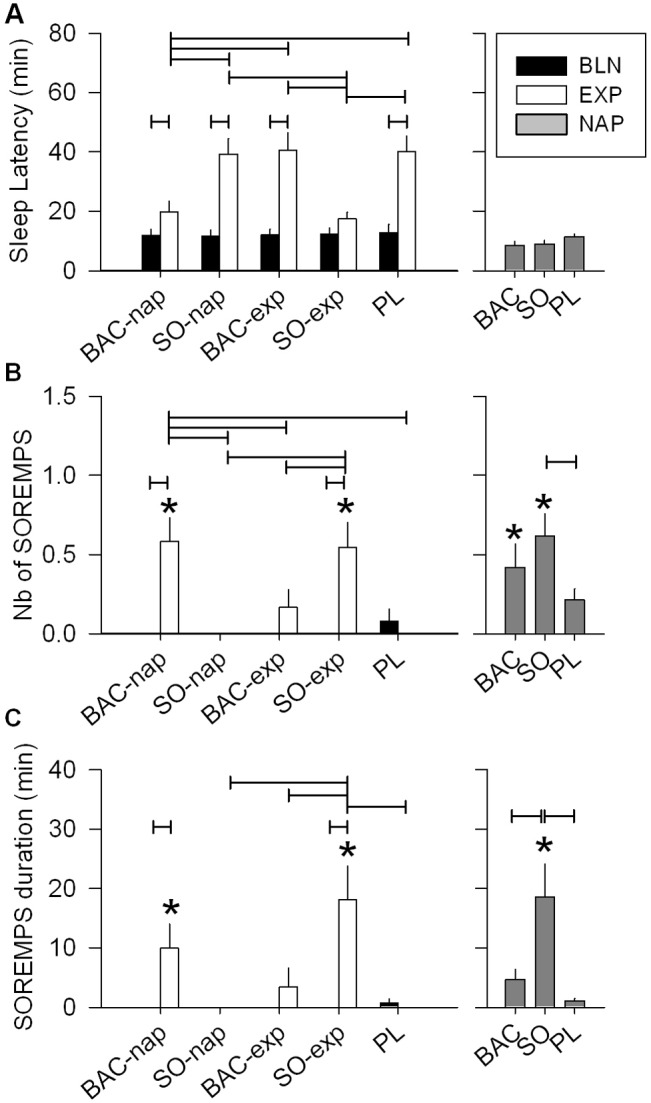
Condition and treatment effects on sleep parameters. (A) The afternoon nap increased sleep latency during the following night (EXP night) compared to the baseline (BLN) night in all treatment conditions (left panel: 2-way mixed-model ANOVA for factors “night” P < 0.0001, “treatment” P < 0.0001, and their interaction P < 0.0001; connected lines: Tukey-Kramer test by treatment, P < 0.05). However, this increase was strongly reduced when BAC was administrated before the nap or SO before the EXP night (connected lines: Tukey-Kramer test by night, P < 0.05). This treatment difference was not seen during the nap (right panel: 1-way mixed-model ANOVA for factor “treatment,” P = 0.1). During nights, number (B) and duration (C) of sleep onset REM periods (SOREMPs) were affected both by drug treatment condition and night (left panel: 2-way mixed-model ANOVA for factors “night” P < 0.0001, “treatment” P < 0.0006, and their interaction P < 0.0003). Only BAC administrated before the nap (BAC-nap) and SO given before the EXP night (SO-exp) showed significant occurrence and increased duration of SOREMPs during the EXP night (paired t-tests P < 0.05, star). Moreover, they showed, respectively, a significant increase in number and a longer duration of SOREMPs compared to the PL condition as well as the BAC-exp and SO-nap conditions (Tukey-Kramer test, P < 0.05). During the nap, number and duration of SOREMPs were affected by the treatment conditions (right panel: 1-way mixed-model ANOVA: factor “treatment,” Tukey-Kramer test, P < 0.05). SO significantly augmented SOREMP number and duration compared to PL, and PL and BAC, respectively. For all panels, bars depict the mean (+1SEM, n = 12-13) values of each variable, connected lines result from Tukey-Kramer test, P < 0.05 and the BLN night of each treatment condition did not differ significantly for any of the variables.
SO and BAC Counteract the Effects of a Nap on the Following Night Sleep
As expected, an afternoon nap under PL condition decreased TST, sleep efficiency, and SWS, but increased sleep latency, arousal variables, and light sleep (wakefulness after sleep onset and NREMS stage 1) during the subsequent nighttime sleep (EXP night; Table 2 and also12). SO administered before the EXP night (SO-exp) and BAC before the nap (BAC-nap) induced very similar changes during the EXP night. Sleep latency in the SO-exp condition was not increased compared to the BLN night, and the BAC-nap condition showed the same tendency (Figure 2A). TST during the EXP night in the BAC-nap condition was unchanged compared to the BLN night and significantly higher to all other treatments except SO-exp (Tukey test, P < 0.05; Table 2). The decrease of SWS in the first cycle of the EXP night found in the PL condition was not present in the SO-exp and BAC-nap conditions (Figure 3A). Together, this suggests that the 2 conditions (BAC-nap and SO-exp) not only countered the effect of the nap on sleep latency but also on TST and SWS in the first cycle of the EXP night. Although BAC administered before the EXP night (BAC-exp) did not significantly affect SWS in the first cycle compared to the PL condition, it increased SWS over the entire night (Table 2). Moreover, BAC effects on sleep administered before the nap (BAC-nap) were only minor during the nap but strong during the subsequent night (Table 1), and BAC administered before the night (BAC-exp) had no effect at the beginning of the EXP night (sleep latency and SOREMP) but increased SWS duration and tended to increase TST and sleep efficiency in the whole night (Table 2). Together, these observations suggest that BAC has a delayed action.
Table 2.
Sleep variables in baseline (BLN) and experimental (EXP) night for the 5 different treatment conditions
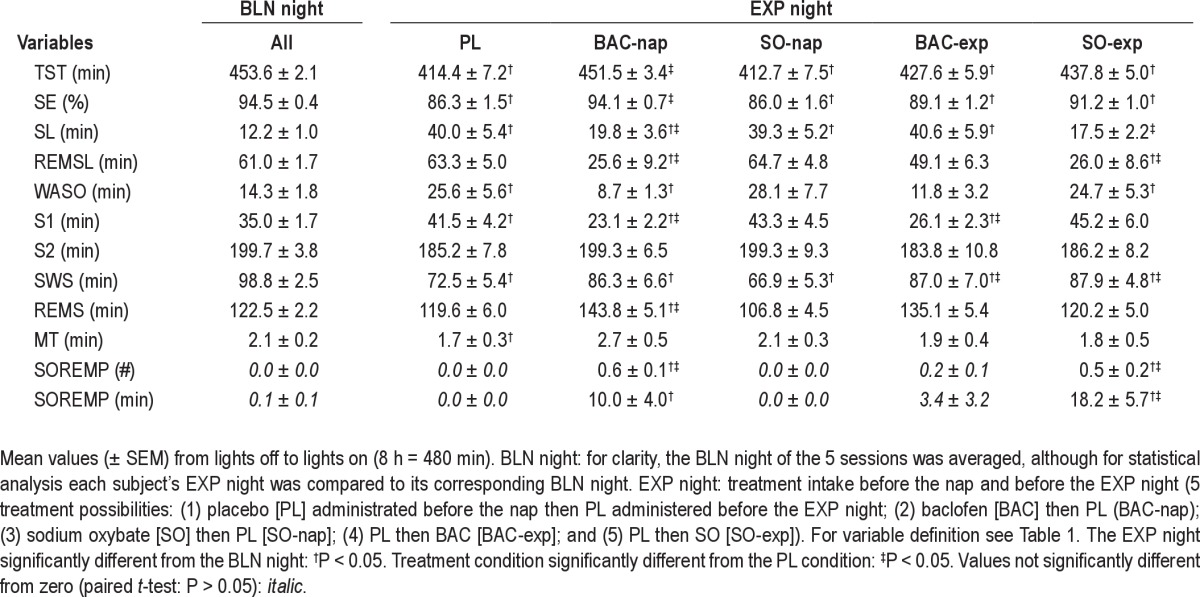
Additional evidence for delayed action of BAC was obtained when comparing the effects of SO and BAC treatment on the duration and dynamics of REMS during the EXP night. BAC administered either before the nap or before the EXP night increased REMS duration during the entire EXP night compared to the BLN night (significant for both treatments if REMS is expressed as a percentage of TST, see also Table 2). In the BAC-nap and BAC-exp conditions, the difference between the EXP and BLN nights appeared 30 and 90 min after sleep onset, respectively, and at the end of the sleep period (accumulation of REMS 6.5 h after sleep onset); this difference in REMS duration reached an average of 20 and 29 min, respectively (data not shown; note that SOREMPs were included). On the other hand, SO-exp condition significantly increased REMS duration at the beginning of the night (SOREMPs; Figure 2C), but then decreased it (cycle 1 and 2; Figure 3B). Thus, the overall mean REMS duration did not differ (Table 2; no significant difference also if REMS is expressed as a percentage of TST or if its accumulation is calculated 6.5 h after sleep onset [data not shown]).
The BAC-nap and SO-exp conditions significantly induced SOREMPs in the beginning of the EXP night compared to the BLN night (paired t-test: P < 0.05) and the PL condition (Figure 2B, C and Table 2). Moreover, in the EXP night, the SO-exp condition significantly increased the duration of SOREMPs compared to the PL condition (Figure 2B, C and Table 2). This increase of SOREMPs after the SO-exp and BAC-nap conditions was also reflected in the decrease of REMS latency (Table 2). Although few SOREMPs were found in the BAC-exp condition, the number and duration did not significantly deviate from zero. A total absence of SOREMPs was found only in the PL and SO-nap conditions (number of SOREMPs by treatment condition: SO-nap, 0/13 [0%]; PL, 0/12 [0%]; BAC-exp, 2/12 [17%]; SO-exp, 6/11 [55%]; BAC-nap, 7/12 [58%]; for statistics see Figure 2). In contrast, only 1 of the 63 BLN nights exhibited a short SOREMP (9 min; PL [1/12]), and the overall number of SOREMPs in the BLN night did not differ from zero (Table 2). Thus, our study clearly demonstrates that both SO and BAC induce SOREMPs.
Note that for all sleep variables tested during the EXP night, the SO-nap condition did not significantly differ from the PL condition, suggesting that the strong SO effects on sleep during the nap did not affect subsequent nocturnal sleep.
SO and BAC Significantly Affect NREMS EEG
To characterize the effects of naps and drug treatments on sleep quality and on the homeostatic regulation of sleep, the spectral composition of the EEG in NREMS (stage 2 and SWS) was quantified. Only results on low frequencies (i.e., delta, theta, and sigma power: 0.75 to 15 Hz), which were most relevant for this study, are discussed here. A nap under placebo reduced EEG power in delta and theta frequency ranges (0.75-7.25 Hz) and enhanced EEG power at 12.5 Hz (i.e., in the sigma range) during the subsequent night (Figure 4A). The largest differences were present in the first cycle for delta, theta, and sigma power (cycle 1: Figure 5A-C). According to the homeostatic process of sleep,12 delta but also theta power decreased within the course of sleep for both the BLN and EXP nights. Delta and theta power were reduced in the EXP night due to the nap, while sigma power was increased during the first cycle (Figure 5C). Overall, the results in the PL condition were expected and are supported by previous nap studies performed without drug administration.12,38
Figure 4.

EEG power spectra of NREMS and REMS during nighttime sleep and during the nap. (A) To quantify the effect of a nap on the subsequent sleep (the EXP night), the ratio of absolute NREMS spectra in the EXP and BLN nights for the PL condition (EXP/BLN) was calculated yielding to a relative NREMS spectrum where 100% represents the BLN night. Relative NREMS spectrum differed significantly among nights and frequencies (2-way mixed-model ANOVA for factors “night” P < 0.05, “frequency bin,” P < 0.0001, and their interaction P = 1.0. Low frequency bins (0.75-7.25 Hz) were significantly lower and a bin from the sigma band (12.5 Hz) as well as overall high frequency bins (17.5-25 Hz) were significantly higher during the EXP night compared to the BLN night (black triangles: one-way mixed-model ANOVA by “frequency bin” for factor “night” P < 0.05) (B) The REMS ratio EXP/BLN in the PL condition. Relative REMS spectrum did not differ significantly between nights (2-way mixed-model ANOVA for factors “night” P > 0.1, “frequency bin” P < 0.0001, and their interaction P = 1.0). (C, D) To illustrate the comparison of each treatment condition to the PL condition, relative NREMS and REMS spectra of each drug treatment condition (EXP/BLN) were expressed as a percentage of relative NREMS spectrum of the PL condition depicted in A andB,respectively. Relative NREMS and REMS spectra during the EXP night were affected by treatment condition and by frequency bin (2-way mixed-model ANOVA: factors “treatment” P < 0.0001, “frequency bin” P < 0.0001, and their interaction P < 0.0001). Overall, the BAC-nap, BAC-exp and SO-exp conditions differed significantly from the PL condition, while the SO-nap condition did not (Dunnett-Hsu test [control = PL] P < 0.05). Colored triangles depict frequency bins for which power differed significantly from the PL condition (Dunnett-Hsu test P < 0.05, blue: BAC-nap [Bn], gray: BAC-exp [Be] and red: SO-exp [Se]). (E) During the nap relative NREMS spectra after the SO and BAC treatments were expressed as a percentage of the PL treatment. Overall, relative NREMS spectrum of the SO treatment was different from that of the PL treatment, while that of the BAC treatment did not differ from the 2 others (2-way mixed-model ANOVA for factors “treatment” P < 0.0001, “frequency bin” P < 0.0001, and their interaction P = 0.016; Dunnett-Hsu test P < 0.05). Triangles illustrate frequency bins for which power differed significantly from the PL treatment (Dunnett-Hsu test P < 0.05, red: SO [Sn]). For each panel, lines depict the mean values (± SEM; n = 12).
Figure 5.
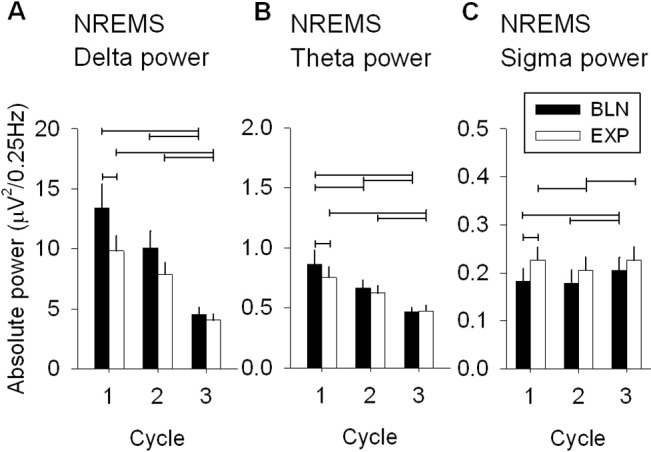
Absolute EEG delta, theta and sigma power in NREMS during the three first cycles of nighttime sleep in the PL condition. To quantify the nap effects on the subsequent nighttime sleep (EXP night) in the PL condition, absolute power derived from the average of 0.25 Hz bins included in the specific frequency range, i.e., delta (0.75-4.5 Hz), theta (4.75-8 Hz), and sigma (12-15 Hz), was calculated in the BLN and EXP nights (mean + 1SEM: n = 12). (A) Absolute delta power of NREMS during the 3 first cycles of the BLN and EXP nights for the PL condition differed significantly between nights and cycles (2-way mixed-model ANOVA: factors “night” P = 0.0038, “cycle” P < 0.0001, and their interaction P > 0.5). (B) As delta, absolute theta power of NREMS differed significantly between nights and cycles (2-way mixed-model ANOVA for factors “night” P = 0.007, “cycle” P < 0.0001, and their interaction P > 0.4) (C) Similar result for absolute sigma power of NREMS (2-way mixed-model ANOVA for factors “night” P = 0.0002, “cycle” P < 0.0001, and their interaction P > 0.1). For each panels, connected lines depict differences among cycles (1, 2, 3; Tukey-Kramer test P < 0.05) and between nights (BLN, EXP: paired t-test, P < 0.05).
To evaluate the effect of SO and BAC on the EEG, all drug treatment conditions were compared to the PL condition (ratio EXP/BLN of each drug treatment condition was expressed as a percentage of the ratio EXP/BLN of the PL condition; Figure 4C). During the EXP night delta and theta power increased in the SO-exp, BAC-nap, and BAC-exp conditions (0.75-7.25, 0.75-9.25, and 1.25-9.25 Hz, respectively). Moreover, the BAC-nap condition also decreased sigma power at 13.5 Hz.
To access the EEG dynamics during NREMS in the 3 frequency ranges, changes in delta, theta, and sigma power were analyzed during the first 3 cycles. The largest drug effects were present in the first cycle. The BAC-nap and SO-exp conditions significantly enhanced delta and theta power, while reducing sigma power during the first cycle (P < 0.05; Figure 6A-C). Already in the second cycle, effects of treatment conditions no longer differed from the PL condition. It is, however, interesting to note that delta power in the second cycle tended to increase (though not reaching significance levels) in the BAC-exp condition, suggesting that BAC took longer to affect the EEG than SO (Figure 6A). As in the sleep duration analysis (see above), spectral analysis supports the notion that BAC has a delayed action.
Figure 6.

EEG delta, theta, and sigma power in NREMS and EEG delta and theta power in REMS during the first three sleep cycles: drug treatment conditions vs. placebo. Relative EEG delta (0.75-4.5 Hz), theta (4.75-8 Hz), and sigma (12-15 Hz) power (mean ± SEM; n = 12) correspond to the EXP/BLN night ratio of each drug treatment condition expressed as a percentage of the EXP/BLN night ratio of the PL condition in the 3 first cycles of nighttime sleep. This illustrates the difference between each drug treatment condition and the PL condition for specific frequency ranges. (A, B, C) Only in the 1st cycle, the BAC-nap and SO-exp conditions showed increased relative delta and theta power and decreased relative sigma power compared to the PL condition, except for the BAC-exp condition which showed a significant increase of theta power in the 3rd cycle (1-way mixed-model ANOVA by cycle for factor “treatment” P < 0.05; Dunnett-Hsu test [control = PL] P < 0.05: star). (D) In REMS, compared to the PL condition, relative delta power for the SO-exp condition increased during the 1st cycle, while it increased for the BAC-exp condition during the 2nd cycle and 3rd cycle (one-way mixed-model ANOVA by cycle for factor “treatment” P < 0.05; Dunnett-Hsu test [control = PL] P < 0.05: star). (E) Relative theta power in REMS increased for the BAC-nap and SO-exp conditions during the 1st cycle and increased for the BAC-exp condition during the 2nd and 3rd cycles (for statistical tests see D).
During the nap, SO, but not BAC, differed from PL. SO enhanced delta and theta power (0.75-10.0 Hz) and reduced sigma power (13.75-14.75 Hz; Figure 4E). The strong effects of SO on delta and theta power and SWS duration during the nap did not alter subsequent nocturnal sleep, suggesting that the homeostatic regulation of sleep was not affected by SO, and thus, that SO did not produce physiological sleep.
SO and BAC Significantly Affect REMS and Waking EEG
Similar to NREMS, a spectral analysis was performed for the REMS EEG. Overall, in the PL condition, a nap did not affect the REMS spectral profile (Figure 4B). In the EXP night, the SO-exp, BAC-nap, and BAC-exp conditions increased delta and theta power (2.5-6.75, 0.75-8.25, and 1.25-8.25 Hz, respectively) during REMS as compared to the PL condition (Figure 4D). During the first cycle, delta power was enhanced in the SO-exp condition, while in the BAC-exp condition, delta power was increased during the second and the third REMS episodes (Figure 6D). The SO-exp and BAC-exp conditions showed similar effects on theta power as on delta power. The BAC-nap condition showed a significant increase in theta power compared to the PL condition in the first cycle and a similar tendency for the second and third cycles (Figure 6E). This suggests, once more, that BAC had a delayed and long-lasting effect (Figure 6D, E), and that the drug-induced increase in theta and delta power was not specific to NREMS.
To verify whether drug treatments also affected the waking EEG, spectral analysis was performed for the waking epochs recorded during the EXP nights and were then compared to the PL condition. As for the NREMS and REMS EEG, delta and theta power in several frequency bins was increased in SO-exp and BAC-nap conditions, again indicating that the EEG effects of both drugs were not restricted to NREMS (supplementary data, Figure S1).
The spectral results discussed above were based on the central EEG derivation C3-A3, the most common derivation analyzed in sleep studies. Analyses of frontal and occipital derivations (F3-A2 and O1-A2) yielded similar results (data not shown), indicating that the findings shown were not site specific.
Sustained Attention and Subjective Sleepiness Are Not Affected by SO and BAC
Laboratory experiments have indicated that afternoon naps improve subjective alertness and cognitive performance in young adults.39 Thus, to quantify the effects of a nap with or without drugs on sustained attention and alertness, we compared the trial performed just before the BLN night with that just before the EXP night (Figure 7A, C and Figure 1). Mean and the 10% fastest PVT reaction times (RTs) and the KSS scores were decreased during the trial performed just before the EXP night (Figure 7A, C, only a tendency for mean RT). By comparing each treatment separately, this increase of alertness and attention was significant for the 10% fastest RT in all treatment conditions, and for the KSS scores for the BAC condition only. Therefore, in general the nap increased sustained attention and subjective alertness late in the evening independent of the drug treatment during the nap.
Figure 7.
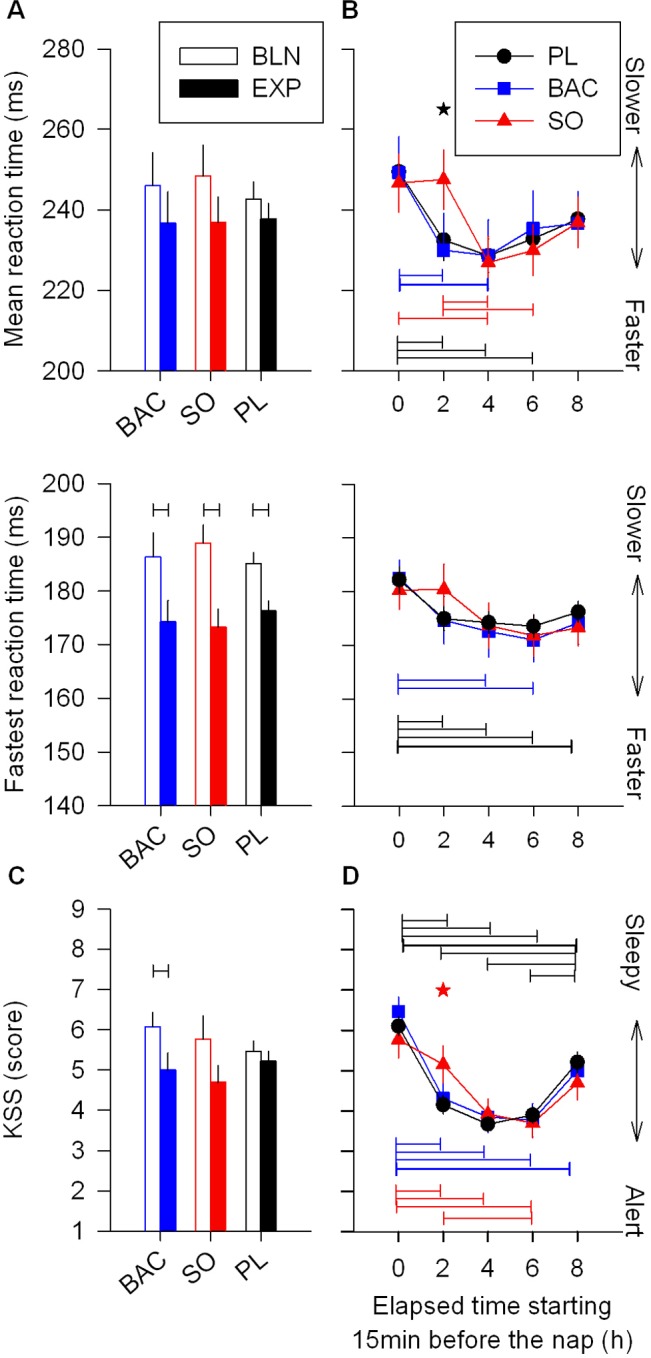
Effects of nap with or without drug on sustained attention and subjective alertness. Objective measurement of cognitive performance was assessed by 10min psychomotor vigilance task (PVT) and subjective alertness by Karolinska Sleepiness Scale (KSS). (A) Mean and the 10% fastest reaction times (RT) are plotted for the trial performed 15 min before bedtime for the BLN and EXP nights (upper and middle panel, respectively). The 10% fastest RT were affected by the nap but not by treatment (2-way mixed-model ANOVA for factors “trial” P < 0.0001, “treatment” P = 1.0, and their interaction P > 0.1). A trend was also observed for the mean RT (factor “trial” P = 0.07). Black connected lines depict RT difference before the BLN and EXP nights (1-way mixed-model ANOVA for factor “time” by treatment; paired t-test P < 0.05). (B) Mean and the 10% fastest RT were plotted at 5 consecutive trials with the first trial performed just before the nap (hour 0) and the last trial just before the EXP night (hour 8). Generally, sustained attention was not affected by treatment, but was affected at the time the trial was carried out (for the 3 panels: 2-way mixed-model ANOVA for factors “time” P ≤ 0.0002, “treatment” P > 0.5, and their interaction P > 0.3). However, by analyzing each trial separately, SO treatment differed significantly from the 2 other treatments only at the trial just after the nap (1-way mixed-model ANOVA for factor “treatment” by trials; Tukey-Kramer test P < 0.05: black star). Colored connected lines show RTs, that are significantly different within the same treatment (Tukey-Kramer test P < 0.05): black: PL, blue: BAC and red: SO). (C) Although independently of the treatment, the KSS score was increased during the trial performed just before the EXP night compared to the trial performed just before the BLN night (2-way ANOVA for factors “trial” P = 0.001, “treatment” P > 0.6 and their interaction P > 0.1). Analysis done by treatment separately showed that only BAC treatment exhibited a significant increase of subjective alertness (black connected lines: 1-way mixed-model ANOVA for factor “time” by treatment; paired t-test P < 0.05). (D) Similar to results obtained with PVT, subjective alertness obtained by KSS was not generally affected by treatment, but by trial time (2-way mixed-model ANOVA for factors “time” P < 0.0001, “treatment” P > 0.1, and their interaction P = 0.9). Moreover, alertness after the nap was also transiently altered by SO compared to PL (red star: 1-way mixed-model ANOVA for factor “treatment” by trial; Tukey-Kramer test P < 0.05). However, this was not significantly different between SO and BAC treatments P > 0.1. For all panels, bars depict the mean values of each variable (mean ± SEM; n = 12-13).
To evaluate the effects of a nap under SO or BAC on sustained attention and subjective alertness compared to those of a nap under PL, we analyzed the time course of the mean and the 10% fastest RTs, and KSS scores starting with the trial performed just before the nap and ending with the trial performed just before the EXP night (Figure 7B, D and Figure 1). Variables quantifying sustained attention (10% fastest RTs) and subjective alertness (KSS) differed by trial but not by treatment (2-way mixed-model ANOVA). Overall, the data indicated a fast increase in attention and alertness just after the nap, followed by a plateau and then a slow and slight decrease until the end of the evening. Interestingly, by comparing the 3 treatments administered before the nap for each trial separately, only the trial after SO nap differed significantly for mean on PVT as well as the KSS scores (Figure 7B, D). Thus, the nap under SO did not show the increase of sustained attention and subjective alertness associated with the nap in the other conditions (P < 0.05, but note that for the KSS score only PL differed significantly from SO; see Figure 7). However, 2 hours later this effect disappeared, suggesting that SO only slightly and transiently negatively affected sustained attention and subjective alertness.
Even though the trial after the nap was performed ≥ 15 min after awakening, naps under SO were significantly longer than naps under BAC and PL (see Table 1), and increased sleep inertia might have contributed to the lower psychomotor performance and subjective alertness under SO.40 This possibility was tested by correlating TST during the nap with the PVT mean RTs (the most affected variable). No correlation was found except for the BAC condition (R2 = 0.47, P = 0.01). It is noteworthy that the number of lapses was also analyzed for the PVT but no significant difference was found among treatments.
A Nap with or without SO or BAC Improves Memory Performance
Growing evidence demonstrates that sleep plays an important role in the consolidation of both procedural and declarative memories.41,42 Not only nocturnal sleep but also daytime naps can improve memory performance.33,43,44 On average, for each task, subjects reached ~60% of correct responses at initial encoding and there was no significant difference among treatments (BAC, SO, and PL; data not shown). As expected for the PL condition,27,43 performance on the unrelated word-pair task and the finger-sequence tapping task was increased after the nap (P < 0.05; Figure 8A, B), while for the face-location memory task, subjects did not show any improvement (P > 0.05; Figure 8C). Accuracy (error rate) of the finger-tapping task was similar during training and retest (data not shown). A nap under SO or BAC did not differently affect any of the tested memory variables compared to a nap under PL (Figure 8 A-C).
Figure 8.
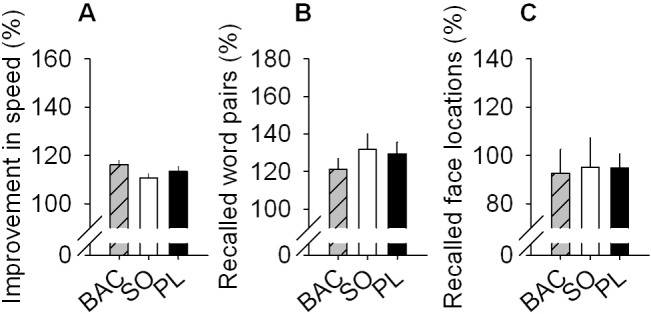
SO and BAC do not affect global memory performance. Improvement in performance on the finger sequence tapping task (A), the unrelated word-pair learning task (B),and the 2-D face-location memory task (C) is shown for the 3 different treatments administered before the nap: BAC, SO, or PL. None of these tasks shown significant difference among treatments (1-way mixed-model ANOVA for “treatment” P > 0.05). For all panels, bars depict the mean values of each variable (mean +1SEM). Memory performance on the 3 tasks is calculated as percentage of performance at retrieval, with performance at encoding before the nap set to 100%.
DISCUSSION
To evaluate the potential of SO to promote deep sleep, we used a nap study to challenge sleep pressure and intensity. We showed here that SO decreases sleep latency under reduced sleep pressure conditions, produces SOREMPs, and strongly increases EEG delta and theta power in NREMS, REMS, as well as in wakefulness. SO countered the reduction of sleep pressure induced by an afternoon nap. Moreover, the SO-induced increase in EEG delta power during the nap, did not affect EEG delta power the following night sleep, suggesting that the delta activity produced by SO does not interfere with the homeostatic regulation of sleep. Thus, SO-induced slow waves seem to functionally differ from those produced during physiological sleep.
The unexpectedly large delayed action of BAC did not allow us to conclude whether or not BAC affects the homeostatic process of sleep. However, results showed that the effects of BAC and SO were similar for most EEG and sleep variables, particularly obvious when the BAC-nap condition was compared to the SO-exp condition. As BAC is a specific agonist of GABAB receptors, these results strongly suggest that the effects of SO in humans depend primarily on GABAB receptor stimulation. Differences in action dynamics and affinity for GABAB receptors with their auxiliary subunits16,45,46 may explain the differences observed between the two drugs. Indeed, GHB is a full, low-affinity agonist and BAC a full, high-affinity agonist of GABAB receptors.45
Although increases in SWS and delta power are associated with increased performance in declarative memory task,26 we did not find any change in memory consolidation with a nap under either SO or BAC when compared to PL. Similarly, subjective and objective vigilance were improved by a nap, but not affected by the two drugs, although SO blocked slightly and transiently the increase of vigilance observed after the nap. This transient effect seems inherent to SO rather than mediated indirectly through sleep inertia. Thus, overall, memory, neurobehavioral performance, and subjective alertness were not affected by SO and BAC, which may further support the “non-physiological” sleep produced by both drugs.
Our findings imply that induction of physiological deep sleep does not seem to be the mechanism by which SO improves narcolepsy symptoms such as decreasing daytime sleepiness. However, it cannot be excluded that narcolepsy subjects may respond differently than healthy volunteers, and that a chronic administration of higher doses of SO may differ from our acute administration of a relatively low dose of SO.
SO Strongly Affects the EEG But Does Not Induce Physiological Sleep
SO given before the EXP night strongly decreased sleep latency and increased TST, sleep efficiency, and SWS in the first cycle compared to PL. Except for the effects on sleep latency, these findings are very similar to the results obtained during the nap under SO. Also, the EEG was similarly affected by SO under both conditions. The observed increase in EEG delta and theta power in NREMS is consistent with a recent report.47 We found, however, that these effects were not specific to NREMS but also present in REMS and, to some extent, in wakefulness. This suggests a pharmacological EEG effect of SO rather than an induction of physiological SWS, with a high prevalence of delta and theta waves restricted to NREMS. Moreover, the enhanced EEG delta power induced by SO during the nap did not affect post-nap sleep. Although this lack of effect of a nap under SO on the subsequent sleep might be due to a floor effect (i.e., EEG delta power in the EXP night could not be reduced more than that reached in the PL condition), this possibility seems unlikely because delta power during the subsequent night showed the typical decline across cycles, indicating that lower levels can be reached. Furthermore, even after a 2-h nap ending only 3 h prior to bedtime (instead of the 6 h in the present study), the dynamics of EEG delta power during subsequent nighttime sleep did not show any evidence for such floor effect.12
Thus, although SO acutely consolidates and deepens sleep these effects have no bearing on the homeostatic regulation of sleep. This is consistent with what we recently reported in mice.16 Interestingly, our results in mice and humans contrast with a recent study47 showing that administration of SO during sleep restriction decreased the rebound of EEG delta power during recovery night, leading to the conclusion that SO is involved in the homeostatic process of sleep. This discrepancy might be due to the differences in experimental conditions (low vs. high sleep pressure). Moreover, only the NREMS EEG spectrum was analyzed in that study, and therefore the specificity of the effects could not be addressed.
SOREMPs Are Induced by Drugs Targeting GABAB Receptors
An effect shared by BAC and SO was the increased occurrence of SOREMPs. First, although somewhat unusual for healthy volunteers, SOREMPs were found also under the PL condition, mainly during the nap. The occurrence of SOREMPs in healthy volunteers has been reported by others.12,48–51 The factors influencing the occurrence of SOREMPs in the general population are scarcely studied and deserve to be investigated, because SOREMPs are generally believed to be pathologic.49
During the nap, the incidence and duration of SOREMPs was increased with SO compared to the PL condition. During the EXP night, both the BAC-nap and SO-exp conditions showed a higher SOREMP incidence with a longer duration compared to the BAC-exp condition and the BLN night with a SOREMP. As a result, REMS latency was reduced with SO treatment during the nap and for EXP night following the SO-exp and BAC-nap conditions. This confirms a delayed effect of BAC and the similarity between SO-exp and BAC-nap conditions. To our knowledge, increased incidence of SOREMPs has not been reported previously, and SOREMP observation after SO administration has been rare.2,17 Thus, stimulation of GABAB receptors seems to induce SOREMPs, perhaps by modulating the dopaminergic system,52,53 which is known to play a role in REMS.54 However, SOREMPs induced by both SO and BAC may differ from normal REMS and reflect a specific pharmacological state.
BAC Has a Delayed Action and Shares Most of the Sleep and EEG Effects of SO
BAC shares many of the effects of SO on sleep and the EEG, albeit with a delayed action, which is consistent with our previous findings in mice.16 BAC taken before the nap tended to increase SWS and TST during the nap, but these effects were far more pronounced during the subsequent nighttime sleep when sleep latency was decreased and TST, sleep efficiency, and SWS in the first NREMS episode were increased. SO induced very similar effects only when administered immediately prior to sleep. The delayed effect of BAC was also evident at the EEG level; when administered before the nap, it slightly affected the NREMS spectrum during the nap, but had strong effects on delta and theta activity during subsequent sleep similar to the EEG changes induced by SO during the nap and SO during the EXP night. Consistent with a delayed action of BAC, EEG delta and theta power were also increased in the BAC-exp condition but tended to be more pronounced from the second cycle of the sleep episode, and TST, sleep efficiency, and sleep latency were less affected than BAC-nap. Interestingly, despite the strong hypnotic-like effects of the BAC-nap condition observed during the EXP night, neither vigilance nor memory was reduced during the waking period between the nap and the EXP night. Together, the properties of BAC on sleep and EEG appear to be of clinical relevance for the treatment of several sleep disorders, including insomnia and deserve further investigations.
GABAergic Receptors Play a Key Role in EEG Slow Wave Generation
Interestingly, the delayed action of BAC on sleep duration does not seem to be GABAB–receptor mediated, since similar findings were observed in GABAB–receptor deficient mice.16 This effect is not readily explained since BAC is nearly completely excreted unchanged except for small amounts of a metabolite (i.e., β-(p-chlorophenyl)-γ-hydroxybutyric acid) without known pharmacological activity.55–57 Concerning the involvement of other receptors, selective GABAA agonists, such as gaboxadol58 and the GABA uptake inhibitor tiagabine, also induced increases in SWS duration and EEG delta and theta power during NREMS.59–61 In addition, gaboxadol decreased EEG activity in sigma frequencies in NREMS and increased EEG delta and theta power in REMS.58 Gaboxadol also counteracts the disrupting effects of a nap on subsequent sleep by promoting SWS, EEG delta and theta power in NREMS and by decreasing sleep latency.62 These effects closely match those evoked by both SO and BAC, also suggesting that gaboxadol exhibits significant hypnotic actions under conditions of reduced sleep pressure and in part mimics sleep and EEG modifications seen during recovery sleep after sleep deprivation.63,64 Although it was shown that BAC and GHB do not directly bind to GABAA receptors,65,66 they may share effects on neuronal processes underlying the generation/synchronization of slow waves. However, not only drugs promoting GABAergic signaling have been shown to increase deep sleep and EEG delta power. For instance, the serotonergic system seems to be also involved in the generation of EEG slow waves.67,68 Interestingly, both BAC and GHB affect the serotonergic system, apparently through GABAB receptors.69,70
Several physiological and behavioral processes, including cognition, anesthesia, coma, and sleep, are closely linked with slow wave generation/synchronization. Therefore, further investigations into molecular actors such as GABAB receptors may improve the treatments of various central nervous system disorders beyond narcolepsy.
DISCLOSURE STATEMENT
This study was partially funded by an unrestricted research grant from UCB Pharma S.A. (Belgium). Dr. Tafti has received honorarium and compensation from UCB Pharma S.A. (Belgium). Dr. Schwartz has received other research support from UCB Pharma S.A. (Belgium). The other authors have indicated no financial conflicts of interest.
ACKNOWLEDGMENTS
Work supported by the Swiss National Science Foundation grant 3100A0-108478 (to Dr. Tafti), an unrestricted grant from UCB Pharma S.A. (Belgium) and by the University and State of Vaud, Switzerland.
ABBREVIATIONS
- 2-D
two-dimensional
- BAC
baclofen
- BAC-exp Condition
BAC administrated before EXP and PL before nap
- BAC-nap Condition
BAC administrated before nap and PL before EXP
- Be
BAC-exp
- BLN
baseline night
- Bn
BAC-nap
- EEG
electroencephalogram
- EMG
electromyogram
- EOG
electrooculogram
- EXP
experimental night = postnap night
- GABA
gamma-aminobutyric acid
- GBL
gamma-butyrolactone
- GHB
gamma-hydroxybutyrate
- KDEF
Karolinska Directed Emotional Faces System
- KSS
Karolinska sleepiness scale
- MT
movement time
- NREMS
non-rapid eye movement sleep (stages 2-4)
- PL
placebo
- PVT
psychomotor vigilance task
- REM
rapid eye movement
- REMS
rapid eye movement sleep
- REMSL
REMS latency
- RT
reaction time
- S1
Stage 1
- S2
Stage 2
- S2
Stage 3
- S4
Stage 4
- Se
SO-exp
- SE
sleep efficiency (TST/recording time)
- SL
sleep latency
- Sn
SO-nap
- SO
sodium oxybate
- SO-exp Condition
SO administrated before EXP and PL before nap
- SO-nap Condition
SO administrated before nap and PL before EXP
- SOREM
sleep onset REMS
- SOREMP
sleep onset REMS periods
- SWS
slow wave sleep
- TIB
time in bed
- TST
total sleep time
- WASO
wakefulness after sleep onset
SUPPLEMENTAL MATERIAL
EEG power spectra of waking during nighttime sleep. (A) To quantify the effect of a nap on the subsequent sleep (the EXP night), the ratio of absolute waking spectra in the EXP and BLN nights for the PL condition (EXP/BLN) was calculated yielding a relative waking spectrum where 100% represents the BLN night. Waking spectra did not differ significantly between nights (2-way mixed-model ANOVA for factors “night” P > 0.1, “frequency bin” P < 0.0001, and their interaction P = 1.0). (B) To illustrate the comparison of each treatment condition with the PL condition, relative waking spectra of each drug treatment condition (EXP/BLN) were expressed as a percentage of relative waking spectrum of the PL condition. Relative waking spectrum during the EXP night was affected by treatment condition and by frequency bin (2-way mixed-model ANOVA: factors “treatment” P < 0.0001, “frequency bin” P < 0.0001 and their interaction P < 0.0001). Overall, the BAC-nap, BAC-exp, and SO-exp conditions differed significantly from the PL condition, while the SO-nap condition did not (Dunnett-Hsu test [control = PL] P < 0.05). Colored triangles depict frequency bins for which power differed significantly from the PL condition (Dunnett-Hsu test P < 0.05, blue: BAC-nap [Bn], gray: BAC-exp [Be] and red: SO-exp [Se]). For each panel, lines depict the mean values (± SEM; n = 12). Note that in average 67% ± 2% (mean ± SEM) of the waking was artifacted and nights with less than 2 min of artifact free waking or for which artifacted waking represented more than 90% of total waking were not included in the analysis (17%).

REFERENCES
- 1.U.S. Xyrem Multicenter Study Group. A 12-month, open-label, multicenter extension trial of orally administered sodium oxybate for the treatment of narcolepsy. Sleep. 2003;26:31–5. [PubMed] [Google Scholar]
- 2.Mamelak M, Black J, Montplaisir J, Ristanovic R. A pilot study on the effects of sodium oxybate on sleep architecture and daytime alertness in narcolepsy. Sleep. 2004;27:1327–34. doi: 10.1093/sleep/27.7.1327. [DOI] [PubMed] [Google Scholar]
- 3.Van Cauter E, Plat L, Scharf MB, et al. Simultaneous stimulation of slow-wave sleep and growth hormone secretion by gamma-hydroxybutyrate in normal young men. J Clin Invest. 1997;100:745–53. doi: 10.1172/JCI119587. [DOI] [PMC free article] [PubMed] [Google Scholar]
- 4.Lapierre O, Montplaisir J, Lamarre M, Bedard MA. The effect of gamma-hydroxybutyrate on nocturnal and diurnal sleep of normal subjects: further considerations on REM sleep-triggering mechanisms. Sleep. 1990;13:24–30. doi: 10.1093/sleep/13.1.24. [DOI] [PubMed] [Google Scholar]
- 5.Scharf MB, Baumann M, Berkowitz DV. The effects of sodium oxybate on clinical symptoms and sleep patterns in patients with fibromyalgia. J Rheumatol. 2003;30:1070–4. [PubMed] [Google Scholar]
- 6.Moldofsky H, Inhaber NH, Guinta DR, Alvarez-Horine SB. Effects of sodium oxybate on sleep physiology and sleep/wake-related symptoms in patients with fibromyalgia syndrome: a double-blind, randomized, placebo-controlled study. J Rheumatol. 2010;37:2156–66. doi: 10.3899/jrheum.091041. [DOI] [PubMed] [Google Scholar]
- 7.Donjacour CE, Aziz NA, Roelfsema F, et al. Effect of sodium oxybate on growth hormone secretion in narcolepsy patients and healthy controls. Am J Physiol Endocrinol Metab. 2011;300:E1069–75. doi: 10.1152/ajpendo.00623.2010. [DOI] [PubMed] [Google Scholar]
- 8.Tononi G, Cirelli C. Sleep function and synaptic homeostasis. Sleep Med Rev. 2006;10:49–62. doi: 10.1016/j.smrv.2005.05.002. [DOI] [PubMed] [Google Scholar]
- 9.Krueger JM, Obal F., Jr Sleep function. Front Biosci. 2003;8:d511–9. doi: 10.2741/1031. [DOI] [PubMed] [Google Scholar]
- 10.Carskadon MA, Dement WC. Effects of total sleep loss on sleep tendency. Percept Mot Skills. 1979;48:495–506. doi: 10.2466/pms.1979.48.2.495. [DOI] [PubMed] [Google Scholar]
- 11.Borbely AA. A two process model of sleep regulation. Hum Neurobiol. 1982;1:195–204. [PubMed] [Google Scholar]
- 12.Werth E, Dijk DJ, Achermann P, Borbely AA. Dynamics of the sleep EEG after an early evening nap: experimental data and simulations. Am J Physiol. 1996;271(3 Pt 2):R501–10. doi: 10.1152/ajpregu.1996.271.3.R501. [DOI] [PubMed] [Google Scholar]
- 13.Dijk DJ, Beersma DG, Daan S, Bloem GM, Van den Hoofdakker RH. Quantitative analysis of the effects of slow wave sleep deprivation during the first 3 h of sleep on subsequent EEG power density. Eur Arch Psychiatry Neurol Sci. 1987;236:323–8. doi: 10.1007/BF00377420. [DOI] [PubMed] [Google Scholar]
- 14.Tobler I, Borbely AA. Sleep EEG in the rat as a function of prior waking. Electroencephalogr Clin Neurophysiol. 1986;64:74–6. doi: 10.1016/0013-4694(86)90044-1. [DOI] [PubMed] [Google Scholar]
- 15.Franken P, Tobler I, Borbely AA. Sleep homeostasis in the rat: simulation of the time course of EEG slow-wave activity. Neurosci Lett. 1991;130:141–4. doi: 10.1016/0304-3940(91)90382-4. [DOI] [PubMed] [Google Scholar]
- 16.Vienne J, Bettler B, Franken P, Tafti M. Differential effects of GABAB receptor subtypes, {gamma}-hydroxybutyric Acid, and Baclofen on EEG activity and sleep regulation. J Neurosci. 2010;30:14194–204. doi: 10.1523/JNEUROSCI.3145-10.2010. [DOI] [PMC free article] [PubMed] [Google Scholar]
- 17.Mamelak M, Escriu JM, Stokan O. The effects of gamma-hydroxybutyrate on sleep. Biol Psychiatry. 1977;12:273–88. [PubMed] [Google Scholar]
- 18.Meerlo P, Westerveld P, Turek FW, Koehl M. Effects of gamma-hydroxybutyrate (GHB) on vigilance states and EEG in mice. Sleep. 2004;27:899–904. doi: 10.1093/sleep/27.5.899. [DOI] [PubMed] [Google Scholar]
- 19.Godschalk M, Dzoljic MR, Bonta IL. Slow wave sleep and a state resembling absence epilepsy induced in the rat by gamma-hydroxybutyrate. Eur J Pharmacol. 1977;44:105–11. doi: 10.1016/0014-2999(77)90096-6. [DOI] [PubMed] [Google Scholar]
- 20.Finnimore AJ, Roebuck M, Sajkov D, McEvoy RD. The effects of the GABA agonist, baclofen, on sleep and breathing. Eur Respir J. 1995;8:230–4. doi: 10.1183/09031936.95.08020230. [DOI] [PubMed] [Google Scholar]
- 21.Borgen L, Lane E, Lai A. Xyrem (sodium oxybate): a study of dose proportionality in healthy human subjects. J Clin Pharmacol. 2000;40:1053. [Google Scholar]
- 22.Hulme A, MacLennan WJ, Ritchie RT, John VA, Shotton PA. Baclofen in the elderly stroke patient its side-effects and pharmacokinetics. Eur J Clin Pharmacol. 1985;29:467–9. doi: 10.1007/BF00613463. [DOI] [PubMed] [Google Scholar]
- 23.Ban E, Park JS, Kim CK. Semi-microbore HPLC for the determination of baclofen in human plasma using column switching. J Liq Chromatogr Relat Technol. 2004;27:3051–64. [Google Scholar]
- 24.Lim J, Dinges DF. Sleep deprivation and vigilant attention. Ann N Y Acad Sci. 2008;1129:305–22. doi: 10.1196/annals.1417.002. [DOI] [PubMed] [Google Scholar]
- 25.Akerstedt T, Gillberg M. Subjective and objective sleepiness in the active individual. Int J Neurosci. 1990;52:29–37. doi: 10.3109/00207459008994241. [DOI] [PubMed] [Google Scholar]
- 26.Gais S, Born J. Declarative memory consolidation: mechanisms acting during human sleep. Learn Mem. 2004;11:679–85. doi: 10.1101/lm.80504. [DOI] [PMC free article] [PubMed] [Google Scholar]
- 27.Rasch B, Buchel C, Gais S, Born J. Odor cues during slow-wave sleep prompt declarative memory consolidation. Science. 2007;315:1426–9. doi: 10.1126/science.1138581. [DOI] [PubMed] [Google Scholar]
- 28.Plihal W, Born J. Effects of early and late nocturnal sleep on declarative and procedural memory. J Cognitive Neurosci. 1997;9:534–47. doi: 10.1162/jocn.1997.9.4.534. [DOI] [PubMed] [Google Scholar]
- 29.Bonin P, Méot A, Aubert L, Malardier N, Niedenthal P, Capelle-Toczek M. Normes de concétude, de valeur d’imgerie, de fréquence subjective et de calence émotionnelle pour 866 mots. L’année psychologie. 2003;104:655–94. [Google Scholar]
- 30.Sommer T, Rose M, Glascher J, Wolbers T, Buchel C. Dissociable contributions within the medial temporal lobe to encoding of object-location associations. Learn Mem. 2005;12:343–51. doi: 10.1101/lm.90405. [DOI] [PMC free article] [PubMed] [Google Scholar]
- 31.Kessels RP, de Haan EH, Kappelle LJ, Postma A. Varieties of human spatial memory: a meta-analysis on the effects of hippocampal lesions. Brain Res Brain Res Rev. 2001;35:295–303. doi: 10.1016/s0165-0173(01)00058-3. [DOI] [PubMed] [Google Scholar]
- 32.Lundqvist D, Flykt A, Öhmann A. Clinical Neuroscience, Psychology section, Karolinska Institutet, ISBN 91-630-7164-9. Stockholm: Karolinska Institute; 1998. The Karolinska Directed Emotional Faces (KDEF) - CD ROM from Dept. [Google Scholar]
- 33.Nishida M, Walker MP. Daytime naps, motor memory consolidation and regionally specific sleep spindles. PLoS One. 2007;2:e341. doi: 10.1371/journal.pone.0000341. [DOI] [PMC free article] [PubMed] [Google Scholar]
- 34.Walker MP, Brakefield T, Hobson JA, Stickgold R. Dissociable stages of human memory consolidation and reconsolidation. Nature. 2003;425:616–20. doi: 10.1038/nature01930. [DOI] [PubMed] [Google Scholar]
- 35.Walker MP, Brakefield T, Morgan A, Hobson JA, Stickgold R. Practice with sleep makes perfect: sleep-dependent motor skill learning. Neuron. 2002;35:205–11. doi: 10.1016/s0896-6273(02)00746-8. [DOI] [PubMed] [Google Scholar]
- 36.Rechtschaffen A, Kales A. Bethesda, MD: National Institutes of Health; 1968. A manual of standardised terminology, techniques and scoring system for sleep stages of human subjects. [DOI] [PubMed] [Google Scholar]
- 37.Feinberg I, Floyd TC. Systematic trends across the night in human sleep cycles. Psychophysiology. 1979;16:283–91. doi: 10.1111/j.1469-8986.1979.tb02991.x. [DOI] [PubMed] [Google Scholar]
- 38.Feinberg I, Maloney T, March JD. Precise conservation of NREM period 1 (NREMP1) delta across naps and nocturnal sleep: implications for REM latency and NREM/REM alternation. Sleep. 1992;15:400–3. doi: 10.1093/sleep/15.5.400. [DOI] [PubMed] [Google Scholar]
- 39.Takahashi M. The role of prescribed napping in sleep medicine. Sleep Med Rev. 2003;7:227–35. doi: 10.1053/smrv.2002.0241. [DOI] [PubMed] [Google Scholar]
- 40.Tassi P, Muzet A. Sleep inertia. Sleep Med Rev. 2000;4:341–53. doi: 10.1053/smrv.2000.0098. [DOI] [PubMed] [Google Scholar]
- 41.Stickgold R. Sleep-dependent memory consolidation. Nature. 2005;437:1272–8. doi: 10.1038/nature04286. [DOI] [PubMed] [Google Scholar]
- 42.Marshall L, Born J. The contribution of sleep to hippocampus-dependent memory consolidation. Trends Cogn Sci. 2007;11:442–50. doi: 10.1016/j.tics.2007.09.001. [DOI] [PubMed] [Google Scholar]
- 43.Tucker MA, Hirota Y, Wamsley EJ, Lau H, Chaklader A, Fishbein W. A daytime nap containing solely non-REM sleep enhances declarative but not procedural memory. Neurobiol Learn Mem. 2006;86:241–7. doi: 10.1016/j.nlm.2006.03.005. [DOI] [PubMed] [Google Scholar]
- 44.Mednick S, Nakayama K, Stickgold R. Sleep-dependent learning: a nap is as good as a night. Nat Neurosci. 2003;6:697–8. doi: 10.1038/nn1078. [DOI] [PubMed] [Google Scholar]
- 45.Lingenhoehl K, Brom R, Heid J, et al. Gamma-hydroxybutyrate is a weak agonist at recombinant GABA(B) receptors. Neuropharmacology. 1999;38:1667–73. doi: 10.1016/s0028-3908(99)00131-8. [DOI] [PubMed] [Google Scholar]
- 46.Schwenk J, Metz M, Zolles G, et al. Native GABA(B) receptors are heteromultimers with a family of auxiliary subunits. Nature. 2010;465:231–5. doi: 10.1038/nature08964. [DOI] [PubMed] [Google Scholar]
- 47.Walsh JK, Hall-Porter JM, Griffin KS, et al. Enhancing slow wave sleep with sodium oxybate reduces the behavioral and physiological impact of sleep loss. Sleep. 2010;33:1217–25. doi: 10.1093/sleep/33.9.1217. [DOI] [PMC free article] [PubMed] [Google Scholar]
- 48.Tinguely G, Huber R, Borbely AA, Achermann P. Non-rapid eye movement sleep with low muscle tone as a marker of rapid eye movement sleep regulation. BMC Neurosci. 2006;7:2. doi: 10.1186/1471-2202-7-2. [DOI] [PMC free article] [PubMed] [Google Scholar]
- 49.Mignot E, Lin L, Finn L, et al. Correlates of sleep-onset REM periods during the Multiple Sleep Latency Test in community adults. Brain. 2006;129(Pt 6):1609–23. doi: 10.1093/brain/awl079. [DOI] [PubMed] [Google Scholar]
- 50.Sasaki Y, Fukuda K, Takeuchi T, Inugami M, Miyasita A. Sleep onset REM period appearance rate is affected by REM propensity in circadian rhythm in normal nocturnal sleep. Clin Neurophysiol. 2000;111:428–33. doi: 10.1016/s1388-2457(99)00254-0. [DOI] [PubMed] [Google Scholar]
- 51.Carskadon MA, Dement WC. Sleep studies on a 90-minute day. Electroencephalogr Clin Neurophysiol. 1975;39:145–55. doi: 10.1016/0013-4694(75)90004-8. [DOI] [PubMed] [Google Scholar]
- 52.Kaupmann K, Cryan JF, Wellendorph P, et al. Specific gamma-hydroxybutyrate-binding sites but loss of pharmacological effects of gamma-hydroxybutyrate in GABA(B)(1)-deficient mice. Eur J Neurosci. 2003;18:2722–30. doi: 10.1111/j.1460-9568.2003.03013.x. [DOI] [PubMed] [Google Scholar]
- 53.Waldmeier PC. The GABAB antagonist, CGP 35348, antagonizes the effects of baclofen, gamma-butyrolactone and HA 966 on rat striatal dopamine synthesis. Naunyn Schmiedebergs Arch Pharmacol. 1991;343:173–8. doi: 10.1007/BF00168606. [DOI] [PubMed] [Google Scholar]
- 54.Dzirasa K, Ribeiro S, Costa R, et al. Dopaminergic control of sleep-wake states. J Neurosci. 2006;26:10577–89. doi: 10.1523/JNEUROSCI.1767-06.2006. [DOI] [PMC free article] [PubMed] [Google Scholar]
- 55.Faigle JW, Keberle H. The chemistry and kinetics of Lioresal. Postgrad Med J. 1972;48(Suppl 5):9–13. [PubMed] [Google Scholar]
- 56.Wuis EW, Dirks MJ, Termond EF, Vree TB, Van der Kleijn E. Plasma and urinary excretion kinetics of oral baclofen in healthy subjects. Eur J Clin Pharmacol. 1989;37:181–4. doi: 10.1007/BF00558228. [DOI] [PubMed] [Google Scholar]
- 57.Young RR, Delwaide PJ. Drug therapy: spasticity (second of two parts) N Engl J Med. 1981;304:96–9. doi: 10.1056/NEJM198101083040207. [DOI] [PubMed] [Google Scholar]
- 58.Faulhaber J, Steiger A, Lancel M. The GABAA agonist THIP produces slow wave sleep and reduces spindling activity in NREM sleep in humans. Psychopharmacology (Berl) 1997;130:285–91. doi: 10.1007/s002130050241. [DOI] [PubMed] [Google Scholar]
- 59.Walsh JK, Perlis M, Rosenthal M, Krystal A, Jiang J, Roth T. Tiagabine increases slow-wave sleep in a dose-dependent fashion without affecting traditional efficacy measures in adults with primary insomnia. J Clin Sleep Med. 2006;2:35–41. [PubMed] [Google Scholar]
- 60.Lancel M, Faulhaber J. The GABA(A) agonist THIP (gaboxadol) increases non-REM sleep and enhances delta activity in the rat. Neuroreport. 1996;7:2241–5. doi: 10.1097/00001756-199609020-00036. [DOI] [PubMed] [Google Scholar]
- 61.Winsky-Sommerer R, Vyazovskiy VV, Homanics GE, Tobler I. The EEG effects of THIP (Gaboxadol) on sleep and waking are mediated by the GABA(A)delta-subunit-containing receptors. Eur J Neurosci. 2007;25:1893–9. doi: 10.1111/j.1460-9568.2007.05455.x. [DOI] [PubMed] [Google Scholar]
- 62.Mathias S, Steiger A, Lancel M. The GABA(A) agonist gaboxadol improves the quality of post-nap sleep. Psychopharmacology (Berl) 2001;157:299–304. doi: 10.1007/s002130100819. [DOI] [PubMed] [Google Scholar]
- 63.Borbely AA, Baumann F, Brandeis D, Strauch I, Lehmann D. Sleep deprivation: effect on sleep stages and EEG power density in man. Electroencephalogr Clin Neurophysiol. 1981;51:483–95. doi: 10.1016/0013-4694(81)90225-x. [DOI] [PubMed] [Google Scholar]
- 64.Dijk DJ, Brunner DP, Borbely AA. Time course of EEG power density during long sleep in humans. Am J Physiol. 1990;258(3 Pt 2):R650–61. doi: 10.1152/ajpregu.1990.258.3.R650. [DOI] [PubMed] [Google Scholar]
- 65.Hill DR, Bowery NG. 3H-baclofen and 3H-GABA bind to bicuculline-insensitive GABA B sites in rat brain. Nature. 1981;290:149–52. doi: 10.1038/290149a0. [DOI] [PubMed] [Google Scholar]
- 66.Serra M, Sanna E, Foddi C, Concas A, Biggio G. Failure of gamma-hydroxybutyrate to alter the function of the GABAA receptor complex in the rat cerebral cortex. Psychopharmacology (Berl) 1991;104:351–5. doi: 10.1007/BF02246035. [DOI] [PubMed] [Google Scholar]
- 67.Landolt HP, Meier V, Burgess HJ, et al. Serotonin-2 receptors and human sleep: effect of a selective antagonist on EEG power spectra. Neuropsychopharmacology. 1999;21:455–66. doi: 10.1016/S0893-133X(99)00052-4. [DOI] [PubMed] [Google Scholar]
- 68.Al-Shamma HA, Anderson C, Chuang E, et al. Nelotanserin, a novel selective human 5-hydroxytryptamine2A inverse agonist for the treatment of insomnia. J Pharmacol Exp Ther. 2010;332:281–90. doi: 10.1124/jpet.109.160994. [DOI] [PubMed] [Google Scholar]
- 69.Gobaille S, Schleef C, Hechler V, Viry S, Aunis D, Maitre M. Gamma-hydroxybutyrate increases tryptophan availability and potentiates serotonin turnover in rat brain. Life Sci. 2002;70:2101–12. doi: 10.1016/s0024-3205(01)01526-0. [DOI] [PubMed] [Google Scholar]
- 70.Takahashi A, Shimamoto A, Boyson CO, DeBold JF, Miczek KA. GABA(B) receptor modulation of serotonin neurons in the dorsal raphe nucleus and escalation of aggression in mice. J Neurosci. 2010;30:11771–80. doi: 10.1523/JNEUROSCI.1814-10.2010. [DOI] [PMC free article] [PubMed] [Google Scholar]
Associated Data
This section collects any data citations, data availability statements, or supplementary materials included in this article.
Supplementary Materials
EEG power spectra of waking during nighttime sleep. (A) To quantify the effect of a nap on the subsequent sleep (the EXP night), the ratio of absolute waking spectra in the EXP and BLN nights for the PL condition (EXP/BLN) was calculated yielding a relative waking spectrum where 100% represents the BLN night. Waking spectra did not differ significantly between nights (2-way mixed-model ANOVA for factors “night” P > 0.1, “frequency bin” P < 0.0001, and their interaction P = 1.0). (B) To illustrate the comparison of each treatment condition with the PL condition, relative waking spectra of each drug treatment condition (EXP/BLN) were expressed as a percentage of relative waking spectrum of the PL condition. Relative waking spectrum during the EXP night was affected by treatment condition and by frequency bin (2-way mixed-model ANOVA: factors “treatment” P < 0.0001, “frequency bin” P < 0.0001 and their interaction P < 0.0001). Overall, the BAC-nap, BAC-exp, and SO-exp conditions differed significantly from the PL condition, while the SO-nap condition did not (Dunnett-Hsu test [control = PL] P < 0.05). Colored triangles depict frequency bins for which power differed significantly from the PL condition (Dunnett-Hsu test P < 0.05, blue: BAC-nap [Bn], gray: BAC-exp [Be] and red: SO-exp [Se]). For each panel, lines depict the mean values (± SEM; n = 12). Note that in average 67% ± 2% (mean ± SEM) of the waking was artifacted and nights with less than 2 min of artifact free waking or for which artifacted waking represented more than 90% of total waking were not included in the analysis (17%).