

Abstract
In 2004, brain tumor stem cells (BTSCs) were isolated from surgical human malignant gliomas. This cancer cell population has been identified as the root for tumor initiation and resistance to therapies. Thus, it is imperative to develop new therapies that can eradicate this subpopulation to improve the prognosis of patients with brain tumors. Our group previously reported the antiglioma effect of the tumor-selective oncolytic adenovirus Delta-24-RGD that is now being tested in a phase I clinical trial for patients with malignant gliomas. We also showed that Delta-24-RGD infects, replicates in, and induces cell death in BTSCs. Interestingly, we observed that adenoviral-infected cells undergo autophagy and that autophagy-related cytoplasmic vacuolization might be part of the lysis process. Here, we summarize the materials and methods used in our study as follows: establishment of neurosphere cultures from surgical samples of human glioblastoma multiformes; assessment of stem cell markers; examination of adenoviral receptors in BTSCs; evaluation of the cytotoxicity induced by oncolytic adenoviruses; and assessment of autophagy in oncolytic adenovirus-infected BTSCs in vitro, and finally we describe a method to detect upregulation of the autophagy-related protein Atg5 in tumors treated with Delta-24-RGD.
Keywords: Brain tumors, Brain tumor stem cells, Glioma, Oncolytic adenovirus, Delta-24-RGD, Autophagy
1. Introduction
The most common primary brain tumor in adults is glioblastoma multiforme (GBM). GBMs remain universally fatal and, despite the use of maximal therapy, the median survival duration is slightly more than 1 year (1). These dismal survival statistics underscore the need for new therapeutic approaches for GBM. The finding of brain tumor stem cells (BTSCs), the putative subpopulation causing the resistance of these tumors to conventional therapies, was made by applying principles of cell culture and analysis of normal neural stem cells (NSCs) and identifying cell surface markers that allow for isolation of distinct tumor cell populations that can then be studied in vitro and in vivo (2, 3). BTSCs can be enriched from a population of brain tumor cells by sorting dissociated suspensions of tumor cells for those expressing the NSC marker CD133 (4). CD133+ cells, which also express the NSC marker nestin but not differentiated neural lineage markers, represent a minority of the entire brain tumor cell population, exclusively generate clonal tumor spheres in suspension culture, and exhibit increased self-renewal capacity (3). In addition, implantation of human BTSCs into the brain of immunocompromised animal model results in the formation of tumors that phenotypically resemble the original primary tumor (3).
The identification of BTSCs provides a powerful tool for investigating the tumorigenic process in the central nervous system and for developing therapies targeted specifically to this compartment. Due to the tumor-initiating properties of BTSCs, therapies that destroy, induce differentiation, and/or prevent the invasion/metastasis of cancer stem cells are potentially curative. An approach utilized to design novel, rational, effective treatments of GBM is based in the use of oncolytic adenoviruses. We previously reported the antiglioma effect of the tumor-selective adenovirus Delta-24-RGD, the genome which encompasses a 24-bp deletion in the E1A gene region encoding the amino acids responsible for binding Rb protein (5) and displays enhanced infectivity through the insertion of an RGD-4C motif to the fiber HI loop (6). Delta-24-RGD has proven to be highly effective in inducing the suppression of brain tumors in mice. Of importance, our group also showed that Delta-24-RGD is an efficacious therapeutic agent against BTSCs. Interestingly, Delta-24-RGD elicited autophagic cell death in this cancer subpopulation. Autophagy has been proposed as the basis for the mechanism of cell death during adenoviral infection (7). In agreement with this hypothesis, we showed that adenoviral infection is followed by upregulation of the levels of a critical protein in the autophagy pathway, Atg5, in host cells (8, 9). In addition, in Delta-24-RGD-treated BTSC-derived xenografts, we observed Atg5 overexpression and colocalization with adenoviral proteins (9) suggesting that increased levels of Atg5 could be used as a surrogate marker of adenovirus activity in human gliomas treated with oncolytic adenoviruses in future clinical trials.
In this review, we summarize the material and methods used in our studies. It includes the establishment of neurosphere cultures from surgical samples of human GBMs; assessment of stem cell markers through polymerase chain reaction (PCR); examination of adenoviral receptors in BTSCs via flow cytometry; evaluation of the cytotoxicity induced by oncolytic adenoviruses; and assessment of autophagy in oncolytic adenovirus-infected BTSCs in vitro and in vivo.
2. Materials
2.1. Establishment of Neurosphere Cultures from Surgical Samples of Human GBMs
Artificial cerebrospinal fluid (CSF): 125 mM NaCl, 5 mM KCL, 1.3 mM MgCl2, 2 mM CaCl2, 26 mM NaHCO3, 10 mM D-glucose. It should be stored at 4°C.
Low Ca2+ CSF: 125 mM NaCl, 5 mM KCl, 3.2 mM MgCl2, 0.1 mM CaCl2, 26 mM NaHCO3, 10 mM D-glucose. It should be stored at 4°C.
Collagenase (Sigma) is dissolved at 1% in phosphate-buffered saline (PBS) and stored at −20°C.
Hyaluronidase (Sigma) is dissolved at 2% in PBS and stored at −20°C.
Trypsin/ethylenediaminetetraacetic acid (EDTA) solution (GIBCO Invitrogen): 1×. It should be stored at 4°C.
70-μm cell strainer (BD Biosciences).
Solution of 0.9 M sucrose in 0.5× Hanks’ balanced salt solution. It should be stored at 4°C.
Red blood cell (RBC) lysis buffer: Dissolve 8.26 g of NH4Cl, 1 g of KHCO3, and 0.037 g of EDTA in 1 L of deionized distilled water (ddH2O). Mix well and autoclave. Store up to 6 months at room temperature or 4°C. RBC lysis buffer should always be used at room temperature.
Tris–EDTA (TE) buffer: 10 mM Tris–Cl, pH 7.5, 1 mM EDTA.
Trypsin inhibitor solution (Sigma): 10 mg/mL in sterile water with 0.9% NaCl and 0.9% benzyl alcohol, pH 5.7–6.2. It should be stored at 4°C.
Dulbecco’s modified Eagle’s medium (DMEM) supplemented with F-12 medium (GIBCO Invitrogen).
Neuro-stem cell medium: DMEM/F-12 medium, B27 supplement. Add fresh epidermal growth factor (EGF; 20 ng/mL) and basic fibroblast growth factor (bFGF; 20 ng/mL) at every preparation. EGF is dissolved in 10% bovine serum albumin (BSA; 50 ng/mL), and bFGF is dissolved in 5 mM Tris–Cl, pH 7.0 (50 ng/mL), and stored at −80°C.
2.2. Assessment of Stem Cell Markers Using PCR
RNeasy total RNA isolation kit (Qiagen).
Ultraviolet spectrophotometer for RNA quantification.
-
Materials required for cDNA synthesis:
200 ng RNA.
Thermocycler.
10 mM dNTP mix: 10 mM each dATP, dCTP, dGTP, and dTTP.
50 μM Oligo(dt) primer (Invitrogen).
SuperScript III First-Strand Synthesis System for reverse transcriptase (RT)-PCR (Invitrogen).
Water: PCR grade.
0.2-mL thin-walled PCR tubes.
-
Materials required for PCR:
Input cDNA from the previous synthesis.
Specific primers for the genes of interest (see Subheading 3.2 for the primer sequences).
10 mM dNTP mix: 10 mM each dATP, dCTP, dGTP, and dTTP.
Taq DNA polymerase (Roche Applied Science).
Water: PCR grade.
0.2-mL thin-walled PCR tubes.
Sterile reaction tubes for preparing master mixes and dilutions.
Thermocycler.
Agarose, Type I: Low EEO (Sigma).
Tris–acetate–EDTA (TAE) running buffer (1×): Dissolve the following in 1 L of ddH2O: 48.4 g of Tris base, 10.9 g of glacial acetic acid, and 2.92 g of EDTA. Store at room temperature.
100 bp molecular weight marker (Invitrogen).
Mini agarose gel electrophoresis unit.
2.3. Examination of Adenoviral Receptors in BTSCs Using Flow Cytometry
BTSCs.
Neuro-stem cell medium.
400–600 U/mL Accutase solution (Sigma–Aldrich).
PBS.
Antibody binding buffer: Prepare a solution containing PBS, pH 7.2, 0.5% BSA, and 2 mM EDTA. Keep buffer cold (4–8°C).
Human FcR blocking reagent (Miltenyi Biotec) to prevent FcR-mediated antibody labeling.
5 μg/mL propidium iodide for the exclusion of dead cells (Sigma) without cell fixation.
Mouse monoclonal anti-integrin-αvβ3 antibody (Chemicon International): 1:200 dilution.
Mouse monoclonal anti-integrin-αvβ5 antibody (Chemicon International): 1:400 dilution.
Mouse monoclonal anti-coxsakie adenoviral receptor (CAR) antibody (Upstate Biotechnology): 1:2,000 dilution.
Fluorescein isothiocyanate-labeled goat anti-mouse IgG secondary antibody (Santa Cruz Biotechnology): 1:100 dilution.
FACSCalibur (BD Biosciences).
2.4. Evaluation of the Cytotoxicity Induced by Oncolytic Adenoviruses
Oncolytic adenovirus: Store at −80°C.
BTSCs.
Neuro-Stem cell medium.
Trypsin, 0.5% (10×) with EDTA 4Na, liquid (Invitrogen).
10 mg/ml soybean trypsin inhibitor (10×, Sigma).
Flat-bottom, 96-well plates.
CellTiter 96® AQueous One Solution Cell Proliferation Assay (MTS) (Promega Life Science).
Plate reader.
2.5. Assessment of Autophagy in Oncolytic Adenovirus-Infected BTSCs In Vivo and In Vitro
2.5.1. Induction of Acidic Vesicular Organelles
Oncolytic adenovirus: Store at −80°C.
BTSCs.
Neuro-Stem cell medium.
400–600 U/mL Accutase solution (Sigma–Aldrich).
Six-well plates.
10 mg/mL acridine orange solution (Sigma) (in ddH2O).
PBS.
FACSCalibur (BD Biosciences).
2.5.2. Electron Microscopy
Oncolytic adenovirus: Store at −80°C.
BTSCs.
Neuro-Stem cell medium.
Glass coverslips.
Fixing solution containing 3% glutaraldehyde plus 2% paraformaldehyde in 0.1 M cacodylate buffer, pH 7.3.
OsO4: 1% in 0.1 M cacodylate buffer, pH 7.3.
1% Millipore-filtered uranyl acetate (UA).
100, 95, and 70% ethanol.
Spurr’s low-viscosity medium.
Lead citrate.
Ultracut microtome (Leica) stained with uranyl acetate and lead citrate using a Leica EM stainer.
Electron microscope (JEM 1010 transmission electron microscope; JEOL).
2.5.3. Immunofluorescent Analysis of Adenoviral Fiber and Atg5 Protein Expression in the Brain of Mice Bearing BTSC Xenografts
Paraffin slides containing BTSCs previously infected with an oncolytic adenoviral vector.
Mouse monoclonal antibodies specific for adenoviral fiber protein (4D2; Lab Vision): 1:500 dilution.
Rabbit polyclonal anti-Atg5 antibody (Cosmo Bio Co., Ltd.): 1:200 dilution.
Texas Red (fiber)- or Alexa Fluor 488 (Atg5)-conjugated secondary antibodies (Molecular Probes): 1:500 dilution.
PBS.
Xylene.
95 and 70% alcohol.
Distilled water.
10% goat serum in PBS.
0.0 l M citrate buffer, pH 6.0.
“Auto buffer”: 0.01 M Tris–Cl, pH 7.4, 1 mM CaCl2, 1 mM MgCl2, 0.1% Triton X-100.
1% BSA in auto buffer.
Steamer (used for antigen retrieval).
PAP Pen (Kiyota International).
ProLong Antifade Kit (#P-7481; Molecular Probes).
3. Methods
3.1. Establishment of Neurosphere Cultures from Surgical Samples of Human GBMs
The samples are processed right after surgery. Cut tumors into small pieces using a scalpel (see Note 1).
Incubate tissue pieces in 5 mL of CSF for 10 min.
Spin down tissue samples at 239 ×g (microcentrifuge) for 5 min and aspirate the supernatant.
Wash the tissue once with low Ca2+ CSF (add CSF at a volume sufficient to cover the tissue).
Spin down tissue samples at 1,500 rpm (microcentrifuge) for 5 min. Discard supernatant.
Add 4.25 mL of low Ca2+ CSF plus 500 μL of 1% collagenase and 250 μL of 2% hyaluronidase and incubate tissue for 1 h at 37°C (see Note 2).
Spin down samples at 1,500 rpm (microcentrifuge) for 5 min and discard the supernatant.
Add 2–5 mL of TE buffer to the pellet and incubate for 10 min at room temperature.
Add an equal volume of trypsin inhibitor to TE buffer-treated tissue samples.
Immediately add DMEM/F-12 medium to enzyme-treated tissue and dissociate cells by pipetting up and down.
Place the strainer in a 50-mL tube and then pass cells through the strainer to achieve a single cell suspension.
Spin down these cells at 1,500 rpm (microcentrifuge) for 5 min and aspirate the supernatant.
Resuspend cells in 5–10 mL of a 0.9 M sucrose solution.
Centrifuge cells at 664 ×g (microcentrifuge) for 20 min (at this point, if a great deal of white debris remains, repeat steps 13 and 14).
Wash cells with 5–10 mL of DMEM/F-12 medium twice and add RBC lysis buffer to the cells.
Incubate the cells at room temperature for 5 min to allow the RBC lysis buffer to work and spin down cells at 1,500 rpm (microcentrifuge) for 5 min. Discard the supernatant.
Wash cells three times with DMEM/F-12 medium. Discard the supernatant.
Add 10 mL of Neuro-Stem cell medium to the cells and place them in a 100-mm cell culture dish. Allow at least 10 days for the cells to grow (see Note 3). The cells grow as neurosphere in neuro-stem cell medium (Fig. 1).
Fig. 1.
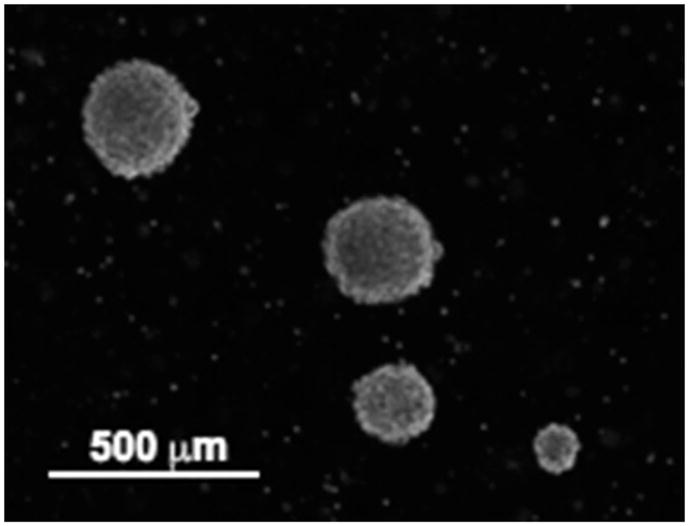
Neurosphere cultures were established from acute cell dissociation of human glioblastoma multiforme surgical specimens and maintained in neuro-stem cell medium. Note that the cells grow as spheroids. This figure has been modified from a previous publication (9).
3.2. Assessment of Stem Cell Markers Using PCR
Once the BTSC cultures are established, extraction of the RNA can proceed and markers of stemness can be examined.
To obtain a sufficient yield of RNA, at least 2–3 × 10⁵ cells should be collected.
Collect cells and spin them down at 1,000 rpm (microcentrifuge) for 1 min. Discard the supernatant.
Wash the cells twice with PBS. It is important to aspirate as much medium as possible (without disturbing the cell pellet; see Note 4).
Proceed to extracting the RNA using the RNeasy kit following the manufacturer’s instructions.
Measure the RNA at 260/280 nm using the spectrophotometer. Once the RNA concentration is calculated, cDNA synthesis can proceed.
For each cell line, prepare a 0.2-mL tube containing 200 ng of the sample RNA. Higher concentrations of RNA can be used and diluted accordingly with ddH2O at the end of the synthesis.
Add 1 μL of the 50-μM oligo(dt) primer and 1 μL of 10 mM dNTPs and bring the mixture to a final volume of 13 μL.
Incubate the mixture at 65°C for 5 min and then place on ice for at least 1 min.
Add 4 μL of 5× RT buffer and 2 μL of 0.1 M dithiothreitol to the mixture.
Incubate the mixture at 42°C for 2 min and then place it on ice and collect sample using brief centrifugation.
Add 1 μL of the SuperScript II RT enzyme to the mixture and mix gently.
Incubate the mixture at 42°C for 50 min.
Terminate the reactions by incubating the samples at 85°C for 5 min. Chill on ice. We recommend using 10% of the volume of the first-strand reaction (2 μL) as template for following PCR (see Note 5).
-
Prepare a master mix for each gene of interest, including one for the housekeeping gene. The volume of each master mix typically should be 110% of the volume required for all of the samples. The extra volume allows for loss of sample volume during pipetting. The master mix includes the following (25-μL final volume per sample):
Reverse primer (10 μM): 0.5 μL
Forward primer (10 μM): 0.5 μL
dNTPS (10 mM): 0.25 μL
PCR buffer (10×): 2.5 μL
Taq polymerase enzyme: 0.25 μL
Water: 19 μL
Dispense 23 μL of the master mix into each cDNA sample and place it in the thermocycler.
After cycling, store the samples at −20°C for later use if needed.
Check the PCR product in a 2% agarose gel for size and specificity. For instance, a 50-mL gel requires 50 mL of TAE buffer and 1 g of agarose. Dissolve the agarose in the TAE buffer, bringing it to a boil in a microwave. Let it cool down and add 0.5 μg/mL ethidium bromide to the mixture before pouring the gel into the casting device.
Once the gel has solidified, place it in the electrophoresis tank.
Load the samples in the gel. Use an appropriately sized marker; in this case, a 100-bp marker is appropriate because the fragments being amplified range from 100 to 400 bp.
Run the gel at 5 V/cm for approximately 1 h. Samples should be checked to optimize time and voltage.
-
Visualize the PCR product using a transilluminator (see Note 6).
Primer Sequences CD133-F TGGATGCAGAACTTGACAACGT CD133-R ATACCTGCTACGACAGTCGTGGT Nestin-F GGCAGCGTTGGAACAGAGGT Nestin-R CATCTTGAGGTGCGCCAGCT Bmi1-F AGCAGAAATGCATCGAACAA Bmi1-R CCTAACCAGATGAAGTTGCTGA Sox2-F CCCCCGGCGGCAATAGCA Sox2-R TCGGCGCCGGGGAGATACAT GAPDH-F AGCTGAACGGGAAGCTCACT GAPDH-R TGCTGTAGCCAAATTCGTTG
3.3. Examination of Adenoviral Receptors in BTSCs
Collect BTSCs by spinning them down at 1,000 rpm (microcentrifuge) for 1 min.
Discard the supernatant and add 500 μL of Accutase to the pellet. Pipette the pellet up and down and place cells in the incubator at 37°C for 5 min.
Add 4 mL of Neuro-Stem cell medium to the pellet and, after pipetting the cells up and down at least five times, pass them through a strainer. This step ensures single cell suspension (see Note 7).
Resuspend up to 106 nucleated cells in 80 μL of antibody-binding buffer.
Add 20 μL of FcR blocking reagent to the cells.
Add antihuman integrin mouse αvβ5 antibody (1:400 dilution), antihuman integrin mouse αvβ3 antibody (1:200 dilution), or anti-CAR antibody (1:2,000 dilution) to the cells at 4°C for 1 h.
Wash the cells once with 1 mL of PBS.
Incubate cells with the fluorescein isothiocyanate-labeled goat anti-mouse IgG secondary antibody (1:100 dilution) at room temperature for 1 h (see Note 8).
Wash the cells twice with PBS and stain them with propidium iodide at 25 μg/mL for 15 min at room temperature.
Resuspend the samples in 0.5–1.0 mL of PBS (depending on the number of cells, fewer than one million cells for a 0.5-mL volume is recommended).
Analyze cell samples using a FACScan cytometer (Becton Dickinson) with a 488-nm argon laser for excitation. Fluorescence is detected using a 520-nm band-pass filter, and all cytometric data are analyzed using CellQuest software (Becton Dickinson).
3.4. Evaluation of the Cytotoxicity Induced by Oncolytic Adenoviruses
Dissociate BTSCs and plate them in 96-well plates at 2 × 10⁴ cells/50 μL/well in triplicate.
Cells should be immediately infected with oncolytic adenoviruses at a range of desired doses in a volume of 50 μL. The dose range allows establishment of indexes, such as the 10, 50, and 100% inhibitory concentrations (IC10, IC50, IC100). The final volume after infection should be 100 μL.
Incubate the cells for 6 days.
On the sixth day, add 10 μL/well 10× trypsin with EDTA to the cells and incubate at 37°C for 15 min.
Add 10 μL/well 10× trypsin inhibitor and pipette the cells ten times (see Note 9).
Add 22 μL/well MTS reagent to the cells and incubate at 37°C for 4 h.
Read the plate with a plate reader.
Data can be shown as the percentage of viable cells in treated samples relative to that of mock-treated cells (equal to 100%).
3.5. Assessment of Autophagy in Oncolytic Adenovirus-Infected BTSCs In Vivo and In Vitro
As mentioned above, several complementary techniques can be used to monitor adenovirally induced autophagy:
3.5.1. Quantification of Acidic Vesicular Organelles Using Acridine Orange
Autophagy is characterized by the development of acidic vesicular organelles (10, 11). The cytoplasm and nucleoli of acridine orange-stained cells fluoresce bright green and dim red, respectively, whereas acidic compartments fluoresce bright red (11). Therefore, autophagy can be assessed by quantifying acidic vesicular organelles in the cells using supravital cell staining with acridine orange as described below.
Dissociate BTSC spheroids using Accutase as described previously and immediately infect the cells with adenoviruses. Dose depends on adenoviral infectivity of used cell line.
Seventy-two hours later, dissociate the cells using Accutase.
Add acridine orange (1 μg/mL; Sigma–Aldrich) to the medium for 15 min (see Note 10).
Collect the cells using centrifugation at 1,000 rpm (microcentrifuge) for 1 min.
Wash the cells with PBS.
Analyze the cells with a flow cytometer. Green (510–530 nm, FL1-H channel) and red (>650 nm, FL3-H channel) fluorescence emissions from 104 cells illuminated with blue (488 nm) excitation light are measured with a FACSCalibur from BD Biosciences using CellQuest software (San Jose, CA, USA). Control (untreated) cells are used to set the parameters for analysis of this cell sample. Place a horizontal cursor across the sample to achieve an arbitrary value above the cursor of ±5% of AVOs in the control cells. Anything above this cursor in the test sample is considered percentage of AVOs and thus indicative of the existence of an autophagic process (see Note 11).
3.5.2. Electron Microscopy
To date, electron microscopy has been the only reliable method of monitoring autophagy. The autophagy phenomenon is identified by the existence of autophagosomes and autolysosomes. The autophagosome is a double-membrane structure containing undigested cytoplasmic material, including organelles, whereas the autolysosome is a single-membrane structure containing cytoplasmic components at various stages of degradation. Because clear differentiation between autophagosomes and autolysosomes is sometimes difficult, these structures are often generalized as “autophagic vacuoles.” Importantly, double-membrane structures containing cytoplasmic components are not always autophagosomes. For example, when a portion of a cell protrudes into the next cell as with a hernia and the protrusion is cut perpendicular to the axis, it can appear to be a double-membrane structure. Thus, conventional electron microscopic images of autophagic samples must be assessed carefully.
Allow neurospheres to grow on glass coverslips and infect them with Ad-DeltaE1 (a replication-incompetent adenovirus that serves as a negative control) or Delta-24-RGD at 10 pfu/cell for 72 h (dose depends on the cell line used).
Fix the cells in a solution containing 3% glutaraldehyde plus 2% paraformaldehyde in 0.1 M cacodylate buffer (pH 7.3) for 1 h (see Note 12).
Postfix the samples in 1% OsO4 in the same buffer for 1 h.
Stain the en bloc with 1% Millipore-filtered uranyl acetate (see Note 13).
Dehydrate samples in ethanol at increasing concentrations and then infiltrate and embed them in Spurr’s low-viscosity medium.
At this point, the samples are polymerized in a 70°C oven for 2 days.
Cut ultrathin sections of the samples using a Leica Ultracut microtome and stain them with uranyl acetate and lead citrate using a Leica EM stainer (see Note 14).
Examine the sections using a JEM 1010 transmission electron microscope (JEOL, USA, Inc.) at an accelerating voltage of 80 kV. Digital images of the sections are obtained using the AMT Imaging System (Advanced Microscopy Techniques) (Fig. 2).
Fig. 2.
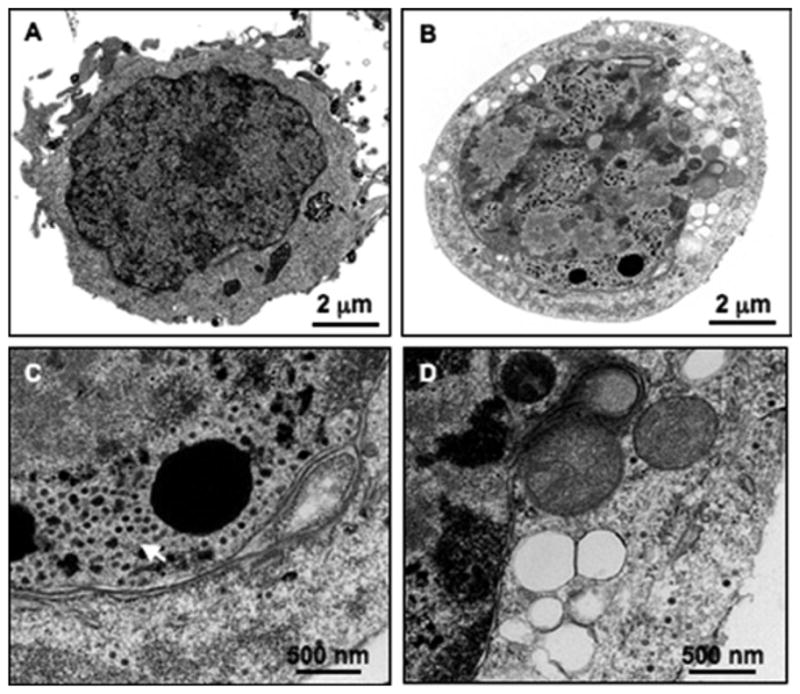
Electron microscopy photographs showing (a) mock-infected and (b) Delta-24-RGD-infected BTSCs. Please note that cytoplasmic vacuoles are present in the virus-infected cells but not in the mock-infected cells. Close-up images of the Delta-24-RGD-infected cells in (b) show (c) a cluster of Delta-24-RGD virions (white arrow) in the nucleus and (d ) complex autophagic vacuolar bodies in the cytoplasm. This figure has been modified from a previous publication (9).
3.5.3. Immunofluorescent Analysis of Viral Fiber and Atg5 Protein Expression in the Brains of Mice Bearing BTSC Xenografts
All the steps in this procedure are performed at room temperature in a light-protected humidity box unless otherwise noted (see Note 15).
Deparaffinize the slides containing the BTSC xenografts (untreated and treated with the adenovirus) by immersing them in xylene twice for 5 min with occasional agitation. Rehydrate the slides by passing them through a graded series of ethanol for 5 min each in the following order: 95, 70, 50, and 25%. Wash the slides for 2 × 5 min in PBS. Keeping the sections from drying out during the immunohistochemical procedure is very important, as a high background of autofluorescence may result.
Place the slides in a slide rack in a Coplin jar and cover the slides with 0.01 M citrate buffer. Place the slides in the steamer for 5 min. Once antigen retrieval is complete, remove the slides from the steamer and allow them to cool for 20 min at room temperature. Wash the slides with distilled water for 5 min.
Remove each slide one at a time and label and circle the sections using a PAP pen to minimize the number of reagents needed for the procedure. Immediately after circling the sections, place the slides in the humidity box and cover the sections with PBS.
Prepare 10% normal goat serum by diluting normal goat serum into 1% BSA in auto buffer. Incubate the sections in 10% goat serum for 30 min (see Note 16).
Prepare a 1:500 dilution of monoclonal anti-adenoviral fiber (4D2, Lab Vision, Fremont, CA) and a 1:200 dilution of the rabbit polyclonal ATG5 antibody (Cosmo Bio Co., LTD), diluting them into 1% BSA in auto buffer. Gently tap the normal goat serum from each section and replace it with the primary antibody. Apply two drops of mouse and rabbit isotype control antibodies to sections designated as negative controls. Incubate the slides overnight at 4°C.
Wash the slides in PBS three times for 2 min. Prepare 10% goat serum by diluting normal goat serum into 1% BSA in auto buffer. Incubate the samples for 30 min. This step appears to reduce background fluorescence.
Prepare the secondary antibody by diluting Texas Red (fiber)- or Alexa Fluor 488 (Atg5)-conjugated secondary antibodies into 10% normal goat serum prepared with 1% BSA/auto buffer at 1:500. Incubate the slides for 30 min with a secondary antibody and then wash them three times for 2 min in PBS.
Cover the slides with ProLong antifade mounting medium according to the manufacturer’s directions, taking care to remove any bubbles formed beneath the coverslips. Although the slides can be viewed immediately, the ProLong data sheet states that antifade protection is highest after the mounting medium is allowed to dry overnight (see Note 17).
Acknowledgments
We thank Donald Norwood (Department of Scientific Publication, The University of Texas M. D. Anderson Cancer Center, Houston, TX) for editorial assistance. This work was supported by Alex Lemonade Stand Foundation, Brain Tumor Society, Marcus Foundation, and NIH P50CA127001.
Footnotes
Smaller fragments of tissue dissociate better and yield a higher number of neurospheres.
Check frequently the status of the tissue dissociation. The time required for tissue dissociation depends on the size of the tumor fragments. In addition, cell viability is reduced with prolonged digestion.
Plating the cells at a higher density facilitates a faster generation of neurospheres. The interval between subcultures is often determined by the growth rate of the neurospheres. It is important not to allow the neurospheres achieve a big size because cell viability may be impacted in successive subcultures.
Successful RNA isolation requires fast processing and careful handling of the tissue or cells prior to isolation. Be extremely cautious with the washings to avoid excessive losing of cells.
At this moment, the samples can be stored at 4 or −20°C for a later use.
This technique is very useful to detect significant differences in expression levels. However, if you want to quantify or detect subtle differences in expression, we recommend the use of quantitative RT-PCR.
It is crucial to obtain a single cell suspension in order to achieve a homogeneous labeling of the cells. In addition, it ensures that the cells flow properly through the cytometer.
We highly recommend the use of primary antibodies already labeled with your fluorochrome of choice. It saves you an extra step, which means saving time and the possibility to introduce more variations and errors.
It is necessary to dissociate the neurospheres at this time because MTS is not able to penetrate into the spheres efficiently, resulting in underestimation of the cell viability.
Although some degree of variability in the labeling might be observed, a 15-min loading is sufficient to attain a homogeneous staining.
The intensity of the red fluorescence is proportional to the degree of acidity and/or the volume of the cellular acidic compartment. Therefore, we could measure a change in the degree of acidity and/or the fractional volume of their cellular acidic compartment.
Most of the chemicals used for processing specimens for electron microscopy are extremely hazardous, especially glutaraldehyde, formaldehyde, osmium tetroxide, embedding medium in liquid form, lead citrate, and uranyl acetate. Extreme care should be taken when handling these chemicals. All steps must be performed in a fume hood and gloves should be worn all the time. Osmium tetroxide, glutaraldehyde, and propylene oxide/resin waste should be collected in bottles for safe disposal.
It is important to carry out this part of the technique in dark conditions to prevent uranyl acetate from being precipitated, as UA is photoreductive.
Before staining the ultrathin section, it is important to air dry for 2 h or overnight.
Brief tissue fixation shortly after interruption of vital functions preserves morphology and antigenicity.
It is preferable to use BSA with immunohistochemical grade.
If the fluorescence signal is too weak or the background is too high, check the composition of buffers and the working concentrations for the primary and secondary antibodies.
References
- 1.Furnari FB, Fenton T, Bachoo RM, et al. Malignant astrocytic glioma: genetics, biology, and paths to treatment. Genes Dev. 2007;21:2683–710. doi: 10.1101/gad.1596707. [DOI] [PubMed] [Google Scholar]
- 2.Galli R, Binda E, Orfanelli U, et al. Isolation and characterization of tumorigenic, stem-like neural precursors from human glioblastoma. Cancer Res. 2004;64:7011–21. doi: 10.1158/0008-5472.CAN-04-1364. [DOI] [PubMed] [Google Scholar]
- 3.Singh SK, Clarke ID, Terasaki M, et al. Identification of a cancer stem cell in human brain tumors. Cancer Res. 2003;63:5821–8. [PubMed] [Google Scholar]
- 4.Reynolds BA, Weiss S. Generation of neurons and astrocytes from isolated cells of the adult mammalian central nervous system. Science. 1992;255:1707–10. doi: 10.1126/science.1553558. [DOI] [PubMed] [Google Scholar]
- 5.Fueyo J, Gomez-Manzano C, Alemany R, et al. A mutant oncolytic adenovirus targeting the Rb pathway produces anti-glioma effect in vivo. Oncogene. 2000;19:2–12. doi: 10.1038/sj.onc.1203251. [DOI] [PubMed] [Google Scholar]
- 6.Fueyo J, Alemany R, Gomez-Manzano C, et al. Preclinical characterization of the antiglioma activity of a tropism-enhanced adenovirus targeted to the retinoblastoma pathway. J Natl Cancer Inst. 2003;95:652–60. doi: 10.1093/jnci/95.9.652. [DOI] [PubMed] [Google Scholar]
- 7.Ito H, Aoki H, Kuhnel F, et al. Autophagic cell death of malignant glioma cells induced by a conditionally replicating adenovirus. J Natl Cancer Inst. 2006;98:625–36. doi: 10.1093/jnci/djj161. [DOI] [PubMed] [Google Scholar]
- 8.Alonso MM, Jiang H, Yokoyama T, et al. Delta-24-RGD in combination with RAD001 induces enhanced anti-glioma effect via autophagic cell death. Mol Ther. 2008;16:487–93. doi: 10.1038/sj.mt.6300400. [DOI] [PubMed] [Google Scholar]
- 9.Jiang H, Gomez-Manzano C, Aoki H, et al. Examination of the therapeutic potential of Delta-24-RGD in brain tumor stem cells: role of autophagic cell death. J Natl Cancer Inst. 2007;99:1410–4. doi: 10.1093/jnci/djm102. [DOI] [PubMed] [Google Scholar]
- 10.Daido S, Kanzawa T, Yamamoto A, Takeuchi H, Kondo Y, Kondo S. Pivotal role of the cell death factor BNIP3 in ceramide-induced autophagic cell death in malignant glioma cells. Cancer Res. 2004;64:4286–93. doi: 10.1158/0008-5472.CAN-03-3084. [DOI] [PubMed] [Google Scholar]
- 11.Paglin S, Hollister T, Delohery T, et al. A novel response of cancer cells to radiation involves autmophagy and formation of acidic vesicles. Cancer Res. 2001;61:439–44. [PubMed] [Google Scholar]