

Abstract
Objectives:
To investigate changes in resting cerebral blood flow (CBF) after acute sleep restriction. To investigate the extent to which changes in CBF after sleep restriction are related to drowsiness as manifested in eye-video.
Design:
Participants were scanned for 5 min using arterial spin labeling (ASL) perfusion imaging after both sleep-restricted and rested nights. Participants were rated for visual signs of drowsiness in the eye-video recorded during the scan.
Setting:
Lying supine in a 3-Tesla magnetic resonance imaging scanner.
Participants:
Twenty healthy adults (age 20–37 yr) with no history of neurologic, psychiatric, or sleep disorder, and with usual time in bed of 7.0–8.5 h.
Interventions:
In the night before the sleep-restricted session, participants were restricted to 4 h time in bed.
Results:
There was an overall reduction in CBF in the right-lateralized fronto-parietal attentional network after acute sleep restriction, although this was largely driven by participants who showed strong signs of drowsiness in the eye-video after sleep restriction. Change in CBF correlated with change in drowsiness in the basal forebrain-cingulate regions. In particular, there was a pronounced increase in CBF in the basal forebrain and anterior and posterior cingulate cortex of participants who remained alert after sleep restriction.
Conclusions:
The pattern of cerebral activity after acute sleep restriction is highly dependent on level of drowsiness. Nondrowsy individuals are able to increase activity in the arousal-promoting brain regions and maintain activity in attentional regions. In contrast, drowsy individuals are unable to maintain arousal and show decreased activity in both arousal-promoting and attentional regions.
Citation:
Poudel GR; Innes CRH; Jones RD. Cerebral perfusion differences between drowsy and nondrowsy individuals after acute sleep restriction. SLEEP 2012;35(8):1085-1096.
Keywords: Alertness, arterial spin labeling, cerebral blood flow, drowsiness, perfusion, sleep restriction
INTRODUCTION
Lack of sufficient sleep can increase drowsiness and tendency to fall asleep during the day. Increased sleepiness is often manifested as response slowing, behavioral lapses,1–3 and changes in ocular and facial behaviors including droopy eyes, slow eyelid closure, head nodding, and loss of facial tone.4–6 Although total sleep deprivation of 24 h or more substantially impairs neurobehavioral functioning,7,8 an acute reduction in sleep to 4-6 h (sleep restriction) is sufficient to increase tendency to fall asleep during monotonous situations.9–13 Due to shift work, extended work hours, and jet lag, sleep restriction is also more common than total sleep deprivation in everyday life. The increased tendency to fall asleep after sleep loss can compromise an individual's and public safety, particularly in occupations such as truck drivers, locomotive drivers, pilots, air-traffic controllers, and process-control workers.14,15
For the measurement of behavioral alertness, previous work has relied on reaction time and response error during a sustained attention task,6,16,17 self-rating of sleepiness,18–20 or observer-rating of facial/eye videos.5,6,21 Experiments in which facial/ocular features have been used to measure drowsiness have relied on observable characteristics such as eye blinks, eye closures, staring, and overall facial changes that occur during increased propensity to fall asleep.5,6 Wierwille and Ellsworth5 proposed a system based on visual rating of facial video and found it to be reliable and consistent. Subsequent studies have shown that prolonged eyelid closure can reliably track intraindividual differences in performance and longer lapses that occur after sleep loss in both discrete vigilance tasks4,22 and continuous simulated driving and tracking tasks.13,23,24 Furthermore, time spent with eyes fully closed (PERCLOS) is sensitive to moderate to high levels of drowsiness and can provide a continuous estimate of propensity to fall asleep.25,26
The detrimental effects of sleep loss vary widely across individuals. These interindividual differences have been observed in different domains of neurobehavioral functioning, including behavioral alertness, attention, working memory, and executive function.1,9,27,28 For example, during sustained attention performance, the number of behavioral lapses varies greatly across individuals even after the same amount of sleep loss.1 Similarly, some individuals are severely impaired even after moderate sleep restriction, whereas others are resistant and able to maintain alertness at least until sleep loss is extreme.29,30 Although such inter-individual differences in vulnerability to sleep loss are believed to be due to trait-like characteristics,27 the exact nature of the differences is largely dependent on the type of cognitive tasks used. Thus, individuals who are vulnerable to impairment during simple visual tasks after sleep loss may not show the same degree of impairment on more complex tasks.29,31–33 Large interindividual differences in drowsiness may exist even during an eyes-open resting state when individuals are not required to actively perform a task. However, overall interindividual differences in drowsiness after sleep restriction remain poorly understood.
Decline in behavioral alertness after sleep loss is reflected in regional cerebral changes measured using neuroimaging methods. For example, metabolic rate measured by positron emission tomography (PET) decreases in thalamic, parietal, and prefrontal cortices during various cognitive tasks performed after total sleep deprivation.34–36 Similarly, functional magnetic resonance imaging (fMRI) studies have reported decreases in neuronal activity during working memory and attention tasks after sleep deprivation.3,37,38 However, some fMRI studies have shown that the level of task-related cortical and subcortical activity is dependent on vulnerability to sleep loss, with resistant individuals able to maintain trial-to-trial activity in fronto-parietal and thalamic brain regions despite sleep deprivation of 24 h or more longer.38,39 A perfusion study, based on the relatively new noninvasive MRI-based technique of arterial spin labeling (ASL), quantified time-on-task-related cerebral blood flow (CBF) changes in attention and arousal-related brain regions, and found them to correlate well with amount of performance decline in persons who are not sleep deprived.17 Although these studies provide insight into cerebral correlates of deficits in specific cognitive processes, the neuronal changes are largely dependent on task characteristics such as complexity and type.40 No study has investigated cerebral perfusion changes specifically associated with acute sleep restriction and drowsiness in the resting state. Two studies presented at scientific conferences provide support for the feasibility of ASL-based perfusion studies of sleep deprivation.41,42
In this study, we used ASL and ocular features of drowsiness in eye video (based on criteria by Wierwille and Ellsworth5) to (1) quantify changes in CBF after acute sleep restriction; (2) determine the extent to which changes in CBF after acute sleep restriction are related to changes in level of drowsiness; and (3) investigate differences in CBF between individuals who were drowsy after acute sleep restriction (‘Drowsy') and individuals who remained alert following acute sleep restriction (‘Nondrowsy').
METHODS
Participants
Twenty right-handed volunteers (10 males and 10 females, age 20-37 yr, mean age 24.9 yr) with no history of neurologic, psychiatric, or sleep disorder participated in the study. For inclusion in the study, participants had to report a usual time to bed between 22:00 and 24:00 and a usual time in bed of between 7.0–8.5 h. Ethical approval for the study was obtained from the New Zealand Upper South B Regional Ethics Committee.
Study Procedure
All participants visited the laboratory 3 times. On the 1st visit, they were briefed on the experimental protocol and provided with an Actiwatch (Respironics Inc., Murrysville, PA, USA) and a detailed sleep diary to record their sleep habits for 6 days and 5 nights before each of the 2 experimental sessions. They also recorded time of intake of coffee, alcohol, and food in the diary. The 2nd and 3rd visits involved sleep-restricted and rested sessions, the order of which was counterbalanced across the participants. The sessions were 1 wk apart to minimize residual effects of sleep restriction in participants who were sleep-restricted during the 1st session.
The participants were asked to sleep normal hours during the wk prior to the rested session. They were asked to do likewise for the sleep-restricted session except for the immediately preceding night in which their time in bed was restricted to 4 h (03:00-07:00). Participants were requested not to engage in any safety-sensitive tasks (such as driving) after the sleep restriction. They were also asked not to consume any stimulants or depressants, such as alcohol, caffeine, and nicotine, on the day of either experimental session.
On the day of the scan, participants arrived at the laboratory 1 h before the scanning session. Sleep habits recorded in the Actiwatch and sleep diary were inspected prior to each of the ASL scanning sessions to confirm compliance with the sleep schedule required for inclusion in the study. The sleep diary was used to confirm that participants did not consume any prohibited substances (coffee and alcohol) on the day of scanning. Participants were provided with a lunch of hot noodles. Participants rated their current subjective sleepiness using the Karolinska Sleepiness Scale (KSS)43 and Stanford Sleepiness Scale (SSS)18 before entering the scanner room. Their general propensity to fall asleep during the day was estimated using the Epworth Sleepiness Scale (ESS).19 The participants entered the scanner room between 13:00 and 14:30.
Each participant lay supine in the scanner and was asked to keep his or her eyes open during the 4-min structural scan and the following 5-min ASL scan. During the ASL scan, participants were asked to look at a cross in the center of a screen presented via MRI-compatible goggles (Avotec Inc., Stuart, FL, USA) with a gray background.
Video of the right eye was captured using a Visible Eye™ system (Avotec Inc.) mounted on the head-coil of the MRI scanner. The video was recorded on a PC at 25 fps (350 × 280 px) using a video-capture card and custom-built video recording software. The video recording was synchronized with the start of the ASL scan.
Imaging Procedure
All participants underwent imaging using a Signa HDx 3.0 T MRI Scanner (GE Medical Systems, Milwauke, WI, USA) with an 8-channel head coil. High-resolution anatomic images of the whole brain were acquired using T1-weighted anatomic scans (repetition time: 6.5 ms; echo time: 2.8 ms; inversion time: 400 ms; field of view: 250 × 250 mm; matrix: 256 × 256; slice thickness: 1 mm). Whole-brain perfusion was measured quantitatively using a stack of spiral fast-spin-echo-acquired images prepared with pseudocontinuous ASL and background suppression44 (repetition time: 6 s; echo spacing: 9.2 ms; postlabeling delay: 1.5 s; labeling duration: 1.5 s; 30 phase-encoded 5-mm-thick slices; in-plane resolution: 1.88 × 1.88 mm; total scan time: 5 min 11s; units: ml/100g/min).
To quantify CBF, the difference between the untagged and tagged images was calculated by 45,46
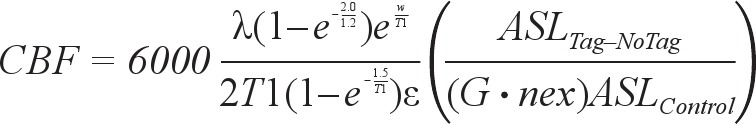 |
where a scaling factor of 6,000 is used to convert L/kg/s to ml/100g/min, λ is the brain-blood partition coefficient of water (set to the whole brain average of 0.9),47 w is the postlabelling delay of 1.5 s, T1 is the characteristic T1 time for blood (1.6 s at 3T), G is the gain applied to the tagged image (set to 32), nex is the number of excitations or averages in the sequence (set to 5), ε is the combined efficiency of labelling and suppression (set to 0.6), ASLTag–NoTag is the difference between the image acquired with and without labeling (with background suppression), and ASLControl is the proton density-weighted image acquired with no labeling. The partial saturation of the control image is corrected for a T1 of 1.2 s typical of gray matter. A quantitative CBF map from a representative subject is shown in Figure 1.
Figure 1.

A quantitative cerebral blood flow map from a representative study participant.
Preprocessing of MRI Data
The MRI data were preprocessed using FMRIB's Software Library (FSL, www.fmrib.ox.ac.uk/fsl) and custom Linux Shell and Matlab scripts (Matlab 7.6.0, R2008a, Mathworks, Natick, MA, USA). Each participant's ASL-derived CBF maps from both sessions were coregistered to their structural image using a linear registration tool (FLIRT).48 The structural images were registered to the MNI152 standard space using a non-linear registration tool (FNIRT). Registration parameters produced by the nonlinear registration process were then used to warp the perfusion images into a standard 2 × 2 × 2 mm3 Montreal Neurological Institute (MNI) template. Normalized perfusion images were spatially smoothed with a 10-mm gaussian kernel (full width at half maximum). Further analysis was limited to slices superior to the mid-cerebellum as inferior slices contained spiral artifacts in some participants.
Observer Rating of Drowsiness
Each participant's 5-min eye video, recorded during ASL scans, was independently visually rated for signs of drowsiness by 2 raters. Drowsiness was rated based on the visual scoring method proposed by Wierwille and Ellsworth.5 This rating system is based on observable personal characteristics including eye blinks, eye closures, and staring. The rating system has 5 levels of drowsiness on an analog scale of 0–100 (not drowsy = 0, slightly drowsy = 25, moderately drowsy = 50, very drowsy = 75, and extremely drowsy = 100). The 2 observers were provided with the analog rating scale and a description of the drowsiness spectrum customized for drowsiness characteristics in the eye video.5 Level of drowsiness was rated as an average rating over each min and then an overall average across the 5 min was calculated. Full eye closures longer than 500 ms were also identified and marked. The raters independently scrolled through eye videos using a video player (SyncPlayerTM, Custom-built software), which allowed the replay of eye videos frame by frame. The average of the drowsiness scores from the 2 raters was used for further analysis.
A rater-independent measure of drowsiness for each participant was obtained by calculating distance between upper and lower eyelids for each eye video frame (every 40 ms) via a vertical integral projection method.49 The distance between eye-lids was converted to a percentage relative to distance between upper and lower eye-lids when eyes were fully open (percentage eye closure). To be clear, percentage eye closure is not a measure of percent time that eyes were fully closed (e.g, PERCLOS5). The mean percentage eye closure in the 5 min was then correlated against visually rated drowsiness scores.
Data Analysis
Paired t-tests were performed to investigate differences in drowsiness scores and subjective sleepiness between rested and sleep-restricted sessions.
To investigate differences in regional CBF between the sleep-restricted and rested sessions, we implemented a general linear model for a 2-sample paired t-test with an adjustment for global CBF differences. The general linear model analysis tool available in FSL (fsl_glm) was used to perform multiple regression. Inference was carried out using cluster-based thresholding. Clusters were defined by first thresholding the raw Z-statistics map at Z > 2.3 and finding contiguous clusters of suprathreshold voxels, using 26-neighbor connectivity. The clusters were thresholded at a level of P < 0.05 after correcting for multiple comparisons across space (i.e., controlling the family-wise error (FWE) for the whole brain) using random field theory.
To determine if there was any relationship between absolute CBF and subjective sleepiness and drowsiness, in either rested or sleep-restricted sessions, we performed voxel-wise linear regression analyses between absolute CBF and drowsiness scores and absolute CBF and sleepiness (KSS) scores, with age, sex, and global CBF as covariates of no interest. The general linear model analysis tool available in FSL (fsl_glm) was used to perform voxel-wise multiple regression. Inference was carried out using cluster-based thresholding (Z > 2.8, P < 0.01).
To test our hypothesis that changes in CBF after sleep restriction may be associated with differences in drowsiness and subjective sleepiness, a voxel-wise linear regression analysis was performed between change in CBF and change in drowsiness and change in sleepiness (KSS), with age and sex as covariates of no interest. Inference was carried out using cluster-based thresholding (Z > 2.8, P < 0.01). Brain regions corresponding to significant activity were identified using known neuroanatomic landmarks50 and guided by the Harvard-Oxford Cortical and Subcortical Structural Atlas (included in the FSL software).
To investigate the extent to which changes in CBF following sleep restriction are related to drowsiness, participants were split into ‘Drowsy' and ‘Nondrowsy' groups according to their drowsiness scores at the sleep-restricted session (Non- drowsy: drowsiness score < 25; Drowsy: drowsiness score ≥ 25). Statistical tests were performed on both groups to determine if the actual sleep hours, number of eye closures, and total duration of eye closures differed between sessions and between groups. A voxel-wise unpaired t-test was performed to investigate regional differences in perfusion between both groups at rested baseline. Statistical maps were thresholded at Z > 2.3, P < 0.05 corrected for multiple comparisons using cluster-based thresholding.
Changes in CBF between the rested and sleep-restricted sessions for these 2 groups were compared in 3 regions from the attentional network (right inferior frontal, right intraparietal, and medial frontal cortex), 3 regions from the arousal-promoting network (basal forebrain, anterior cingulate, and posterior cingulate cortex), and bilateral thalamus. These regions have been previously shown to be involved in fatigue-related performance decline and vulnerability to sleep loss.17,38,51 Each region of interest was a sphere (diameter = 10 mm) centered at a local maximum in the statistical map obtained from group-level comparison of sleep-restricted CBF and rested CBF (Table 1) and correlation between change in CBF and drowsiness across all participants (Table 2). Thalamic regions of interest were centered at MNI coordinates (right: 12, −14, 14 and left: −8, −16, 12) representing the anterior dorsal area of thalamus, which has been shown to be involved in alertness in previous studies.3,38 We also performed analyses of independently-selected structurally-defined regions of interest (ROIs). The ROI structures were identified with the aid of the Harvard-Oxford Cortical Atlas and ROIs defined in previous literature.3,17 A 2 × 2 (group by scan session) analysis of variance was conducted to examine the effects of sleep loss and drowsiness on CBF in the regions of interest. The changes in CBF after sleep restriction within the 2 groups was evaluated with paired t-tests. False discovery rate- based correction for multiple comparisons52 was applied for the number of ROIs investigated. Results were considered to be significant at P < 0.05 (corrected). A separate analysis was performed on CBF data after excluding individuals in the Drowsy group who were drowsy even when rested.
Table 1.
Brain regions included in the cluster that showed decreased CBF (Z > 2.3, P < 0.05, family-wise error-corrected) following a night of sleep restriction
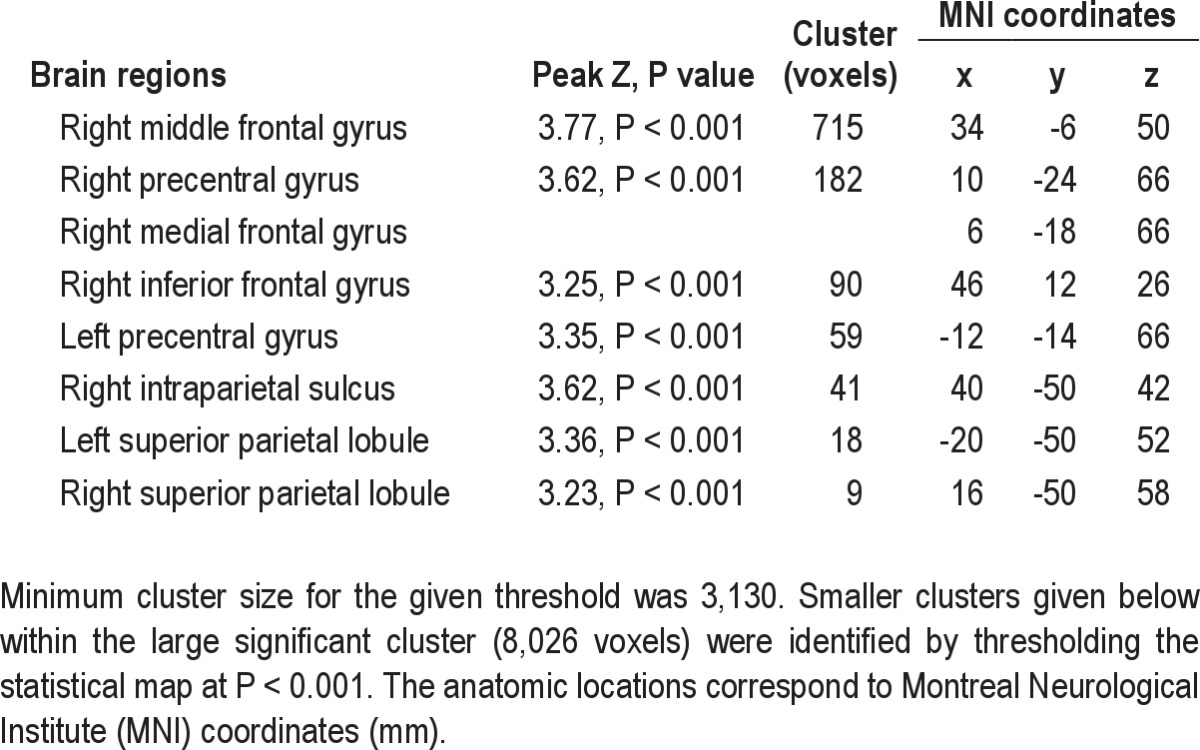
Table 2.
Brain regions included in the cluster that showed a significant relationship (Z > 2.8, P < 0.01, family-wise error-corrected) between change in absolute cerebral blood flow and change in drowsiness after sleep restriction

RESULTS
Based on actigraphy analysis, we determined that the participants (n = 20) had 7.95 ± 0.94 h (mean ± standard deviation) of sleep during the night before the rested scan and 3.60 ± 0.26 h of sleep before the sleep-restricted scan.
Behavioral Effects of Acute Sleep Restriction
The participants reported being more sleepy during the sleep-restricted session than during the rested session as assessed by both SSS (3.15 versus 1.85, paired t-test, t(19) = 7.1, P < 0.001) and KSS (5.28 vs 2.98, t(19) = 7.0, P < 0.001).
A more objective rating of the drowsiness of participants was assessed by visual rating of the eye video by the 2 independent raters. One participant was removed from the drowsiness analysis due to a technical problem, which meant that eye video was not recorded during the sleep-restricted session. The interrater reliability of the visually rated drowsiness scores was very high (average of raters intraclass correlation coefficient = 0.95, 2-way mixed effects model). The visually rated drowsiness scores were strongly correlated with mean percentage eye closure in both rested (r = 0.75, P = 0.002) and sleep-restricted (r = 0.86, P = 0.002) (Figure 2) sessions calculated automatically using a vertical intensity projection method. There was a moderate correlation between ESS and visually-rated drowsiness in both the rested session (r = 0.49, P = 0.032) and the sleep-restricted session (r = 0.63, P = 0.004). However, there was no correlation between subjective state sleepiness just prior to scanning and visually rated drowsiness in both rested (KSS: r = −0.18 and SSS: r = −0.03) and sleep-restricted (KSS: r = −0.05 and SSS: r = 0.03) sessions.
Figure 2.

Relationship between observer-rated drowsiness and percentage eye closure (PEC). (A) Moving averaged percentage eye closure (PEC (%), step = 1 s, window = 30 s) in 2 representative participants. The left graph depicts fluctuations in PEC in a nondrowsy participant with drowsiness scores close to zero in both rested and sleep-restricted sessions. The right graph depicts PEC in a drowsy participant with a low drowsiness score in rested but a very high drowsiness score in the sleep-restricted condition. (B) Strong correlations were observed between mean PEC and drowsiness score in both rested and sleep-restricted conditions.
There was a difference in visually-rated drowsiness scores between rested (17.6 ± 24.1%) and sleep-restricted (34.1 ± 29.7%) sessions (t(18) = 2.81, P = 0.001). However, a considerable interindividual variance in drowsiness was observed. Eight participants were not drowsy or less than slightly drowsy (i.e., drowsiness score < 25%) in both rested and sleep-restricted sessions. Six participants were not drowsy (drowsiness scores: 0-21%) during the rested session but became drowsy to extremely drowsy (32.5-87.5%) after the sleep-restricted session. Four participants were drowsy in both the rested session (33.8-73.8%) and the sleep-restricted session (50.0-97.5%). In stark contrast to the other participants, 1 participant was moderately drowsy (60%) in the rested session but less than slightly drowsy (20%) in the sleep-restricted session.
ASL-Derived Perfusion Maps
Perfusion images obtained using ASL were removed from analysis for 2 participants due to movement. There was a good sensitivity in perfusion and a good contrast between gray and white matter in the remaining participants. There was no difference in global CBF values between rested and sleep-restricted conditions (rested 43.1 ± 7.2 versus sleep restricted 43.0 ± 6 mL/100 g/min).
Effects of Sleep Restriction on Regional Perfusion
Voxel-wise comparison of regional perfusion revealed decreased CBF (Z > 2.3, P < 0.05, cluster-based FWE-corrected), after adjusting for global CBF, in a large cluster encompassing the right inferior frontal gyrus and middle frontal gyrus and the bilateral superior frontal gyrus, precentral gyrus, and posterior parietal cortex (Figure 3, Table 1). The right posterior parietal deactivation (decreased CBF) extended to the superior parietal lobule, intraparietal sulcus, and supramarginal gyrus, whereas the left posterior parietal deactivation was limited to the superior parietal lobule. There were considerable interregional differences in the absolute CBF in these regions, both for the rested and sleep-restriction sessions (Figure 3B).
Figure 3.
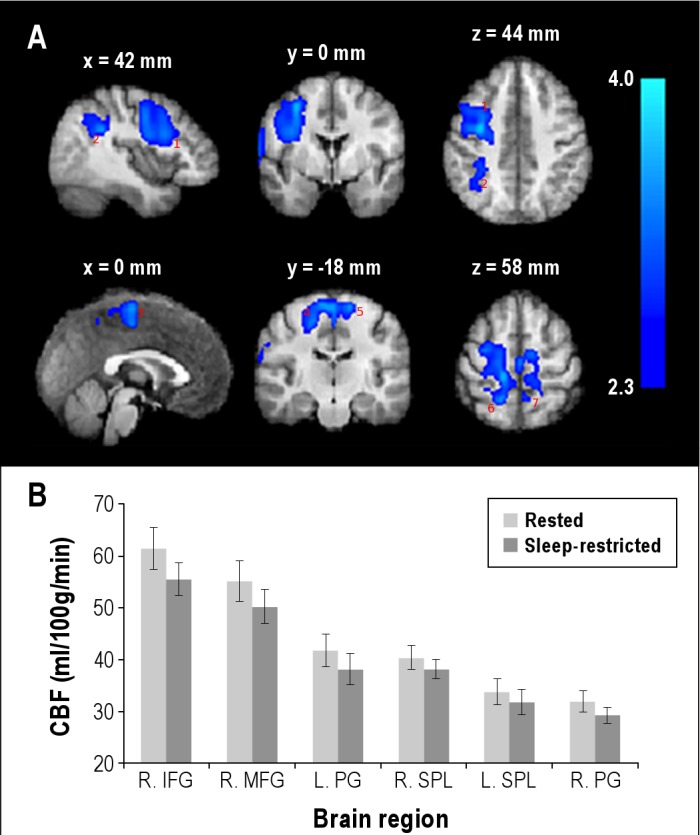
Average changes in regional cerebral perfusion after acute sleep restriction. (A) Brain regions with decreased cerebral blood flow (CBF) (Z > 2.3 (i.e., voxel-wise P < 0.01), cluster P < 0.05, cluster-based family-wise error correction), after adjusting for global CBF, after a night of sleep restriction. The brain regions were right middle/inferior frontal gyrus (1), intraparietal sulcus (2), medial frontal gyrus (3), bilateral precentral gyrus (4,5), and bilateral superior parietal lobules (6,7). The slices are presented in radiological convention and labeled with axial MNI coordinate. The statistical maps are overlaid on an average of the anatomical scans obtained from all participants normalized to a standard MNI template. (B) Absolute CBF in the above brain regions: right middle frontal gyrus (R. MFG), right inferior frontal gyrus (R. IFG), bilateral precentral gyrus (R. PG and L. PG), and bilateral superior parietal lobule (R. SPL and L. SPL). Absolute CBF in each of these brain regions was obtained by averaging CBF in a spherical region (diameter = 10 mm) centered at a local maximum (listed in Table 1). The vertical bars represent the standard error of the mean.
We also observed increased CBF after sleep restriction at P < 0.01 (uncorrected, extent threshold of 100 voxels) in the right occipital gyrus, left inferior lateral occipital gyrus, left middle temporal gyrus, and medial frontal gyrus. However, the increased CBF did not survive the correction for multiple comparisons using cluster-based correction at Z > 2.3, P < 0.05.
Perfusion and Subjective Sleepiness
A voxel-wise multiple regression analysis did not reveal a significant relationship between subjective sleepiness (KSS) and CBF when rested. When sleep was restricted, a trend toward a negative relationship (Z > 2.8, contiguous voxels > 50, uncorrected) between KSS and CBF was observed in the right precuneus/cingulate area (Z = 4.8, P < 0.001, MNI: 12, −54, 48 mm). However, this did not survive a whole brain family-wise error correction. Furthermore, no relationship was observed between change in subjective sleepiness (KSS) and change in CBF.
Perfusion and Drowsiness
When rested, a trend toward a positive relationship (Z > 2.8, contiguous voxels > 50, uncorrected) between absolute drowsiness and absolute CBF was observed in the right lateral occipital cortex (Z = 4.0, P < 0.001, MNI: 34, −78, 16 mm), bilateral precuneus (Left: Z = 3.8, P < 0.001, MNI: −14, −62, 48 mm; right: Z = 3.6, P < 0.001, MNI: −12, −62, 46 mm), right insular cortex (Z = 3.4, P < 0.001, MNI: 38, −10, −6 mm), and occipital pole (Z = 3.3, P < 0.001, MNI: −4, −94, −12 mm). However, when sleep was restricted, a trend toward a positive relationship (Z > 2.8, contiguous voxels > 50, uncorrected) was observed only in the right precuneus (Z = 4.6, P < 0.001, MNI: 12, −54, 50), right lateral occipital cortex (Z = 4.1, P < 0.001, MNI: 30, −84, 14), and right insular cortex (Z = 3.3, P < 0.001, MNI: 38, −20, −2) and a trend toward a negative relationship was observed in the right precentral gyrus (Z = 3.8, P < 0.001, MNI: 62, 12, 20 mm). However, these relationships did not survive a whole-brain FWE correction.
To determine how within-subject change in drowsiness after sleep loss affects perfusion, we investigated the relationship between change in CBF and change in drowsiness. A moderate negative correlation (r = -0.50, P = 0.04) was observed between change in global CBF and change in drowsiness. A voxel-wise multiple regression analysis between change in CBF and change in drowsiness revealed a specific brain network (Z > 2.8, P < 0.01, cluster-based FWE correction) showing a strong negative correlation (r = −0.77, P < 0.001) (Figure 4, Table 2). The negative correlation was localized in the right lateralized basal ganglia (putamen, striatum), basal forebrain (anterior hypothalamus, orbitofrontal cortex, subcallosal cortex), supplementary motor area, cingulate gyrus (both anterior and posterior), and superior temporal areas. Figure 4B shows a plot of average change in CBF in these areas against change in drowsiness.
Figure 4.
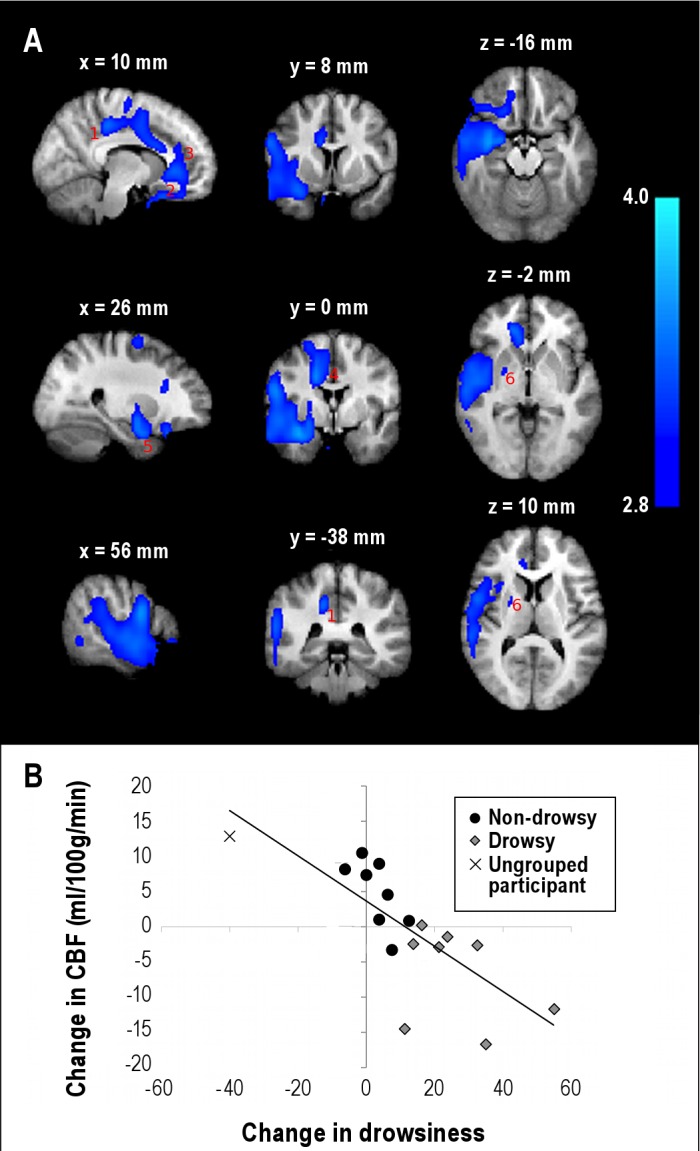
Relationship between change in drowsiness and change in absolute cerebral blood flow (CBF) after acute sleep restriction. (A) Brain regions showing a negative linear relationship (Z > 2.8 (i.e., voxel-wise P < 0.02), cluster P < 0.01, cluster-based family-wise error correction) between change in CBF and change in drowsiness in going from rested to sleep-restricted. The brain regions included the right posterior cingulate gyrus (1), basal forebrain (2), anterior cingulated gyrus (3), supplementary motor area (4), amygdyla (5), and basal ganglia (6). The statistical maps are overlaid on an average of the anatomic scans from all participants normalized to a standard Montreal Neurological Institute template. (B) Scatter plot (r = −0.77, P < 0.001) of the average change in CBF in the significant brain regions against change in drowsiness.
Perfusion in Drowsy and Nondrowsy Individuals
The participants who were moderately drowsy (60%) in the rested session but less than slightly drowsy (20%) in the sleep-restricted session were considered anomalous outliers to the extent of exclusion from this analysis. The remaining participants (n = 16) were split into Nondrowsy and Drowsy groups according to their drowsiness in the sleep-restricted session (Figure 5). There was no difference in mean actual sleep hours between the Drowsy and the Nondrowsy group in the wk before the rested session (Drowsy: 7.10 ± 0.48 h; Nondrowsy: 7.43 ± 0.60 h) and the wk before (excluding the sleep-restricted night) the sleep-restricted session (Drowsy: 7.03 ± 0.34 h; Nondrowsy: 7.08 ± 0.58 h). There was no difference in the mean number of eye closures in the sleep-restricted session compared with the rested session in either the Drowsy group (17.5 versus 12.1, t(7) = −1.0, P = 0.30) or the Nondrowsy group (0.6 versus 0.9, t(7) = 1.0, P = 0.35) group. There was also no difference in total duration of eye closure in the sleep-restricted session compared with the rested session in either the Drowsy group (34.0 versus 28.8 s, t(7) = −0.54, P = 0.61) or the Nondrowsy group (1.1 versus 0.8 s, t(7) = −0.52, P = 0.60). However, the Drowsy group was substantially more drowsy when sleep was restricted than when rested (average change in drowsiness = 26.1%, t(7) = 5.1, P = 0.001), in contrast with the Nondrowsy group, who showed no difference in drowsiness (3.3%, t(7) = 1.6, P = 0.15). The Drowsy group also had a higher mean drowsiness score compared to the Nondrowsy group in the rested session (t(14) = 2.4, P = 0.03). Average sleep in the night before the sleep-restricted scan was higher in the Drowsy group than in the Nondrowsy group (3.7 versus 3.4, t(14) = 2.3, P = 0.04).
Figure 5.

Level of drowsiness in the rested and sleep-restricted sessions in the participants who were drowsy after sleep restriction (‘Drowsy') and those who remained alert (‘Nondrowsy') after sleep restriction.
A voxel-wise 2-sample t-test did not reveal any significant difference in perfusion (thresholded at Z > 2.3, P < 0.05, cluster-based correction) between the Drowsy and Nondrowsy groups at the rested baseline.
ROI analysis also showed no difference in CBF between the Drowsy and Nondrowsy groups in any of the attentional regions of interest (P > 0.05). However, analysis of variance showed a significant interaction (P < 0.05, False Discovery Rate (FDR) corrected) between session (rested/sleep-restricted) and group (Drowsy/Nondrowsy) for CBF in the right inferior frontal gyrus (F(1, 14) = 11.9, P = 0.011), intraparietal sulcus (F(1, 14) = 14.9, P = 0.008), and right medial frontal gyrus (F(1, 14) = 9.4, P = 0.016). When within-group comparisons were conducted, the Drowsy group showed a decreased CBF in the right inferior frontal gyrus (t(7) = 3.3, P = 0.037), intraparietal sulcus (t(7) = 3.8, P = 0.028), and medial frontal gyrus (t(7) = 4.0, P = 0.028) (Figure 6). In contrast, CBF in these attentional brain regions was unchanged in the Nondrowsy group.
Figure 6.

Changes in absolute cerebral blood flow (CBF) in attentional areas in the Drowsy and the Nondrowsy participants after acute sleep restriction. (A) In the Nondrowsy group, there was no change in CBF after sleep restriction in the functional regions of interest (ROIs); the right inferior frontal gyrus (R. IFG, Montreal Neurological Institute (MNI): 46, 12, 26), right intraparietal sulcus (R. IPS, MNI: 40, −50, 42), and right medial frontal gyrus (R. MeFG, MNI: 6, −18, 66) and the structural ROIs: R. IFG (MNI: 50, 16, 22) and R. IPS (MNI: 50, −41, 52). A structural ROI at R. MeFG, MNI: 5, −4, 65) showed a significant increase in CBF in the Nondrowsy group. (B) In contrast, the Drowsy group showed decreased CBF in these brain regions in the sleep-restricted session compared to the rested session. *P < 0.05, **P < 0.01 (False discovery rate corrected).
ROI analysis showed no difference in CBF between the Drowsy and Nondrowsy groups in any of the arousal-promoting regions of interest (P > 0.05). ROI analysis in arousal-promoting brain regions showed quite divergent changes in perfusion after sleep loss (Figure 7). A significant interaction between session (rested/sleep-restricted) and group (Drowsy/Nondrowsy) was observed for CBF in the basal forebrain (F(1, 14) = 20.9, P < 0.001), anterior cingulate gyrus (F(1, 14) = 6.7, P = 0.031), and posterior cingulate gyrus (F(1, 14) = 6.5, P = 0.031). In the basal forebrain (subcallosal cortex) there was an increase in CBF in the Nondrowsy group (t(7) = 6.3, P = 0.003) but only a trend toward a decrease in the Drowsy group (t(7) = 2.4, P = 0.094). Likewise, the posterior cingulate gyrus showed no change in CBF in the Drowsy group (t7 = 0.9, P = 0.41) but increased CBF in the Nondrowsy group (t(7) = 3.7, P = 0.032). The anterior cingulate gyrus showed no change in CBF in the Drowsy group (t(7) = 1.3, P = 0.293) and a trend toward an increase in the Nondrowsy group (t(7) = 2.5, P = 0.101).
Figure 7.

Changes in absolute cerebral flood flow (CBF) in arousal-promoting areas in the Drowsy and the Nondrowsy groups after acute sleep restriction. (A) In the Nondrowsy group, there was increased CBF after sleep restriction in the functional regions of interest (ROIs): right posterior cingulate gyrus (R. PCG, Montreal Neurological Institute (MNI): 14, −32, 42), right anterior cingulate gyrus (R. ACG, MNI: 14, 38, 0), and right basal forebrain (R. BF, MNI: 10, 16, −20) and in the structural ROIs: R. PCG (MNI: 2, −44, 30), R. ACG (MNI: 2, 40, 10), and R. BF (MNI: 0, 24, −14). (B) In contrast, the Drowsy subjects showed decreased CBF in the right basal forebrain but no change in the other regions in the sleep-restricted session compared to the rested session. *P < 0.05, **P < 0.01 (False discovery rate corrected).
There was no change in CBF in either the right or left thalamus in either the Drowsy group (right: [t(7) = 1.1, P = 0.31] and left: [t(7) = 2.1, P = 0.112]) or the Nondrowsy group (right: [t(7) = 1.8, P = 0.192 and left: [t(7) = 1.3, P = 0.286]) after acute sleep restriction. Independent structurally defined ROIs were used to verify that the divergent change in perfusion in the Drowsy and Nondrowsy groups were not biased by the ROI selection process used in the study. Figure 6 and 7 show results from both functional and structural ROIs.
Exclusion of Individuals Drowsy When Rested
Five participants recruited in our study were drowsy (drowsiness scores > 25) even when rested. Although these participants had an amount of sleep (6.90 ± 0.49 h) in the 6 nights prior to the rested session similar to those who were not drowsy in the rested session (7.40 ± 0.54 h), they may have had a greater need for sleep than they received. To ensure that our findings were not confounded by this information, we reanalyzed the data excluding these 5 participants. The results were unchanged with a multiple regression analysis between change in drowsiness and change in CBF still showing a negative linear relationship (Z > 2.8, P < 0.01, cluster-based correction) in the arousal-related network after the exclusion of the 5 participants who were drowsy when rested. The correlation in the local maximum in the right posterior cingulate gyrus was r = −0.78 (P < 0.01) with n = 12, which is very similar to the r = -0.81 observed with N = 17.
Furthermore, the decrease in CBF in attentional ROIs persisted even after the exclusion of the participants who were drowsy when rested. Even with a small n, there was a significant decrease in CBF in the right medial frontal gyrus (t = 4.49, P = 0.01). The other 2 attentional regions, the right inferior frontal and right intraparietal sulci also showed strong trends toward decreased CBF at P = 0.09 and P = 0.07, respectively, with n = 4.
DISCUSSION
This is the first study to have used ASL-based perfusion imaging to investigate regional changes in resting CBF after acute sleep restriction and the first to have compared these changes between drowsy and nondrowsy individuals. Although changes in eyelid behaviors have been used for estimation of drowsiness,6,53,54 no study has done so using an MRI or PET scanner. By estimating drowsiness manifested in the eye videos, we found that the reduction in CBF in the right-lateralized frontoparietal attentional network after acute sleep restriction was largely driven by drowsy individuals, with nondrowsy individuals able to preserve CBF in these areas. Furthermore, we revealed an association between drowsiness and perfusion in the basal forebrain-cingulate cortex arousal-promoting network. In particular, this network showed an increase in CBF in the individuals who were able to remain nondrowsy after acute sleep loss. Finally, contrary to expectations, there was no change in thalamic perfusion after acute sleep restriction in either drowsy or nondrowsy individuals.
It is well established that sleep loss destabilizes wakefulness and sleep-promoting processes, producing impairments in cognitive, psychomotor, visuomotor, and ocular behavior.1,2,7–11,33,54 Not surprisingly, we found an overall increase in drowsiness in our participants after acute sleep restriction to a mean of 3.6 h during the preceding night. However, there was a substantial amount of interindividual difference in the degree of drowsiness across our participants. Some participants were able to maintain an eyes-open alert state during the ASL scan, whereas others showed signs of extreme drowsiness with frequent droopy eyes and slow eye closures, even during the relatively short 5-min ASL scanning period. Consistent with previous studies,5,21 the drowsiness rating system used in our study had a very high interrater reliability, suggesting that interrater variability had minimal influence on the observed interindividual differences. Previous studies have suggested that interindividual differences in neurobehavioral impairment after sleep loss are primarily due to trait-like differential vulnerabilities.27 We did not incorporate repeat sessions into our experimental design and, hence, are unable to confirm this trait vulnerability. However, from repeat measures of drowsiness, we observed moderate correlations between drowsiness scores and ESS, which is considered to be strongly related to the trait-like aspects of sleepiness.19,26 There was no evidence that the drowsiness observed in some participants was due to their getting less sleep during the sleep-restricted night; the Drowsy group had slightly more sleep during the sleep-restricted night. Several individuals were also drowsy during the rested session, and, hence, it could be speculated that they may have already been partially sleep-deprived. These individuals had an average actual sleep of 6.9 ± 0.49 h in the 6 nights before the rested session, which was not significantly different (unpaired t-test, t(14) = −1.7, P = 0.11) from the average actual sleep (7.4 ± 0.54 h) in the remaining individuals. However, we cannot rule out the possibility that the individuals who were drowsy when ‘rested' do need more sleep than they received during the resting wk. Surprisingly, there was no correlation between self-reported ‘state' sleepiness (i.e., KSS and SSS) taken just before scanning and observer-rated drowsiness during the scan. However, similar findings have been reported previously in sleep-deprived individuals with no association observed between subjective and objective measures of alertness.8
The neuronal consequences of sleep loss have been widely investigated using neuroimaging techniques such as PET34–36,55 and Blood-oxygen-level-dependent dependent (BOLD) fMRI.3,38–40,56,57 PET studies have shown that total sleep deprivation of 24 h or longer decreases global neuronal activity.34,35 In the current study, we observed no difference in global CBF after sleep restriction. However, we used a less severe sleep restriction protocol of 4 h time in bed and observed large interindividual differences in behavior. Therefore, it may not be surprising that, overall, there was no significant reduction in global CBF. This finding notwithstanding, there were significant regional changes. In particular, the right inferior frontal and posterior parietal areas have been long established as important for maintenance of visual attention and alertness,56,58,59 with an overall reduction in cerebral perfusion and BOLD fMRI signal in these areas during various attentional and cognitive tasks after sleep deprivation.3,39,55 Our data have extended these findings by showing that neural activity in these regions is modulated after sleep loss even during eyes-open resting. We also found decreased activity in the bilateral precentral, medial/superior frontal, and superior parietal areas. The medial frontal area has been shown to be involved in eye movements60 and the bilateral superior parietal and precentral areas are sensory-motor integration areas, within which decreased activity likely reflects an overall reduction in behavioral responsiveness after sleep loss.61
Importantly, by grouping participants into Drowsy and Nondrowsy groups according to their drowsiness level after sleep restriction, we were able to better elucidate the consequences of sleep loss across different individuals. We found that the Nondrowsy group was able to preserve activity in the frontoparietal attentional areas, whereas the Drowsy group showed a considerable reduction in CBF in these regions. Could the individuals who were drowsy when rested have confounded our findings due to the possibility of their being already partially sleep-restricted? This does not appear to be the case, as a reanalysis by excluding these individuals did not alter our main findings. Previous neuroimaging studies using PET and fMRI have found that sleep loss-related reductions in activity in frontoparietal areas mirror deteriorations in task performance.35,57 Similarly, a recent study has shown that individuals vulnerable to the effects of sleep deprivation to selective attention have attenuated top-down frontoparietal control.38 Another study showed that ASL-derived-CBF decreases in this frontoparietal network correlate with a decline in vigilance during a sustained attention task even in nonsleep-deprived individuals.17 Here, we showed that persons who were resistant to acute sleep restriction were able to maintain alertness and that this was reflected by maintenance of their rested level of perfusion in their attentional areas. Overall, our findings strengthen the importance of the frontoparietal network in general behavioral alertness, even during a resting state, but, in addition, revealed a distinct difference between drowsy or nondrowsy persons after acute sleep restriction.
Could the decreased CBF in the Drowsy group after sleep loss be due to an increase in eye closures or even microsleeps? This is unlikely because there was no difference in the average number or total duration of eye closures between the rested and the sleep-restricted sessions in either the Drowsy or the Nondrowsy group.
A key finding of this study was a strong negative correlation between change in drowsiness and change in regional CBF after sleep restriction in the basal forebrain-cingulate gyrus network. The basal forebrain-cingulate gyrus network forms a critical part of the arousal-promoting network, in which cholinergic neurons in the basal forebrain project to much of the remaining cerebral cortex.62 The cholinergic drive is important for maintenance of wakefulness62 and alertness,58 with reduced cholinergic activity resulting in sleepiness.63 Therefore, the decreased activity in this system with increasing levels of drowsiness is consistent with its important role in maintaining wakefulness and alertness. The putamen and striatum, where negative correlations between CBF and drowsiness were also found, play an important role in a variety of higher-level cognitive processes generally associated with vigilance and state of wakefulness.56 Although the exact neuronal pathway for basal ganglia-driven wake-sleep control is still unclear, the high prevalence of daytime sleepiness in patients with basal ganglia-related neurodegenerative disorders, such as Parkinson disease,64 suggests its role via dopaminergic modulation of sleep.65 Furthermore, the ventral striatum of the basal ganglia extends into, and may represent elements of, the basal forebrain itself, modulating arousal via cholinergic pathways.65
When CBF in arousal-promoting network regions was compared between sleep-restricted and rested sessions, we found that CBF was modulated quite differently in the Drowsy and Nondrowsy groups after sleep restriction. Specifically, basal forebrain CBF increased in the Nondrowsy group. CBF also increased in the anterior cingulate and posterior cingulate in the Nondrowsy group, but showed no change in the Drowsy group. Several studies have reported that the brain is able to compensate for the effects of sleep loss while maintaining some level of alertness.39,66,67 However, these compensatory neuronal responses were observed in the prefrontal and parietal cortices and were modulated by task complexity, with stronger responses observed in more complex tasks.40,68 During a simple visual task after sleep loss, increasing transmission in the cholinergic afferents from the basal forebrain can promote wakefulness and increase attention.51 Therefore, it is likely that the increased CBF in the arousal-promoting cholinergic projection of the nondrowsy individuals represents the compensatory effort required to offset the homeostatic drive to sleep when there is no interference from task demands. In contrast, decreased activity in this area leads to widespread decreased activity in other areas, causing reduced alertness and transition into drowsy behavior.69
The thalamus is one of the key arousal-related regions and, hence, a change in CBF after sleep restriction may have been expected. For example, PET studies have reported decreases in thalamic activity after severe sleep deprivation of 24 h or longer,34–36 whereas fMRI studies have found thalamic activity to be dependent on cognitive load and behavioral state.38,40,70,71 In particular, the thalamus is involved in mediating the interaction of attention and arousal during cognitively demanding tasks, with a greater level of attention-related activity in the thalamus after sleep deprivation.40,70 However, in the current study, no change in thalamic CBF was seen in either the Drowsy or the Nondrowsy group after sleep restriction. We consider that this preserved thalamic activity likely reflects a similar basal demand for thalamic drive during the awake resting state (i.e., no active task), irrespective of whether an individual is rested or sleep-restricted.
A possible limitation of our study is that we did not have an objective measure of drowsiness, such as might be obtained from a cognitive task. Cognitive performance data may have been useful for grouping of individuals according to their level of cognitive impairment.38 However, a cognitive task could have introduced task-related changes in CBF,17 potentially masking the effect of drowsiness or actually altering the level of drowsiness. Furthermore, task difficulty/monotony has an effect on drowsiness, confounding changes in resting CBF due to sleep loss. Another limitation is the relatively small number of individuals in our study, especially after separating into 2 groups. However, within-group comparisons performed in the study seemed statistically sensitive. Notwithstanding, a larger sample size would have likely revealed more differences between the Drowsy and Nondrowsy groups. In particular, a larger sample size would have allowed for a powerful comparison of baseline perfusion difference between alert individuals and those who are drowsy even when rested. Such a comparison is important to elucidate mechanisms underlying daytime drowsiness despite a rested night. A further limitation is that although we used a detailed diary to subjectively verify that the participants did not consume any prohibited substance on the day of scanning, we did not use objective methods to confirm this. However, if individuals had consumed caffeine, for instance, but did not report such in the diary, this could have affected perfusion changes. However, consumption of caffeine, paradoxically, reduces CBF.72 If Nondrowsy individuals were not drowsy after sleep loss because of caffeine, we would expect to have seen a reduction in CBF, which was not observed.
Most fMRI studies of cognition have used BOLD imaging, which is a relative measure of neural activity and is dependent on cerebral perfusion and hemodynamic factors. Therefore, any changes in perfusion due to drowsiness will have an effect on the BOLD signal. As most studies measure BOLD activity during task relative to eyes-open resting state, any change in drowsiness during the resting baseline can alter the amplitude of the task-related BOLD signal even if there is no change in task-related neural activity. Therefore, careful consideration must be given to the overall behavioral state when measuring task-related BOLD activity following sleep loss.
Our study has provided a new insight into the cerebral correlates of drowsy behavior after acute sleep restriction. Differential patterns of cerebral perfusion were found in the frontoparietal attentional regions between individuals who were drowsy and not nondrowsy individuals after sleep restriction. We also found that the level of CBF in the basal-forebrain-cingulate network correlates well with behavioral alertness after sleep restriction, with increased CBF facilitating resistant behavior and decreased CBF leading to drowsiness.
DISCLOSURE STATEMENT
This was not an industry supported study. The authors have indicated no financial conflicts of interest.
ACKNOWLEDGMENTS
This work was funded by grants from the Royal Society of New Zealand Marsden Fund, Canterbury Medical Research Foundation, Lottery Health Research, and Accident Compensation Corporation, New Zealand.
ABBREVIATIONS
- ASL
arterial spin labeling
- CBF
cerebral blood flow
- ESS
Epworth Sleepiness Scale
- fMRI
functional magnetic resonance imaging
- FWE
family-wise error
- KSS
Karolinska Sleepiness Scale
- MNI
Montreal Neurological Institute
- PET
positron emission tomography
- SSS
Stanford Sleepiness Scale
Footnotes
A commentary on this article appears in this issue on page 1027.
REFERENCES
- 1.Doran S, Van Dongen H, Dinges D. Sustained attention performance during sleep deprivation: evidence of state instability. Arch Ital Biol. 2001;139:253–67. [PubMed] [Google Scholar]
- 2.Dinges DF, Kribbs NB. Performing while sleepy: effects of experimentally-induced sleepiness. In: Monk TH, editor. Sleep, sleepiness, and performance. Oxford, England: John Wiley and Sons; 1991. pp. 97–128. [Google Scholar]
- 3.Chee M, Tan J, Zheng H, et al. Lapsing during sleep deprivation is associated with distributed changes in brain activation. J Neurosci. 2008;28:5519–28. doi: 10.1523/JNEUROSCI.0733-08.2008. [DOI] [PMC free article] [PubMed] [Google Scholar]
- 4.Dinges DF, Grace R. PERCLOS: A valid psychophysiological measure of alertness as assessed by psychomotor vigilance. US Dept. Transportation, Federal Highway Admin., Washington, DC, Tech. Rep. Publication No. FHWA-MCRT-98-006 1998. [Google Scholar]
- 5.Wierwille WW, Ellsworth LA. Evaluation of driver drowsiness by trained raters. Accid Anal Prev. 1994;26:571–81. doi: 10.1016/0001-4575(94)90019-1. [DOI] [PubMed] [Google Scholar]
- 6.Peiris MTR, Jones RD, Davidson PR, Carroll GJ, Bones PJ. Frequent lapses of responsiveness during an extended visuomotor tracking task in non-sleep-deprived subjects. J Sleep Res. 2006;15:291–300. doi: 10.1111/j.1365-2869.2006.00545.x. [DOI] [PubMed] [Google Scholar]
- 7.Dinges DF, Pack F, Williams K, et al. Cumulative sleepiness, mood disturbance, and psychomotor vigilance performance decrements during a week of sleep restricted to 4-5 hours per night. Sleep. 1997;20:267–77. [PubMed] [Google Scholar]
- 8.Van Dongen H, Maislin G, Mullington J, Dinges D. The cumulative cost of additional wakefulness: dose-response effects on neurobehavioral functions and sleep physiology from chronic sleep restriction and total sleep deprivation. Sleep. 2003;26:117–26. doi: 10.1093/sleep/26.2.117. [DOI] [PubMed] [Google Scholar]
- 9.Russo M, Thomas M, Thorne D, et al. Oculomotor impairment during chronic partial sleep deprivation. Clin Neurophysiol. 2003;114:723–36. doi: 10.1016/s1388-2457(03)00008-7. [DOI] [PubMed] [Google Scholar]
- 10.Horne JA, Reyner LA, Barrett PR. Driving impairment due to sleepiness is exacerbated by low alcohol intake. Occup Environ Med. 2003;60:689–92. doi: 10.1136/oem.60.9.689. [DOI] [PMC free article] [PubMed] [Google Scholar]
- 11.Devoto A, Lucidi F, Violani C, Bertini M. Effects of different sleep reductions on daytime sleepiness. Sleep. 1999;22:336–43. doi: 10.1093/sleep/22.3.336. [DOI] [PubMed] [Google Scholar]
- 12.Stutts JC, Wilkins JW, Scott Osberg J, Vaughn BV. Driver risk factors for sleep-related crashes. Accid Anal Prev. 2003;35:321–31. doi: 10.1016/s0001-4575(02)00007-6. [DOI] [PubMed] [Google Scholar]
- 13.Åkerstedt T, Peters B, Anund A, Kecklund G. Impaired alertness and performance driving home from the night shift: a driving simulator study. J Sleep Res. 2005;14:17–20. doi: 10.1111/j.1365-2869.2004.00437.x. [DOI] [PubMed] [Google Scholar]
- 14.Lucidi F, Russo PM, Mallia L, Devoto A, Lauriola M, Violani C. Sleep-related car crashes: risk perception and decision-making processes in young drivers. Accid Anal Prev. 2006;38:302–9. doi: 10.1016/j.aap.2005.09.013. [DOI] [PubMed] [Google Scholar]
- 15.Sagberg F. Road accidents caused by drivers falling asleep. Accid Anal Prev. 1999;31:639–49. doi: 10.1016/s0001-4575(99)00023-8. [DOI] [PubMed] [Google Scholar]
- 16.Huang R, Jung T, Delorme A, Makeig S. Tonic and phasic electroencephalographic dynamics during continuous compensatory tracking. NeuroImage. 2008;39:1896–1909. doi: 10.1016/j.neuroimage.2007.10.036. [DOI] [PubMed] [Google Scholar]
- 17.Lim J, Wu WC, Wang J, Detre JA, Dinges DF, Rao H. Imaging brain fatigue from sustained mental workload: an ASL perfusion study of the time-on-task effect. NeuroImage. 2010;49:3426–35. doi: 10.1016/j.neuroimage.2009.11.020. [DOI] [PMC free article] [PubMed] [Google Scholar]
- 18.Hoddes E, Dement W, Zarcone V. The development and use of the Stanford sleepiness scale. Psychophysiology. 1972;9:150. [Google Scholar]
- 19.Johns MW. A new method for measuring daytime sleepiness: the Epworth sleepiness scale. Sleep. 1991;14:540–5. doi: 10.1093/sleep/14.6.540. [DOI] [PubMed] [Google Scholar]
- 20.Kaida K, Takahashi M, Akerstedt T, et al. Validation of the Karolinska sleepiness scale against performance and EEG variables. Clin Neurophysiol. 2006;117:1574–81. doi: 10.1016/j.clinph.2006.03.011. [DOI] [PubMed] [Google Scholar]
- 21.Vöhringer-Kuhnt T, Baumgarten T, Karrer K, Briest S. Wierwille's method of driver drowsiness evaluation revisited. Conf Proc Int Conf Traffic Transp Psych. 2004;3:5–9. [Google Scholar]
- 22.Anderson C, Wales AW, Horne JA. PVT lapses differ according to eyes open, closed, or looking away. Sleep. 2010;33:197–204. doi: 10.1093/sleep/33.2.197. [DOI] [PMC free article] [PubMed] [Google Scholar]
- 23.Van Orden K, Jung T, Makeig S. Combined eye activity measures accurately estimate changes in sustained visual task performance. Biol Psychol. 2000;52:221–40. doi: 10.1016/s0301-0511(99)00043-5. [DOI] [PubMed] [Google Scholar]
- 24.Poudel GR, Jones RD, Innes CR, Watts R, Signal T, Bones PJ. fMRI correlates of behavioural microsleeps during a continuous visuomotor task. Conf Proc IEEE Eng Med Biol Soc. 2009;31:2919–22. doi: 10.1109/IEMBS.2009.5334486. [DOI] [PubMed] [Google Scholar]
- 25.Torsvall L, Åkerstedt T. Eye closure, sleepiness and EEG spectra. In: Koella WP, Riither E, editors. Sleep. Stuttgart: Gustav Fischer Verlag; 1984. pp. 300–1. [Google Scholar]
- 26.Cluydts R, De Valck E, Verstraeten E, Theys P. Daytime sleepiness and its evaluation. Sleep Med Rev. 2002;6:83–96. doi: 10.1053/smrv.2002.0191. [DOI] [PubMed] [Google Scholar]
- 27.Van Dongen HP, Baynard MD, Maislin G, Dinges DF. Systematic interindividual differences in neurobehavioral impairment from sleep loss: evidence of trait-like differential vulnerability. Sleep. 2004;27:423–33. [PubMed] [Google Scholar]
- 28.Leproult R, Colecchia EF, Berardi AM, Stickgold R, Kosslyn SM, Van Cauter E. Individual differences in subjective and objective alertness during sleep deprivation are stable and unrelated. Am J Physiol. 2003;284:280–90. doi: 10.1152/ajpregu.00197.2002. [DOI] [PubMed] [Google Scholar]
- 29.Banks S, Dinges DF. Behavioral and physiological consequences of sleep restriction. J Clin Sleep Med. 2007;3:519–28. [PMC free article] [PubMed] [Google Scholar]
- 30.Turner TH, Drummond SP, Salamat JS, Brown GG. Effects of 42 hr of total sleep deprivation on component processes of verbal working memory. Neuropsychology. 2007;21:787–95. doi: 10.1037/0894-4105.21.6.787. [DOI] [PubMed] [Google Scholar]
- 31.Frey DJ, Badia P, Wright KP., Jr. Inter- and intra-individual variability in performance near the circadian nadir during sleep deprivation. J Sleep Res. 2004;13:305–15. doi: 10.1111/j.1365-2869.2004.00429.x. [DOI] [PubMed] [Google Scholar]
- 32.Van Dongen HP, Maislin G, Dinges DF. Dealing with inter-individual differences in the temporal dynamics of fatigue and performance: importance and techniques. Aviat Space Environ Med. 2004;75(3 Suppl):147–54. [PubMed] [Google Scholar]
- 33.Lim J, Dinges DF. A meta-analysis of the impact of short-term sleep deprivation on cognitive variables. Psychol Bull. 2010;136:375–89. doi: 10.1037/a0018883. [DOI] [PMC free article] [PubMed] [Google Scholar]
- 34.Wu JC, Gillin JC, Buchsbaum MS, et al. The effect of sleep deprivation on cerebral glucose metabolic rate in normal humans assessed with positron emission tomography. Sleep. 1991;14:155–62. [PubMed] [Google Scholar]
- 35.Thomas M, Sing H, Belenky G, et al. Neural basis of alertness and cognitive performance impairments during sleepiness. I. Effects of 24 h of sleep deprivation on waking human regional brain activity. J Sleep Res. 2000;9:335–52. doi: 10.1046/j.1365-2869.2000.00225.x. [DOI] [PubMed] [Google Scholar]
- 36.Wu JC, Gillin JC, Buchsbaum MS, et al. Frontal lobe metabolic decreases with sleep deprivation not totally reversed by recovery sleep. Neuropsychopharmacology. 2006;31:2783–92. doi: 10.1038/sj.npp.1301166. [DOI] [PubMed] [Google Scholar]
- 37.Chee MW, Choo WC. Functional imaging of working memory after 24 hr of total sleep deprivation. J Neurosci. 2004;24:4560–7. doi: 10.1523/JNEUROSCI.0007-04.2004. [DOI] [PMC free article] [PubMed] [Google Scholar]
- 38.Chee MW, Tan JC. Lapsing when sleep deprived: neural activation characteristics of resistant and vulnerable individuals. NeuroImage. 2010;51:835–43. doi: 10.1016/j.neuroimage.2010.02.031. [DOI] [PubMed] [Google Scholar]
- 39.Mu Q, Mishory A, Johnson KA, et al. Decreased brain activation during a working memory task at rested baseline is associated with vulnerability to sleep deprivation. Sleep. 2005;28:433–46. doi: 10.1093/sleep/28.4.433. [DOI] [PubMed] [Google Scholar]
- 40.Tomasi D, Wang RL, Telang F, et al. Impairment of attentional networks after 1 night of sleep deprivation. Cereb Cortex. 2008;19:223–40. doi: 10.1093/cercor/bhn073. [DOI] [PMC free article] [PubMed] [Google Scholar]
- 41.Asllani I, Habeck C, Borogovac A, et al. Effects of 48hr sleep deprivation on CBF measured with ASL MRI. Proc ISMRM. 2007;15:507. [Google Scholar]
- 42.Rao H, Lim J, Detre JA, Wu W, Dinges DF. Effects of 24hr of total sleep deprivation on resting CBF differs in high-vulnerable and low-vulberable adults. Proc Int Soc Magn.Reson Med Sci Meet. 2009;17:3630. [Google Scholar]
- 43.Akerstedt T, Gillberg M. Subjective and objective sleepiness in the active individual. Int J Neurosci. 1990;52:29–37. doi: 10.3109/00207459008994241. [DOI] [PubMed] [Google Scholar]
- 44.Dai W, Garcia D, de Bazelaire C, Alsop DC. Continuous flow-driven inversion for arterial spin labeling using pulsed radio frequency and gradient fields. Magn Reson Med. 2008;60:1488–97. doi: 10.1002/mrm.21790. [DOI] [PMC free article] [PubMed] [Google Scholar]
- 45.Bernstein MA, King KF, Zhou ZJ. Burlington, MA: Elsevier Academic Press; 2004. Advanced pulse sequence techniques. Handbook of MRI pulse sequences; pp. 802–27. [Google Scholar]
- 46.Alsop DC, Detre JA. Reduced transit-time sensitivity in noninvasive magnetic resonance imaging of human cerebral blood flow. J Cereb Blood Flow Metab. 1996;16:1236–49. doi: 10.1097/00004647-199611000-00019. [DOI] [PubMed] [Google Scholar]
- 47.Herscovitch P, Raichle ME. What is the correct value for the brain-blood partition coefficient for water? J Cereb Blood Flow Metab. 1985;5:65–9. doi: 10.1038/jcbfm.1985.9. [DOI] [PubMed] [Google Scholar]
- 48.Jenkinson M, Bannister P, Brady M, Smith S. Improved optimization for the robust and accurate linear registration and motion correction of brain images. NeuroImage. 2002;17:825–41. doi: 10.1016/s1053-8119(02)91132-8. [DOI] [PubMed] [Google Scholar]
- 49.Malla AM, Davidson PR, Bones PJ, Green R, Jones RD. Automated video-based measurement of eye closure for detecting behavioral microsleep. Conf Proc IEEE Eng Med Biol Soc. 2010;32:6741–4. doi: 10.1109/IEMBS.2010.5626013. [DOI] [PubMed] [Google Scholar]
- 50.Mai JK, Assheuer J, Paxinos G. 2nd ed. San Diego, California: Elsevier Academic Press; 2004. Atlas of the Human Brain. [Google Scholar]
- 51.Chuah LY, Chee MW. Cholinergic augmentation modulates visual task performance in sleep-deprived young adults. J Neurosci. 2008;28:11369–77. doi: 10.1523/JNEUROSCI.4045-08.2008. [DOI] [PMC free article] [PubMed] [Google Scholar]
- 52.Genovese CR, Lazar NA, Nichols T. Thresholding of statistical maps in functional neuroimaging using the false discovery rate. NeuroImage. 2002;15:870–8. doi: 10.1006/nimg.2001.1037. [DOI] [PubMed] [Google Scholar]
- 53.Barbato G, Ficca G, Beatrice M, Casiello M, Muscettola G, Rinaldi F. Effects of sleep deprivation on spontaneous eye blink rate and alpha EEG power. Biol Psychiatry. 1995;38:340–1. doi: 10.1016/0006-3223(95)00098-2. [DOI] [PubMed] [Google Scholar]
- 54.Tucker A, Johns M. The duration of eyelid movements during blinks: changes with drowsiness. Sleep. 2005;28:A122. [Google Scholar]
- 55.Thomas ML, Sing HC, Belenky G, et al. Neural basis of alertness and cognitive performance impairments during sleepiness: II. effects of 48 and 72 h of sleep deprivation on waking human regional brain activity. Thalamus Relat Syst. 2003;2:199–229. doi: 10.1046/j.1365-2869.2000.00225.x. [DOI] [PubMed] [Google Scholar]
- 56.Drummond SPA, Grethe AB, Dinges D, Ayalon L, Mednick SC, Meloy MJ. The neural basis of the psychomotor vigilance task. Sleep. 2005;28:1059–68. [PubMed] [Google Scholar]
- 57.Drummond SP, Brown GG, Stricker JL, Buxton RB, Wong EC, Gillin JC. Sleep deprivation-induced reduction in cortical functional response to serial subtraction. NeuroReport. 1999;10:3745–8. doi: 10.1097/00001756-199912160-00004. [DOI] [PubMed] [Google Scholar]
- 58.Coull JT. Neural correlates of attention and arousal: insights from electrophysiology, functional neuroimaging and psychopharmacology. Prog Neurobiol. 1998;55:343–61. doi: 10.1016/s0301-0082(98)00011-2. [DOI] [PubMed] [Google Scholar]
- 59.Lim J, Dinges DF. Sleep deprivation and vigilant attention. Ann NY Acad Sci. 2008;10:305–22. doi: 10.1196/annals.1417.002. [DOI] [PubMed] [Google Scholar]
- 60.Grosbras MH, Lobel E, Van de Moortele PF, LeBihan D, Berthoz A. An anatomical landmark for the supplementary eye fields in human revealed with functional magnetic resonance imaging. Cereb Cortex. 1999;9:705–11. doi: 10.1093/cercor/9.7.705. [DOI] [PubMed] [Google Scholar]
- 61.Durmer JS, Dinges DF. Neurocognitive consequences of sleep deprivation. Semin Neurol. 2005;25:117–29. doi: 10.1055/s-2005-867080. [DOI] [PubMed] [Google Scholar]
- 62.Saper CB, Scammell TE, Lu J. Hypothalamic regulation of sleep and circadian rhythms. Nature. 2005;437:1257–63. doi: 10.1038/nature04284. [DOI] [PubMed] [Google Scholar]
- 63.Jones BE. Modulation of cortical activation and behavioral arousal by cholinergic and orexinergic systems. Ann N Y Acad Sci. 2008;1129:26–34. doi: 10.1196/annals.1417.026. [DOI] [PubMed] [Google Scholar]
- 64.Hobson DE, Lang AE, Martin WR, Razmy A, Rivest J, Fleming J. Excessive daytime sleepiness and sudden-onset sleep in Parkinson disease: a survey by the Canadian Movement Disorders Group. JAMA. 2002;287:455–63. doi: 10.1001/jama.287.4.455. [DOI] [PubMed] [Google Scholar]
- 65.Vetrivelan R, Qiu MH, Chang C, Lu J. Role of basal ganglia in sleep-wake regulation: neural circuitry and clinical significance. Front Neuroanat. 2010;4:145. doi: 10.3389/fnana.2010.00145. [DOI] [PMC free article] [PubMed] [Google Scholar]
- 66.Drummond SP, Brown GG, Gillin JC, Stricker JL, Wong EC, Buxton RB. Altered brain response to verbal learning following sleep deprivation. Nature. 2000;403:655–7. doi: 10.1038/35001068. [DOI] [PubMed] [Google Scholar]
- 67.Drummond SPA, Meloy MJ, Yanagi MA, Orff HJ, Brown GG. Compensatory recruitment after sleep deprivation and the relationship with performance. Psychiatry Res. 2005;140:211–23. doi: 10.1016/j.pscychresns.2005.06.007. [DOI] [PubMed] [Google Scholar]
- 68.Chee MW, Chuah LY, Venkatraman V, Chan WY, Philip P, Dinges DF. Functional imaging of working memory following normal sleep and after 24 and 35 h of sleep deprivation: correlations of fronto-parietal activation with performance. NeuroImage. 2006;31:419–28. doi: 10.1016/j.neuroimage.2005.12.001. [DOI] [PubMed] [Google Scholar]
- 69.Merica H, Fortune RD. State transitions between wake and sleep, and within the ultradian cycle, with focus on the link to neuronal activity. Sleep Med Rev. 2004;8:473–85. doi: 10.1016/j.smrv.2004.06.006. [DOI] [PubMed] [Google Scholar]
- 70.Portas C, Rees G, Howseman A, Josephs O, Turner R, Frith C. A specific role for the thalamus in mediating the interaction of attention and arousal in humans. J Neurosci. 1998;18:8979–89. doi: 10.1523/JNEUROSCI.18-21-08979.1998. [DOI] [PMC free article] [PubMed] [Google Scholar]
- 71.Chuah Y, Venkatraman V, Dinges D, Chee M. The neural basis of interindividual variability in inhibitory efficiency after sleep deprivation. J Neurosci. 2006;26:7156. doi: 10.1523/JNEUROSCI.0906-06.2006. [DOI] [PMC free article] [PubMed] [Google Scholar]
- 72.Cameron O, Modell J, Hariharan M. Caffeine and human cerebral blood flow: a positron emission tomography study. Life Science. 1990;47:1141–6. doi: 10.1016/0024-3205(90)90174-p. [DOI] [PubMed] [Google Scholar]