Abstract
Objective:
To determine the extent to which individual differences in vulnerability to total sleep deprivation also reflect individual differences in vulnerability to multiple nights of sleep restriction.
Design:
Two sleep loss conditions (order counterbalanced) separated by 2 to 4 weeks: (a) total sleep deprivation (TSD) of 2 nights (63 h continuous wakefulness); (b) sleep restriction (SR) of 7 nights of 3 h nightly time in bed (TIB). Both conditions were preceded by 7 in-laboratory nights with 10 h nightly TIB; and followed by 3 recovery nights with 8 h nightly TIB. Measures of cognitive performance (psychomotor vigilance, working memory [1-Back], and mathematical processing), objective alertness, subjective sleepiness, and mood were obtained at regular intervals under both conditions. Intra-class correlation coefficients (ICC) were computed using outcome metrics averaged over the last day (08:00-20:00) of TSD and SR.
Setting:
Residential sleep/performance testing facility.
Participants:
Nineteen healthy adults (ages 18-39; 11 males, 8 females).
Interventions:
2 nights of TSD and 7 nights SR (3 h nightly TIB).
Results:
Volunteers who displayed greater vulnerability to TSD displayed greater vulnerability to SR on cognitive performance tasks (ICC: PVT lapses = 0.89; PVT speed = 0.86; 1-Back = 0.88; mathematical processing = 0.68, Ps < 0.05). In addition, trait-like responsivity to TSD/SR was found for mood variables vigor (ICC = 0.91), fatigue (ICC = 0.73), and happiness (ICC = 0.85) (all Ps < 0.05).
Conclusion:
Resilience to sleep loss is a trait-like characteristic that reflects an individual's ability to maintain performance during both types of sleep loss (SR and TSD). Whether the findings extend to sleep schedules other than those investigated here (63 h of TSD and 7 nights of 3 h nightly TIB) will be the focus of future studies.
Citation:
Rupp TL; Wesensten NJ; Balkin TJ. Trait-like vulnerability to total and partial sleep loss. SLEEP 2012;35(8):1163-1172.
Keywords: Sleep deprivation, sleep restriction, partial sleep deprivation, individual differences, cognitive performance, mood
INTRODUCTION
Studies of normal human subjects undergoing either acute, total sleep loss or multiple nights of sleep restriction consistently reveal robust and reliable neurobehavioral performance decrements,1,2 reduced sleep onset latencies, and increased subjective sleepiness.2,3 Historically, statistical analyses have been performed on group-averaged data from these studies—a practice that has, over the years, sensitively illuminated many effects of sleep loss but has generally obscured individual differences (ID)—essentially treating ID as error variance. However, widespread interest in ID in vulnerability to sleep loss was sparked in 2004 by Van Dongen et al.,4 who used mixed-model linear regression techniques to demonstrate that such differences are trait-like—i.e., the extent to which an individual exhibits vulnerability/resilience during one exposure to total sleep deprivation is a good predictor of the vulnerability/resilience that he/she will exhibit during his/her next exposure. In this study by Van Dongen et al., repeated exposure to total sleep deprivation was performed following either 6 or 12 hours of sleep each night for the preceding week. Results of the study demonstrated that responses to total sleep deprivation showed large inter-individual variability that was replicable and robust to manipulations of prior sleep history.4
It has also become increasingly apparent that the physiological responses to acute total sleep deprivation and chronic sleep restriction differ. There is a growing body of evidence that prolonged or chronic sleep restriction induces long-term neuromodulatory changes in brain physiology—changes that are not induced by shorter periods of acute total sleep deprivation.2,5,6 These long-term changes are hypothesized to be a function of the ratio of extracellular adenosine (a homeostatic sleep factor mediating the sleep-inducing effects of prolonged wakefulness) to the density of adenosine receptors in the basal forebrain.7 Given that the response to chronic sleep loss is different than the response to acute TSD, the extent to which an individual's trait-like resilience to the effects of TSD also reflects trait-like resilience to the effects of SR—i.e., whether findings from one type of sleep loss reflect/predict findings from the other type of sleep loss—is currently unknown.
Accordingly, the purpose of the present study was to determine the extent to which individuals' sensitivity/resilience to sleep loss remains consistent across sleep loss paradigms (TSD and SR). Specifically, based on the results of Van Dongen et al.,4 it was predicted that individuals who exhibit relatively good daytime performance and alertness during acute total sleep deprivation will similarly exhibit relatively good daytime performance and alertness across multiple nights of sleep restriction. In the context of the present study, vulnerability or resilience of an individual is relative based on an individual's performance in comparison to other individuals undergoing the same manipulation. Because SR is experienced by the general population much more frequently than TSD (e.g., as a result of shiftwork, early school start times, caregiving of infants or family members with Alzheimer disease), the potential real-world applicability of the findings of Van Dongen et al. depends upon the extent to which their TSD-based findings generalize to SR conditions.
METHODS
This study was approved by the Walter Reed Army Institute of Research Human Use Review Committee and the United States Army Medical Research and Materiel Command Human Subjects Research Review Board and was performed in accordance with the ethical standards of the 1964 Declaration of Helsinki.
Volunteers
Men and women 18 to 39 years of age were recruited via flyers posted at local colleges, universities, and military installations. After providing informed consent, volunteers completed questionnaires to determine eligibility based on physical and psychological health, and sleep habits. The Horne-Ostberg morningness-eveningness questionnaire8 was administered to assess chronotype though these scores were not used to determine inclusion/exclusion. Volunteers then underwent a physical examination, and evaluation of blood and urine samples was conducted to determine general health status (including pregnancy and drug use status). In order to reduce error variance associated with inter-subject differences in nighttime sleep, volunteers were excluded if they reported any of the following for the preceding month: (1) habitual nightly sleep amounts outside the range of 6-8 h, (2) average morning wake-up times later than 08:00 Monday through Friday and 09:00 Saturday and Sunday, or (3) time zone travel across ≥ 3 time zones. Additional study exclusionary criteria included: cardiovascular disease; hypertension; past or present neurologic, psychiatric, or sleep disorder; present or past use of over-the-counter substances with purported psychoactive properties; asthma or other reactive airways diseases; prior history of cancer; allergies; regular nicotine use within the last 3 years; current heavy alcohol use (> 14 drinks per week); current use of other illicit drugs (including but not limited to benzodiazepines, amphetamines, cocaine, and marijuana); medication use during in-laboratory challenge phases (including use of vitamins or supplements; not including oral contraceptives); liver disease or liver abnormalities; self-reported history of caffeine use > 400 mg (8 caffeinated sodas or 3-4 cups of coffee) per day on average; score ≥ 13 on the Beck Depression Inventory9; and pregnancy.
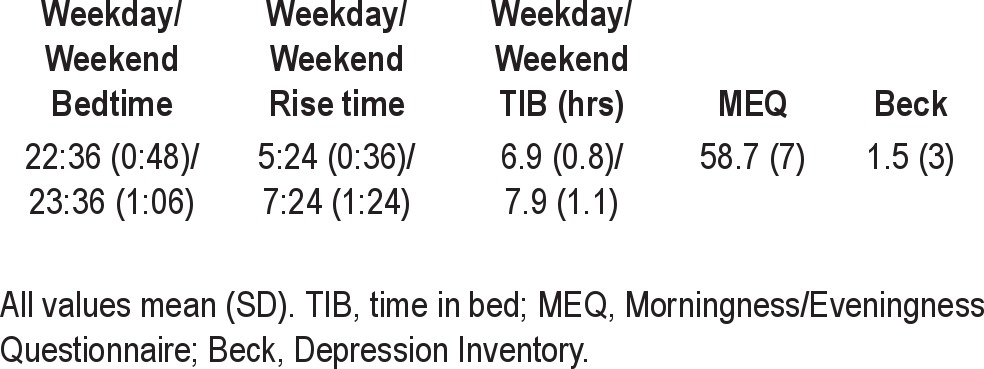
A total of 20 volunteers completed the study; however, one volunteer tested positive for amphetamines during the study and was not included in the analyses; final study N was 19 volunteers (11 males and 8 females, mean age [SD] = 28.4 [4.6]). Mean (SD) values for screening criteria are summarized in Table 1. The number of volunteers initially selected was based on the Van Dongen et al. study, in which an N = 20 was sufficient for revealing robust inter-individual differences using neurobehavioral, alertness, and mood measures similar to those used in the present study.4
Table 1.
Demographics/screening information
Testing Facilities
During testing and sleep periods, each subject was housed individually in a sound attenuated 8′ × 10′ room that included a bed and computer workstation. Ambient temperature was approximately 23°C, and lighting was approximately 500 lux (lights were turned off during sleep periods). Background white noise was approximately 65 dB during sleeping and testing periods. When not engaged in testing or sleep, volunteers remained in a common living area to play board or video games, eat, read, or watch television and movies. Volunteers were monitored continuously by laboratory technicians and instructed to not discuss study procedures, symptoms, etc. No formal restrictions were placed on food and water intake, and no drugs (except for oral contraceptives), vitamins, or dietary supplements were allowed during the study. Volunteers participated in groups of 2-4. Nicotine use was prohibited prior to and during all study phases (confirmed by urine drug screening), and caffeine use was prohibited beginning 48 h prior to beginning the full-time in-laboratory phase (confirmed with daily log). During any time spent in the laboratory, volunteers were not allowed phone calls internet use, visitors, etc.
Procedure
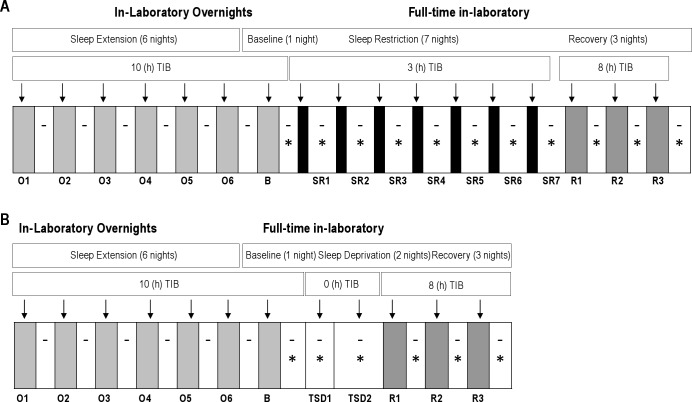
Figure 1 illustrates the study design consisting of 2 counterbalanced within-subjects' phases: (A) sleep restriction (SR), consisting of 7 nights of sleep restricted to 3 h nightly time in bed (TIB); (B) total sleep deprivation (TSD), consisting of approximately 63 h of continuous wakefulness. Time between phases was 2-4 weeks.
Figure 1.
Study design, showing nightly time in bed for (A) Sleep Restriction, including Overnight and Full-time In-laboratory nights [Baseline, Sleep Restriction, Recovery] and (B) Total Sleep Deprivation, including Overnight and Full-time In-laboratory nights (Baseline, Total Sleep Deprivation, Recovery). Dashes indicate actigraphy recording and asterisks indicate waking neurobehavioral and alertness testing (psychomotor vigilance testing, automated neurological assessment metric, mood, Stanford Sleepiness Scale, and maintenance of wakefulness test). SR and TSD phases were administered in counterbalanced order. Shaded regions indicate sleep and white regions indicate wake. O, Overnight; B, Baseline; SR, Sleep Restriction; TSD, Total Sleep Deprivation; R, Recovery.
Three hours was selected as the time in bed per night for the sleep restriction condition to maintain consistency with our previous studies.2,5 The rationale for comparing 7 days of 3 h TIB with 2 days TSD was based on examination of PVT lapse data from Van Dongen et al.,4 from which we made the inference that 7 nights of 3 h of sleep per night would be roughly equivalent with regard to PVT performance as 2 nights of total sleep deprivation.
Both the TSD and SR phases were preceded by a sleep satiation phase, consisting of 7 nights in the laboratory with 10 h nightly TIB (21:00 to 07:00) during which sleep was actigraphically recorded to provide an estimate of total sleep time. Volunteers left the laboratory during the day and maintained their usual daytime activities; napping was prohibited. The goal of this phase was to minimize variability during the TSD and SR phases due to inter-individual differences in immediate prior sleep history.
Upon arrival for the 7th sleep satiation night (which also served as the Baseline night preceding TSD or SR), volunteers were briefed on study procedures, vital signs were measured, and a urine sample was collected for drug analyses and pregnancy status in women. Blood was drawn for genotyping (results not reported here). Polysomnographic (PSG) recording electrodes were applied (electrooculogram [EOG], electromyogram [EMG], O1, O2, C3, and C4 electroencephalogram [EEG] sites with contralateral mastoid leads serving as references for EEG and EOG), and volunteers continued to wear wrist actigraphs. Volunteers were given instructions and practice on performance and alertness tasks (described below). Lights out was 21:00.
Upon awakening at 07:00 the next morning, vital signs were measured and volunteers were allowed to eat a meal. Beginning at 08:00, tests were administered every hour and vital signs recorded periodically during waking. The latter served as baseline measures. Following the baseline day, volunteers began either the 2-night TSD (0 h nightly TIB) or 7-night SR (3 h nightly TIB, 04:00–07:00) phases with hourly testing throughout the waking period.
Following the last TSD testing session (20:00 on Day 2) or SR testing session (20:00 on Day 7), volunteers began a 3-day Recovery phase, in which nightly TIB was 23:00-07:00 (consistent with our previous studies2,5) followed by daytime testing from 08:00 through 20:00 (results not reported here). At the end of the third recovery day, electrodes and actigraphs were removed, vital signs were recorded, and a brief medical examination was performed. Volunteers were then debriefed and released.
MEASURES
Actigraphy
Wrist movements were recorded using the Motionlogger Watch (Ambulatory Monitoring, Inc., Ardsley, NY). Actigraph data were scored automatically for total sleep time ([TST] minutes of sleep within the identified sleep period) using the Cole-Kripke scoring algorithm (Action 4 software-Ambulatory Monitoring, Inc., Ardsley, NY).10
Psychomotor Vigilance Task (PVT)
A 10-min version of the psychomotor vigilance task (PVT)11 was administered using the PVT-192 (Ambulatory Monitoring Inc., Ardsley, NY), a small, hand-held device (see Lim and Dinges for a description of the task11). The PVT was analyzed for speed (1/reaction time*1000) and lapses (number of reaction times ≥ 500 msec).
Automated Neuropsychological Assessment Metric Tests12,13
The following tests were administered in the order listed below as part of the PC-based Automated Neuropsychological Assessment Metric (ANAM, version 4).14
Stanford Sleepiness Scale (SSS)15
Volunteers selected which of 7 statements best described their current state of alertness. Statements ranged from “1–feeling active and vital; alert; wide awake” to “7–almost in reverie; sleep onset soon; losing struggle to remain awake.” The dependent variable was self-rated sleepiness score.
Mood Scale (MS)
Seven dimensions of mood were assessed including vigor, restlessness, depression, anger, fatigue, anxiety, and happiness. Each dimension consisted of 6 adjectives for a total of 42 items. Each item was rated on a 6-point Likert scale of mood intensity. Mean ratings (which served as the dependent measures) were computed for each scale, with higher values reflecting greater degree of endorsement of each of the mood states.16
Mathematical Processing (MATH)
Arithmetic problems were presented in the middle of the screen. Each problem included 2 mathematical operations (addition and/or subtraction) and 3 single digit numbers (e.g., 5 + 3 - 4 = ?). The subject was instructed to read and calculate from left to right and indicate whether the answer was greater than or less than 5 by pressing 1 of 2 specified response buttons. The dependent variable was throughput (number of correct responses/min; higher scores reflect better performance).
Running Memory (1-Back)
Volunteers monitored a random sequence of numbers (0 through 9) presented one at a time in the center of the screen. Volunteers pressed a specified key if the number on the screen matched the number that immediately preceded it and a different specified key if the number did not match the immediately preceding number. The dependent variable was throughput (number of correct responses/min).
Maintenance of Wakefulness Test (MWT)
For the MWT, volunteers were escorted to their individual darkened, sound-attenuated bedrooms and allowed to recline on their beds. They were instructed to close their eyes and try to remain awake. Polysomnography (PSG – EEG, EOG, and EMG) was monitored online, and volunteers were awakened at the onset of stage 2 sleep. If volunteers did not fall asleep after 20 min, the test was terminated. Records were re-scored offline for latency to the first 30-sec epoch of stage 1 sleep, which served as the dependent measure. Tests on which volunteers did not fall asleep were assigned a value of 20 minutes.
ANALYSES
Overnight Actigraphy
Nighttime actigraphically recorded TST was analyzed using a mixed-model analysis of variance (ANOVA - SPSS Version 19.0 for PC, SPSS Inc., Chicago, IL) including fixed repeated-measures effects for Night (7 levels corresponding to the 7 nights of the sleep satiation phase) and sleep loss condition (TSD v. SR). Significant interactions were followed by post hoc t-tests (Bonferroni correction). Greenhouse-Geisser corrections were applied to repeated measures effects to correct for sphericity.17 Statistical significance was P < 0.05.
Trait-like Responsivity
To test for trait-like responsivity to TSD versus SR, we used the statistical techniques described by Van Dongen et al.4 For each outcome measure (e.g., PVT lapses, SSS), the following steps were performed: first, response to total sleep loss and sleep restriction was quantified by averaging the given outcome measure for a particular volunteer over the last 12 h of the TSD challenge (08:00–20:00) and over the last 12 h of the last day of the SR challenge (SR7; 08:00–20:00). Second, between-subjects variance σ2bs was separated from within-subjects variance σ2ws by conducting a variance components analysis (linear mixed-model analysis of variance with restricted maximum likelihood method, variance components covariance structure and degrees of freedom obtained by a Satterthwaite approximation); SPSS, Version 19.0 for PC, Chicago, IL, with fixed-effects order [TSD or SR first], condition [TSD or SR]), and their interaction. The fixed-effect of order was included to assess any effect of undergoing SR vs. TSD first; condition was included in the case that the effects of SR and TSD were not equipotent; and their interaction (order by condition) was included to assess how these factors may interact. Third, for each outcome measure, the intraclass correlation coefficient (ICC) was computed as the ratio of between-subjects variance to the sum of the between- and within-subjects variances. Next, statistical significance of the ICC values was assessed using a Wald Z test of between-subjects variance (statistically significant [P < 0.05] Z tests were taken as evidence of trait-like responses to TSD and SR). Stability of ICC values were interpreted using the following standard ranges18: “slight” (0.0–0.2); “fair” (0.2–0.4); “moderate” (0.4–0.6); “substantial” (0.6–0.8); and “almost perfect” (0.8–1.0). The magnitude of trait-like interindividual variability was computed by calculating the square root of the between-subjects variance σ2bs.
Secondary analyses were performed by adding baseline daytime functioning (average response, 08:00–20:00, Day 1) as a covariate to the linear mixed model analyses. Baseline daytime functioning was included in this model in the event that between-conditions variance might have otherwise inflated the within-subject variance. These post hoc analyses were performed to examine whether baseline individual differences may have impacted ICC values.
RESULTS
Extension Phase Overnight Actigraphy
Mean (SD) minutes of actigraphically recorded TST across pre-TSD and pre-SR sleep extension nights are presented in Table 2. Actigraphically recorded TST did not differ between TSD or SR conditions during the preceding week of overnight extended sleep (Sleep Loss Condition, F = 0.73, P = 0.396; Night, F = 1.74, P = 0.117; Condition × Night interaction, F = 0.99, P = 0.429).
Table 2.
Mean (SD) minutes of actigraphically estimated total sleep time (TST) for Total Sleep Deprivation (TSD) and Sleep Restriction (SR) across the 7 sleep extension nights (O1-O6 and B) prior to sleep loss

Trait-like Responsivity
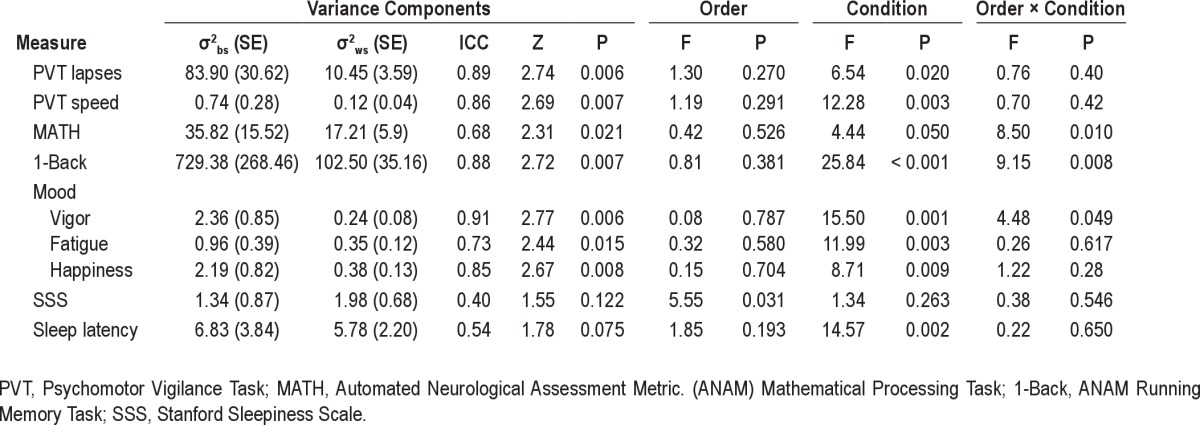
Results of variance components analyses (including ICC values and Wald Z tests) are listed in Table 3 for all variables.
Table 3.
Results of variance components analyses performed to assess trait-like inter-individual variability in impairment resulting from TSD and SR
Psychomotor Vigilance Task (PVT)
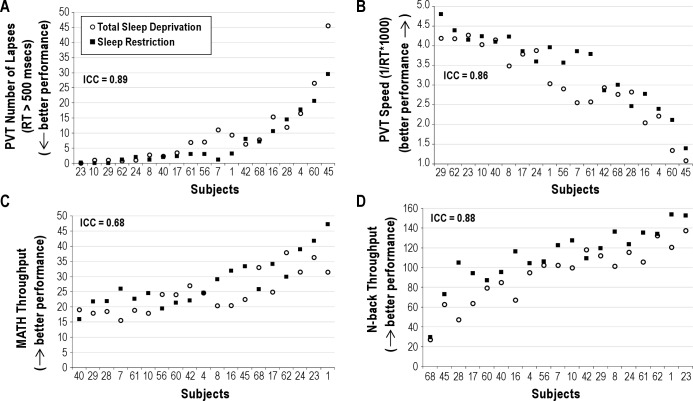
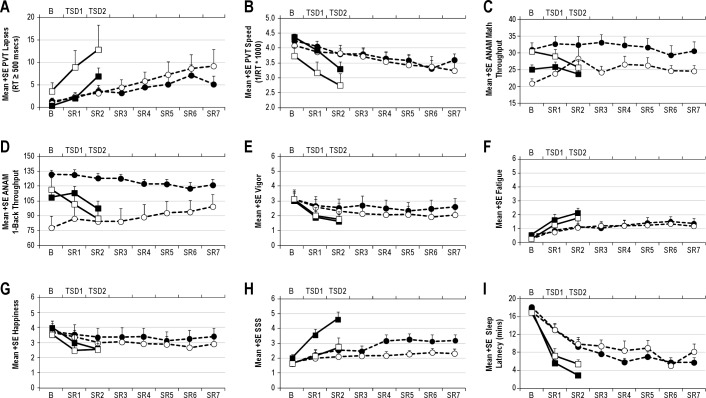
Figure 2 illustrates response to TSD and SR for PVT lapses (Panel A) and speed (Panel B). Rank ordering on PVT lapses was similar to that for PVT speed; and of the 7 most vulnerable volunteers, rank ordering was nearly identical for PVT lapses and PVT speed. Eight volunteers maintained lapsing rates of < 5 lapses per test session during the last 12 h of TSD and last day of SR (Figure 2, Panel A). Responsivity to TSD/SR showed almost perfect stability for lapses (ICC = 0.89) and speed (ICC = 0.86); ICC values were significant for both (Table 3; Ps < 0.05). Patterns of change over days for the group means with differentiation between the 2 orders of conditions for PVT lapses and speed are shown in Figure 3, Panels A and B. Although it appeared that during TSD, PVT performance was worse for the group who underwent SR first and TSD second (Figure 3, Panels A and B, open symbols), order effects were not significant for PVT lapses or speed (Table 3; Ps > 0.05). Condition effects (TSD v. SR) were significant (Table 3; Ps < 0.05), with greater lapses and worse speed overall for TSD than SR (mean lapses = 9.9 v. 7.1 for TSD v. SR respectively; mean speed = 3.0 v. 3.4 for TSD v. SR respectively).
Figure 2.
Responses to Total Sleep Deprivation (TSD; solid black squares) and Sleep Restriction (SR; open circles), calculated as the average of the last 12 h of sleep deprivation and the last 12 h of sleep restriction day 7 for (A) psychomotor vigilance task lapses, (B) psychomotor vigilance task speed, (C) ANAM MATH throughput, and (D) ANAM 1-Back throughput. Volunteers are indicated by randomly assigned numbers and rank order of volunteers on the x-axis was determined by ranking of the average of the responses to TSD and SR. ICC values are indicated in italics at the top of each figure.
Figure 3.
Patterns of change over days for the group means with differentiation between the 2 orders of conditions for (A) psychomotor vigilance task lapses, (B) psychomotor vigilance task speed, (C) ANAM Mathematical Processing, (D) ANAM 1-Back, (E) Vigor, (F) Fatigue, (G) Happiness, (H) Stanford Sleepiness Scale, and (I) MWT sleep latency. Days of Total Sleep Deprivation (TSD) are indicated on the top x-axis, and days of Sleep Restriction (SR) are indicated on the bottom x-axis. Closed circles indicate SR condition with order of SR second; open circles indicate SR condition with SR first; closed squares indicate TSD condition with order of SD first; and open squares indicate TSD condition with TSD second.
Secondary analyses with baseline performance as a covariate showed almost perfect stability for lapses and moderate stability for speed (Table 4).
Table 4.
Results of variance components analyses performed to assess trait-like inter-individual variability in impairment resulting from TSD and SR with Baseline performance included as a covariate
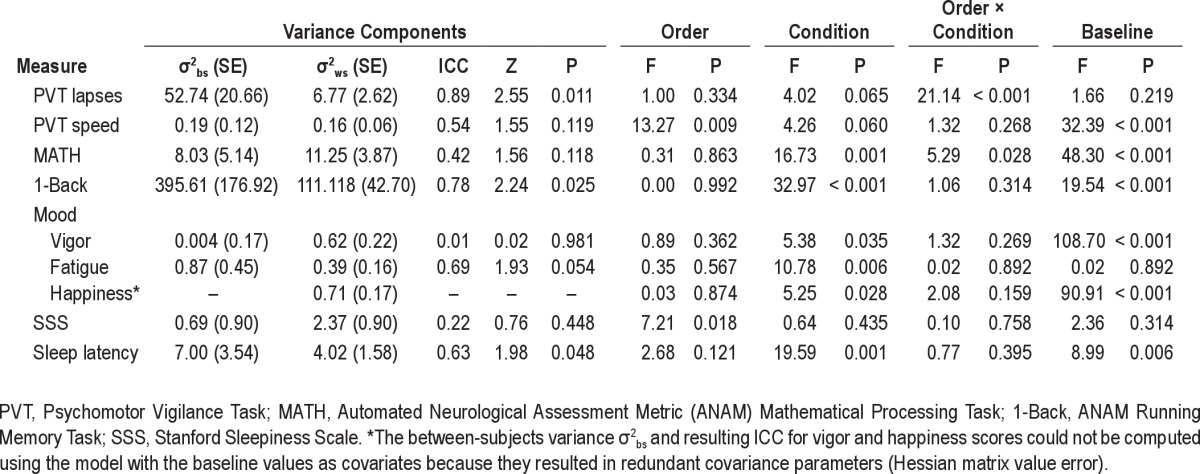
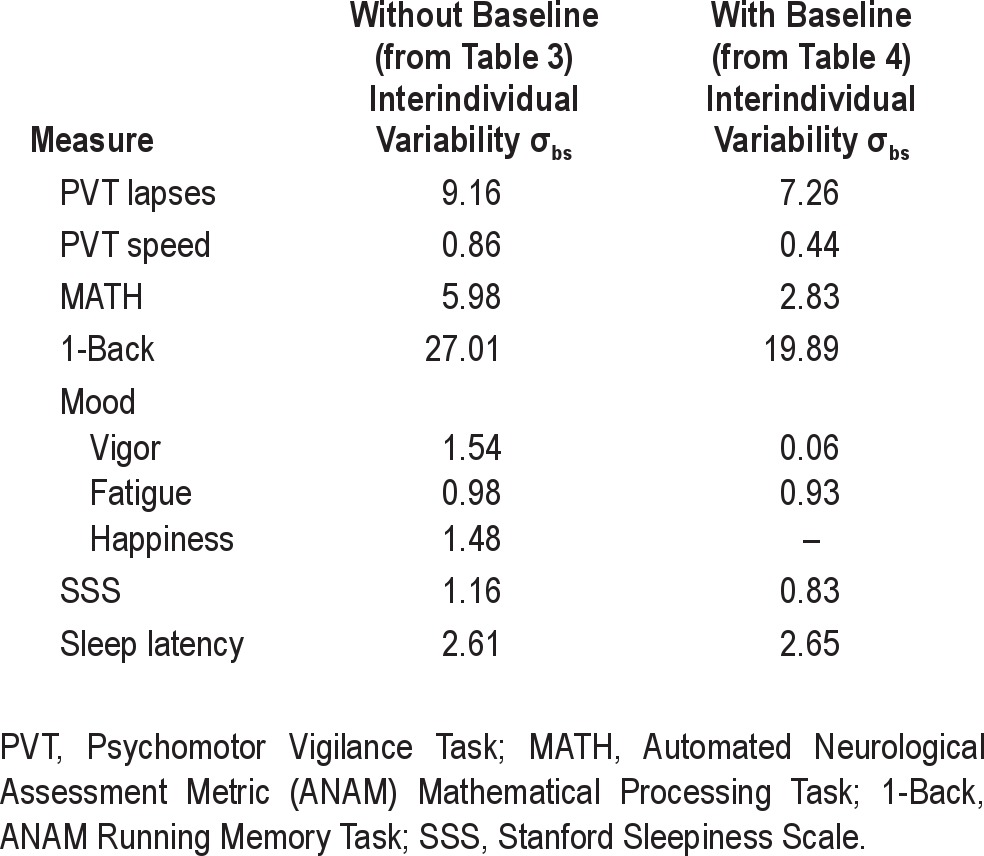
Standard deviations for all analyses are presented in Table 5.
Table 5.
Magnitudes of trait-like interindividual differences σbs (square root of between-subjects variance σbs from Tables 3 and 4) during sleep loss
ANAM Mathematical Processing (MATH) and 1-Back
Throughput on ANAM MATH and 1-Back for TSD and SR is illustrated in Figure 2, Panels C and D respectively. Stability in responsivity to TSD/SR was substantial for MATH throughput and almost perfect for 1-Back throughput (Table 3); ICCs were statistically significant for the 1-Back and MATH (see Table 3; Ps < 0.05). Patterns of change over days for the group means with differentiation between the 2 orders of conditions for ANAM Math and 1-back are shown in Figure 3, Panels C-D. Performance was better during SR than TSD for the group who underwent TSD first and SR second (Order × Condition effect, Ps > 0.05 for both tasks, Table 3; Figure 3 Panels C and D, closed symbols). Condition effects (TSD v. SR) were significant for the 1-Back (Table 3; P < 0.05), with worse performance overall for TSD than SR (mean 1-Back throughput = 93.3 v. 110.3 for TSD v. SR, respectively). Secondary analyses with baseline performance as a covariate showed that stability in responsivity to TSD/SR was moderate for MATH throughput and substantial for 1-Back throughput (Table 4).
ANAM Mood Scale (MS)
Figure 4 illustrates responses for mood variables vigor, fatigue, and happiness (Panels A-C). Variables restlessness, anger, anxiety, and depression demonstrated considerable floor effects (subject responses for these variables were nearly all at 0 for most volunteers) and were discarded from further ICC analyses (floor effects confound the ICC). Stability in response to TSD and SR were almost perfect for vigor and happiness; substantial for fatigue (Table 3); ICC values were significant for all scales (Table 3). Patterns of change over days for the group means with differentiation between the 2 orders of conditions for mood scales are shown in Figure 3, Panels E-G. Vigor ratings were higher during SR v. TSD for the group that underwent SD first followed by SR second (Order × Condition effect, Ps > 0.05, Table 3; Figure 3 Panel E, closed symbols). Order effects were not significant for other mood variables (order effects, Ps < 0.05; see Table 3). Condition effects (TSD v. SR) were significant (Table 3; Ps < 0.05), with lower vigor and happiness ratings overall for TSD than SR (mean vigor = 1.7 v. 2.3 for TSD v. SR respectively; mean happiness = 2.6 v. 3.2 for TSD v. SR, respectively) and higher mean fatigue ratings overall for TSD than SR (mean fatigue = 2.0 v. 1.3 for TSD v. SR, respectively).
Figure 4.
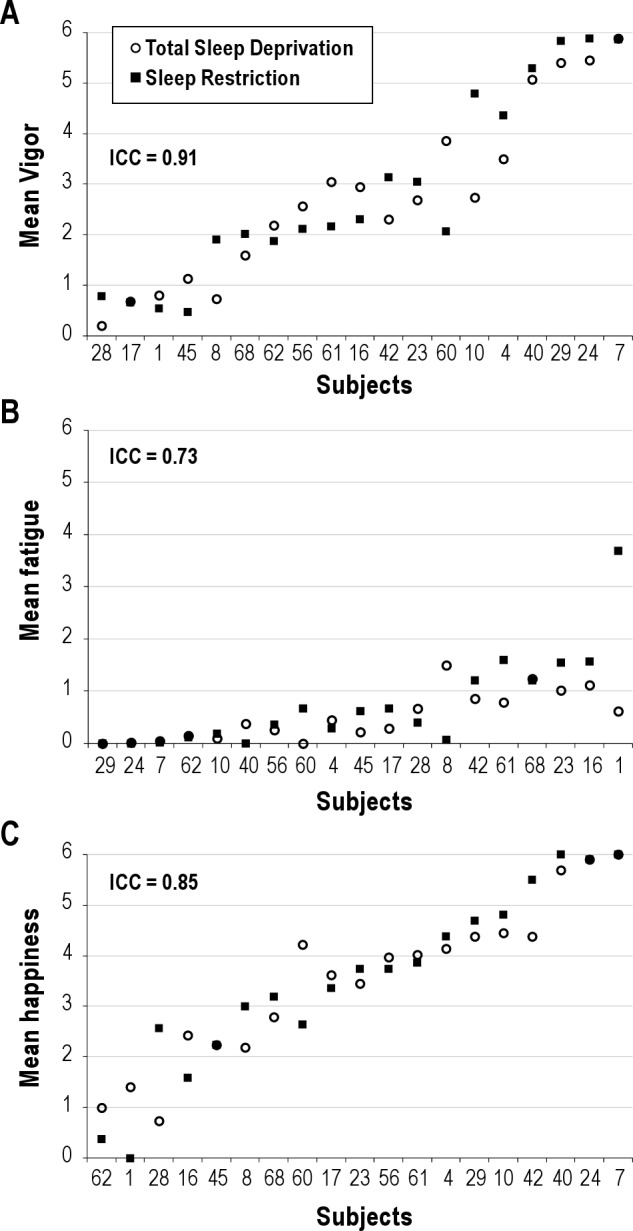
Responses to Total Sleep Deprivation (TSD; solid black squares) and Sleep Restriction (SR; open circles), calculated as the average of the last 12 h of sleep deprivation and the last 12 h of sleep restriction Day 7 for mood variables (A) vigor, (B) fatigue, (C) happiness. Volunteers are indicated by randomly assigned numbers and rank order of volunteers on the x-axis was determined by ranking of the average of the responses to TSD and SR. ICC values are indicated in italics at the top of each graph.
Secondary analyses with baseline performance as a covariate showed that stability in response to TSD and SR was substantial for fatigue (Table 4). The test statistics (including the between-subjects variance σ2bs and resulting ICC) for happiness scores could not be computed using the model with baseline values as covariates because it resulted in redundant covariance parameters (Hessian matrix value error).
Stanford Sleepiness Scale (SSS)
Figure 5 illustrates responses for subjective sleepiness (Panel A). Subjective sleepiness responses to TSD and SR were moderately stable (Table 3); however, the ICC value was not statistically significant (Table 3, P = 0.122). Patterns of change over days for the group means with differentiation between the 2 orders of conditions for SSS are shown in Figure 3, Panel H. Order effects were statistically significant such that volunteers who completed TSD first reported greater overall sleepiness compared to volunteers who completed SR first (mean SSS = 5.1 v. 3.4 for TSD first v. SR first, respectively; P < 0.05). Condition effects (TSD v. SR) were not significant (Table 3; P > 0.05).
Figure 5.
Responses to Total Sleep Deprivation (TSD; solid black squares) and Sleep Restriction (SR; open circles), calculated as the average of the last 12 h of sleep deprivation and the last 12 h of sleep restriction day 7 for sleepiness measured as (A) Stanford Sleepiness Scale (SSS) and (B) modified maintenance of wakefulness test (MWT). Volunteers are indicated by randomly assigned numbers and rank order of volunteers on the x-axis was determined by ranking of the average of the responses to TSD and SR. ICC values are indicated in italics at the top of each figure.
Secondary analyses with baseline performance as a covariate showed that subjective sleepiness responses to TSD and SR were fairly stable (Table 4); however, the ICC values were not statistically significant (P = 0.448).
Modified Maintenance of Wakefulness Task (MWT)
Figure 5 illustrates responses for objective sleepiness (Panel B). Stability in responsivity to TSD and SR as measured by latency to stage 1 sleep was moderately stable but not statistically significant (Table 3, P > 0.05). Patterns of change over days for the group means with differentiation between the 2 orders of conditions for MWT sleep latency are shown in Figure 3, Panel I. Order effects were not significant (P > 0.05; see Table 3). The condition effect (TSD v. SR) was significant (Table 3; P < 0.05), with shorter sleep latency (greater sleepiness) overall for TSD than SR (mean sleep onset latency = 3.7 v. 7.0 min for TSD v. SR, respectively). Secondary analyses with baseline sleep latency as a covariate showed that stability in responsivity to TSD and SR was stable and statistically significant (Table 4).
DISCUSSION
Results from the present study indicated trait-like inter-individual variability in response to sleep loss: volunteers who expressed greater vulnerability to TSD also expressed greater vulnerability to SR. These results expand upon previous findings showing trait-like vulnerability under repeated exposures to TSD,4 revealing similar trait-like responsivity to sleep restriction.
Although cognitive performance and mood findings revealed trait-like responsivity to total sleep deprivation and sleep restriction, objective alertness (MWT) and subjective sleepiness (SSS) did not. With regard to the SSS, one interpretation of the finding that volunteers who completed TSD first reported greater overall sleepiness than volunteers who completed SR first is the possibility of greater subjective habituation to SR as compared to TSD during the sleep loss period. Van Dongen et al.4 reported that responsivity in subjective sleepiness as measured by the Karolinska Sleepiness Scale was trait-like, suggesting the possibility that the present failure to find trait-like responsivity for subjective sleepiness may have been due to the use of a different metric (the SSS). Alternatively, the discrepancy in findings regarding subjective sleepiness may be a result of Van Dongen et al.'s evaluation of trait-like responsivity using a TSD/TSD paradigm (as opposed to the TSD/SR paradigm in the present study). Consistent with previous findings using a TSD/TSD paradigm, subjective fatigue did show a trait-like response to TSD/SR in the present study.
The findings (or lack of) with regard to sleepiness also suggests that different neurophysiological mechanisms underlie the response to sleep loss for sleepiness versus for neurobehavioral performance; perhaps reflective of different brain regions governing different types of responses. These findings are consistent with previous studies showing dissociation between subjective and objective measurements of sleepiness.1,21,22 Specifically, evidence suggests dissociation between subjective and objective measures of sleepiness in individuals exposed to seven days of sleep restriction.2 After one week of sleep restricted to 3, 5, or 7 hours per night, volunteers' levels of subjective sleepiness returned to baseline levels for all groups after 1 night of 8 hours recovery sleep, while performance (PVT lapses) did not recover to baseline even after 3 nights of recovery.2 Similar to the findings of Van Dongen et al.,4,23 the rank order of individuals in terms of vulnerability varied from outcome measure to outcome measure. The present results shed new light on the nature of the outcome-dependence of the individual differences: similar to stated above, the findings suggest that different neurophysiological mechanisms underlie various aspects of neurobehavioral performance, perhaps reflective of different brain regions governing different types of cognitive performance.
In general, the order of participation in our two experimental conditions (i.e., whether volunteers underwent TSD first or SR first) did not affect outcomes. One exception is subjective sleepiness: volunteers who underwent the SR condition first reported less subjective sleepiness during both SR and TSD. These results could suggest that individuals viewed SR as less aversive than TSD and adjusted their subjective ratings of sleepiness accordingly. Critically, this apparent demand characteristic (which is unavoidable since conditions cannot be blinded) did not impact objective alertness or PVT performance, since results for these outcome metrics did not reveal significant order effects or Condition × Order interactions (though it is possible that the power of the study may not have been high enough to detect these interactions). On the last day of SR or TSD, performance on ANAM Math and 1-Back tasks was better for SR than TSD in the group who completed TSD first (see Figure 3, Panels C and D, closed symbols). These results suggest a cumulative learning effect for ANAM tasks—an effect which has been demonstrated previously.24 That this cumulative learning effect was not seen on the last day of TSD in volunteers who underwent SR first suggests that the negative effects of TSD outweighed learning. The latter hypothesis is supported by our other finding that overall the TSD condition was more potent in disrupting neurobehavioral performance than was the SR condition.
Secondary analyses were conducted which included baseline performance (i.e., performance prior to TSD or SR) as a covariate. These analyses were performed to determine whether baseline differences affected ICC values during sleep loss. Inclusion of this covariate resulted in lower ICC values for PVT speed, ANAM Math and 1-Back, and SSS, and higher values for MWT sleep latency. These results suggest that the stable individual differences observed for these outcome measures are not due to sleep loss alone, but also are related to other individual difference factors at baseline (e.g., test aptitude). Specific factors potentially contributing to these baseline differences remain to be elucidated. ICC values for PVT lapses and ANAM 1-Back remained significant with the inclusion of baseline performance, suggesting that the observed individual differences for these measures were due to sleep loss.
Of note, in the present study, the equivalence between total sleep deprivation—for which trait-like vulnerability has been clearly demonstrated by Van Dongen et al.4—and sustained sleep restriction implies that trait-like vulnerability also applies to the latter. Trait-like vulnerability has not been established for repeated bouts of sleep restriction, and thus this inference is being made in the present study. In addition, in the present study, the amount of sleep per night during sleep restriction was 3 hours; thus it remains to be investigated whether differential vulnerability to sleep restriction at greater time in bed (e.g., 4 hours) may be distinct from that seen for 3 hours time in bed and total sleep deprivation. Likewise, the findings are based on a comparison of performance following two nights of TSD with performance following 6 days of severe SR to 3 TIB per night: the conclusion that TSD may serve to predict response to SR may be limited to this comparison and it is unknown whether varying durations would similarly be predictive. Finally, analyses in the present study were performed by averaging over 12 hours of the daytime period of the last day of each condition. As a result, the influence of the circadian rhythm is embedded in the findings in the present paper and may contribute to the individual differences in vulnerability to sleep loss.
The findings are based on a population of healthy, young adults (ages 18–39), with no reported sleep disorders. The extent to which the findings are specific to the population studied and/or may generalize to other populations is untested. We speculate that these findings would generalize to other age categories of healthy adults and to healthy adults in other occupational settings (e.g., medical residents). It is unclear if individuals with sleep disorders (e.g., sleep apnea) would show the same pattern of response given their presumed alterations in sleep/wake functioning. In addition, a limitation of the study is the relatively modest sample size (N = 19).
One final point to consider in interpretation of the results is that we were limited by our use of SPSS and its default Satterthwaite approximation for variance estimates. Although the Satterthwaite approximation is a conservative approximation, the estimates for the variance components may have been biased. This is an issue that requires further exploration. Findings of trait-like inter-individual variability in response to sleep loss have implications for mathematical modeling. Mathematical modeling efforts have generally focused on neurobehavioral response to acute sleep deprivation.25,26 Though some more recent efforts have focused on mathematical modeling of performance during conditions of chronic sleep restriction,6,27 it is unclear how well mathematical models developed based on data from acute total sleep deprivation translate to chronic sleep restriction. Data from the present study suggest similarity in neurobehavioral response to sleep loss from TSD or CSR among individuals, and that response to TSD may serve to reliably predict response during CSR. From a practical standpoint, testing individuals under conditions of TSD is less time consuming and burdensome versus testing during CSR. Utilization of these findings may provide for more efficient assessment of an individual's relative vulnerability/resiliency to sleep loss based on exposure to an acute period of total sleep deprivation—data potentially useful in an operational environment or for job assignments requiring periods of chronic sleep loss.
In summary, because results from the present study indicate trait-like neurobehavioral responsivity to TSD and SR, it follows that one's response to TSD may serve to reliably predict one's response to SR (at least for the conditions investigated here), though performance at baseline also impacts responsivity. From a practical standpoint, the results suggest that vulnerability to chronic sleep restriction may be efficiently predicted by testing individuals under conditions of acute TSD, despite the fact that the latter is a more potent challenge. Individual difference factors underlying this trait-like responsivity remain to be elucidated. Examination of genetic and other potential biomarkers underlying vulnerability to sleep loss is currently underway.
DISCLOSURE STATEMENT
This was not an industry supported study. The authors have indicated no financial conflicts of interest.
ACKNOWLEDGMENTS
This work was supported by the US Army Medical Research and Materiel Command. We thank the student contractors, military personnel, on-call physicians Drs. John Hughes and LTC Melanie Guerrero, and study volunteers for their dedicated work and participation in the study.
This material has been reviewed by the Walter Reed Army Institute of Research, and there is no objection to its presentation and/or publication. The opinions or assertions contained herein are the private views of the authors and are not to be construed as official or as reflecting the position of the Department of the Army of the Department of Defense.
Footnotes
A commentary on this article appears in this issue on page 1031.
REFERENCES
- 1.Van Dongen HP, Maislin G, Mullington JM, Dinges DF. The cumulative cost of additional wakefulness: dose-response effects on neurobehavioral functions and sleep physiology from chronic sleep restriction and total sleep deprivation. Sleep. 2003;26:117–26. doi: 10.1093/sleep/26.2.117. [DOI] [PubMed] [Google Scholar]
- 2.Belenky G, Wesensten NJ, Thorne DR, et al. Patterns of performance degradation and restoration during sleep restriction and subsequent recovery: a sleep dose-response study. J Sleep Res. 2003;12:1–12. doi: 10.1046/j.1365-2869.2003.00337.x. [DOI] [PubMed] [Google Scholar]
- 3.Carskadon MA, Dement WC. Effects of total sleep loss on sleep tendency. Percept Mot Skills. 1979;48:495–506. doi: 10.2466/pms.1979.48.2.495. [DOI] [PubMed] [Google Scholar]
- 4.Van Dongen HP, Baynard MD, Maislin G, Dinges DF. Systematic interindividual differences in neurobehavioral impairment from sleep loss: evidence of trait-like differential vulnerability. Sleep. 2004;27:423–33. [PubMed] [Google Scholar]
- 5.Rupp TL, Wesensten NJ, Bliese PD, Balkin TJ. Banking sleep: realization of benefits during subsequent sleep restriction and recovery. Sleep. 2009;32:311–21. doi: 10.1093/sleep/32.3.311. [DOI] [PMC free article] [PubMed] [Google Scholar]
- 6.McCauley P, Kalachev LV, Smith AD, Belenky G, Dinges DF, Van Dongen HP. A new mathematical model for the homeostatic effects of sleep loss on neurobehavioral performance. J Theor Biol. 2009;256:227–39. doi: 10.1016/j.jtbi.2008.09.012. [DOI] [PMC free article] [PubMed] [Google Scholar]
- 7.Strecker RE, Basheer R, McKenna JT, McCarley RW. Another chapter in the adenosine story. Sleep. 2006;29:426–8. doi: 10.1093/sleep/29.4.426. [DOI] [PubMed] [Google Scholar]
- 8.Horne JA, Ostberg O. A self-assessment questionnaire to determine morningness-eveningness in human circadian rhythms. Int J Chronobiol. 1976;4:97–110. [PubMed] [Google Scholar]
- 9.Beck AT, Steer RA. San Antonio, TX: The Psychological Corporation; 1993. Manual for the Beck Depression Inventory. [Google Scholar]
- 10.Cole RJ, Kripke DF, Gruen W, Mullaney DJ, Gillin JC. Automatic sleep/wake identification from wrist activity. Sleep. 1992;15:461–9. doi: 10.1093/sleep/15.5.461. [DOI] [PubMed] [Google Scholar]
- 11.Lim J, Dinges DF. Sleep deprivation and vigilant attention. Ann N Y Acad Sci. 2008;1129:305–22. doi: 10.1196/annals.1417.002. [DOI] [PubMed] [Google Scholar]
- 12.Short P, Cernich A, Wilken JA, Kane RL. Initial construct validation of frequently employed ANAM measures through structural equation modeling. Arch Clin Neuropsychol. 2007;22(Supplement 1):63–77. doi: 10.1016/j.acn.2006.10.012. [DOI] [PubMed] [Google Scholar]
- 13.Kabat MH, Kane RL, Jefferson AL, DiPino RK. Construct validity of selected Automated Neuropsychological Assessment Metrics (ANAM) battery measures. Clin Neuropsychol. 2001;15:498–507. doi: 10.1076/clin.15.4.498.1882. [DOI] [PubMed] [Google Scholar]
- 14.Kane RL, Reeves D. Computerized test batteries. In: Horton A, editor. The Neuropsychology Handbook. ed. New York: Springer; 1997. [Google Scholar]
- 15.Hoddes E, Zarcone V, Smythe H, Phillips R, Dement W. Quantification of sleepiness: a new approach. Psychophysiology. 1973;10:431–6. doi: 10.1111/j.1469-8986.1973.tb00801.x. [DOI] [PubMed] [Google Scholar]
- 16.Johnson DR, Vincent AS, Johnson AE, Gilliland K, Schlegel RE. Reliability and construct validity of the Automated Neuropsychological Assessment Metrics (ANAM) mood scale. Arch Clin Neuropsychol. 2008;23:73–85. doi: 10.1016/j.acn.2007.10.001. [DOI] [PubMed] [Google Scholar]
- 17.Greenhouse SW, Geisser S. On methods in the analysis of profile data. Psychometrika. 1959;24:95–112. [Google Scholar]
- 18.Landis JR, Koch GG. The measurement of observer agreement for categorical data. Biometrics. 1977;33:159–74. [PubMed] [Google Scholar]
- 19.Shahid A, Shen J, Shapiro CM. Measurements of sleepiness and fatigue. J Psychosom Res. 2010;69:81–9. doi: 10.1016/j.jpsychores.2010.04.001. [DOI] [PubMed] [Google Scholar]
- 20.Neu D, Kajosch H, Peigneux P, Verbanck P, Linkowski P, Le Bon O. Cognitive impairment in fatigue and sleepiness associated conditions. Psychiatry Res. 2011;189:128–34. doi: 10.1016/j.psychres.2010.12.005. [DOI] [PubMed] [Google Scholar]
- 21.Van Dongen HP, Maislin G, Dinges DF. Dealing with inter-individual differences in the temporal dynamics of fatigue and performance: importance and techniques. Aviat Space Environ Med. 2004;75(3 Suppl):A147–54. [PubMed] [Google Scholar]
- 22.Leproult R, Colecchia EF, Berardi AM, Stickgold R, Kosslyn SM, Van Cauter E. Individual differences in subjective and objective alertness during sleep deprivation are stable and unrelated. Am J Physiol Regul Integr Comp Physiol. 2003;284:R280–90. doi: 10.1152/ajpregu.00197.2002. [DOI] [PubMed] [Google Scholar]
- 23.Van Dongen HP, Caldwell JA, Jr, Caldwell JL. Investigating systematic individual differences in sleep-deprived performance on a high-fidelity flight simulator. Behav Res Methods. 2006;38:333–43. doi: 10.3758/bf03192785. [DOI] [PubMed] [Google Scholar]
- 24.Rupp TL, Wesensten NJ, Balkin TJ. Sleep history affects task acquisition during subsequent sleep restriction and recovery. J Sleep Res. 2010;19:289–97. doi: 10.1111/j.1365-2869.2009.00800.x. [DOI] [PubMed] [Google Scholar]
- 25.Rajaraman S, Gribok AV, Wesensten NJ, Balkin TJ, Reifman J. Individualized performance prediction of sleep-deprived individuals with the two-process model. J Appl Physiol. 2008;104:459–68. doi: 10.1152/japplphysiol.00877.2007. [DOI] [PubMed] [Google Scholar]
- 26.Van Dongen HP, Mott CG, Huang JK, Mollicone DJ, McKenzie FD, Dinges DF. Optimization of biomathematical model predictions for cognitive performance impairment in individuals: accounting for unknown traits and uncertain states in homeostatic and circadian processes. Sleep. 2007;30:1129–43. doi: 10.1093/sleep/30.9.1129. [DOI] [PMC free article] [PubMed] [Google Scholar]
- 27.Akerstedt T, Ingre M, Kecklund G, Folkard S, Axelsson J. Accounting for partial sleep deprivation and cumulative sleepiness in the three-process model of alertness regulation. Chronobiol Int. 2008;25:309–19. doi: 10.1080/07420520802110613. [DOI] [PubMed] [Google Scholar]
- 28.Duffy JF, Rimmer DW, Czeisler CA. Association of intrinsic circadian period with morningness-eveningness, usual wake time, and circadian phase. Behav Neurosci. 2001;115:895–9. doi: 10.1037//0735-7044.115.4.895. [DOI] [PubMed] [Google Scholar]
- 29.Chee MW, Chuah LY, Venkatraman V, Chan WY, Philip P, Dinges DF. Functional imaging of working memory following normal sleep and after 24 and 35 h of sleep deprivation: Correlations of fronto-parietal activation with performance. Neuroimage. 2006;31:419–28. doi: 10.1016/j.neuroimage.2005.12.001. [DOI] [PubMed] [Google Scholar]
- 30.Chuah YM, Venkatraman V, Dinges DF, Chee MW. The neural basis of interindividual variability in inhibitory efficiency after sleep deprivation. J Neurosci. 2006;26:7156–62. doi: 10.1523/JNEUROSCI.0906-06.2006. [DOI] [PMC free article] [PubMed] [Google Scholar]
- 31.Chuah LY, Chee MW. Cholinergic augmentation modulates visual task performance in sleep-deprived young adults. J Neurosci. 2008;28:11369–77. doi: 10.1523/JNEUROSCI.4045-08.2008. [DOI] [PMC free article] [PubMed] [Google Scholar]
- 32.Chee MW, Chuah LY. Functional neuroimaging insights into how sleep and sleep deprivation affect memory and cognition. Curr Opin Neurol. 2008;21:417–23. doi: 10.1097/WCO.0b013e3283052cf7. [DOI] [PubMed] [Google Scholar]
- 33.Bliese PD, Wesensten NJ, Balkin TJ. Age and individual variability in performance during sleep restriction. J Sleep Res. 2006;15:376–85. doi: 10.1111/j.1365-2869.2006.00557.x. [DOI] [PubMed] [Google Scholar]
- 34.Philip P, Taillard J, Sagaspe P, et al. Age, performance and sleep deprivation. J Sleep Res. 2004;13:105–10. doi: 10.1111/j.1365-2869.2004.00399.x. [DOI] [PubMed] [Google Scholar]


