

Background: Our understanding of immune responses at early stages of obesity is very limited.
Results: Acute HFD feeding promotes alternative macrophage polarization in adipose tissue via NKT cells and IL-4.
Conclusion: NKT cells in adipose tissue play important role in linking acute HFD feeding with adipose inflammation.
Significance: Acute HFD feeding is unexpectedly associated with pronounced and dynamic immune responses in adipose tissue.
Keywords: Adipose Tissue, Inflammation, Insulin Resistance, Macrophages, Metabolism
Abstract
Inflammation in adipose tissue plays an important role in the pathogenesis of obesity-associated complications. However, the detailed cellular events underlying the inflammatory changes at the onset of obesity have not been characterized. Here we show that an acute HFD challenge is unexpectedly associated with elevated alternative (M2) macrophage polarization in adipose tissue mediated by Natural Killer T (NKT) cells. Upon 4d HFD feeding, NKT cells are activated, promote M2 macrophage polarization and induce arginase 1 expression via interleukin (IL)-4 in adipose tissue, not in the liver. In NKT-deficient CD1d−/− mice, M2 macrophage polarization in adipose tissue is reduced while systemic glucose homeostasis and insulin tolerance are impaired upon 4d HFD challenge. Thus, our study demonstrate, for the first time to our knowledge, that acute HFD feeding is associated with remarkably pronounced and dynamic immune responses in adipose tissue, and adipose-resident NKT cells may link acute HFD feeding with inflammation.
Introduction
Obesity is associated with a state of chronic low-grade inflammation that significantly contributes to the pathogenesis of this disorder and its associated complications. Specifically, data show that expanding adipose tissue attracts immune cells and releases cytokines that may cause insulin resistance, disrupt lipid metabolism, and promote atherosclerosis (1–3). Despite these advances, a comprehensive picture of inflammation, specifically at the initiation and resolution stages in adipose tissue, has not yet emerged (3). Notably, our understanding of the events associated with the early stages of obesity is very limited as the focus of the field has been on the long-term diet-induced or fully established chronic obesity (3).
It should be recognized that the early stage of obesity is an integral part of its biology. A better delineation of the events associated with the early stages or onset of obesity may not only help understand the often-irreversible changes that take place at the established phase of obesity, but also may reveal the interplay between metabolic and immune systems when challenged with a new diet highly enriched in lipids. Indeed, several studies have shown that changes in body weight, adiposity, and hepatic insulin resistance occur within a week following high fat diet (HFD)6 feeding (4–9), and coincide with alterations in the expression of immunity-related genes in adipose tissue (5, 9). Interestingly, a recent study showed that 3 day (d) HFD may induce pro-inflammatory responses in adipose tissue, which surprisingly was not sufficient to induce systemic insulin resistance (9). Thus, the detailed cellular events underlying the inflammatory changes at the onset of obesity remain to be characterized.
NKT cells have been implicated in autoimmunity, microbial infection and cancer and hence, represent an important immunotherapeutic target (10). Unlike conventional CD4+ and CD8+ T cells, NKT cells recognize and are activated by lipid antigens presented by the MHC class I homologue molecule CD1d on antigen-presenting cells such as macrophages and dendritic cells (11, 12). The prototypical lipid antigen is α-galactosylceramide (αGalCer) (13). Lipid-activated NKT cells secrete large amounts of TH1 and TH2 cytokines, including IFN-γ and IL-4 (14), underlying their unique regulatory functions that bridge innate and adaptive immunity (15, 16). It is important to note that secretion of TH1 and/or TH2 cytokines by NKT cells is context-dependent (15, 16) as the nature of the lipid antigens, the types of antigen-presenting cells, and the microenvironment of the tissues may have significant influences on their cytokine profiles (17, 18). Indeed, studies have shown that NKT cells may promote or suppress immune processes by skewing adaptive immune responses toward either a TH1 or TH2 response (15, 19). Subsequently, TH1/TH2 responses influence the polarization of macrophages to either classical (M1) or alternative (M2) activation status (1, 2, 20, 21). Unlike M1, M2 macrophages resolve inflammation (i.e. anti-inflammation) and facilitate wound healing (20, 22–24).
Reports on the role of NKT cells in obesity and diabetes are recently emerging. We and two other groups independently showed that CD1d−/− mice lacking NKT cells exhibit no metabolic changes following long-term HFD feeding (25–27) while another recent study showed that CD1d−/− mice are resistant to the metabolic effects of HFD feeding and remain glucose tolerant upon long-term HFD feeding (28). The discrepancy among studies may be due to a different diet used in the latter study. Furthermore, we recently showed that the activation of NKT cells by αGalCer promotes M2 macrophage polarization in adipose tissue and improves systemic glucose homeostasis at different stages of obesity (27).
As lipid-sensing NKT cells are early effector cells in immunity (29), one interesting question is whether NKT cells play a role in acute HFD response. Here we show that short-term 4d HFD feeding unexpectedly promotes M2 macrophage polarization and arginase 1 expression in adipose tissue; and strikingly, this effect is mediated by NKT cells, in part via IL-4.
EXPERIMENTAL PROCEDURES
Mouse Models
WT C57/B6 (000664), B6.129S6-Cd1d1/Cd1d2tm1spb/J (CD1d−/−, 008881), and B6.129P2-IL4tm1Cgn/J (IL-4−/−, 002253) were purchased from the Jackson Laboratory with the latter two backcrossed to the B6 background over 13 and 12 times, respectively. Mice were housed in microisolators in pathogen-free facility with 13% LFD with 13% fat, 67% carbohydrate, and 20% protein from Harlan Teklad (2914). At 6 weeks old, male mice were fed with either 13% LFD or 60% HFD with 59% fat, 26% carbohydrate, and 15% protein from Bio-Serv Inc. (F3282). Fatty acid compositions in each diet are listed in supplemental Table S1. For GTT, mice were fasted for 16–18 h followed by injection of glucose (Sigma) at 1 g/kg body weight. For ITT, mice were fasted for 4–6 h followed by injection of insulin (Sigma) at 40 μg/kg body weight. Blood glucose was monitored using One-Touch Ultra Glucometer. Fasting insulin levels were measured following a 6h fast. Mice were sacrificed by cervical dislocation and tissues were immediately harvested. Frozen tissues were stored at −80 °C. All animal procedures were approved by the Cornell IACUC.
Antibodies and Reagents for Flow Cytometry
Fluorochrome- or biotin-conjugated antibodies have been previously described (27). αGalCer-loaded CD1d-tetramer-PE was generously provided by the NIH Tetramer Facility (Atlanta, GA). Data were analyzed using the CellQuest (BD Biosciences) and Flowjo software (Flowjo.com).
Flow Cytometric Analysis
Purification of stromal vascular cells (SVC) from epididymal fat pads followed by flow cytometric analysis using the FACSCalibur Flow Cytometer (BD Biosciences) were performed as previously described (27, 30). Quantitation of various immune cells in adipose tissues was described previously (27). For intracellular staining of Arg1, SVC of adipose tissue was labeled with anti-CD45 and anti-F4/80 antibodies followed by fixation and permeabilization using the BD Fixation/Permeabilization kit per supplier's protocol. Cells were then incubated with mouse anti-Arg1 (BD clone 19, 1:50) or mouse IgG1 (Biolegend MG1–45) for 40 min followed by donkey anti-mouse IgG-FITC (Jackson ImmunoResearch 715095151, 1:50) for 30 min at 4 °C. After three washes, cells were resuspended in 300 μl of PBS for flow.
MACS Purification of Immune Cells from SVC of White Adipose Tissues (WAT)
The SVC part were further purified by density centrifugation using 30 and 70% Percoll at 1200 × g for 30 min at 4 °C. The buffy layer at the interface between 70 and 30% Percoll was collected, washed, and suspended in PBS. This extra purification step separates tissue debris and aggregates from lymphoid, myeloid cells and other somatic cells. NKT cells were positively collected using the MACS technology with a combination of αGalCer-loaded CD1d-Tetramer-PE and anti-PE MicroBeads (Miltenyi Biotec Inc.) per supplier's protocol. Briefly, after blocking FcγR with anti-mouse CD16/32 antibody (BD clone 2.4G2), 1 × 10⁷ cells were suspended in 150 μl of PBS and 5 μl of αGalCer-loaded CD1d-tetramer-PE at 4 °C for 1 h. After two washes with PBS, cells were incubated with 50 μl of anti-PE MicroBeads in 100 μl of PBS for 40 min at 4 °C, and then placed in the IMagTM Cell Separation Magnet (BD) for 8 min. The retained positive portion were resuspended in 1 ml of PBS and placed in the magnetic field for another 8 min. The negative portions were combined and further incubated with the CD4-PE or Siglec-F-PE antibody (1:30 dilution) for the purification of CD4+ T cells or Siglec-F+ eosinophils. Purities of each positive and negative fractions were determined by flow cytometry. Cells were subsequently cultured at 2 × 10⁴ cells/well in a 96-well plate for 12 h. Supernatant was collected for IL-4 ELISA.
RNA Extraction, Quantitative (Q), and Reverse-transcription (RT)-PCR
RNA extraction from cells and murine tissues, and Q-PCR were carried out as previously described (31) using Trizol (Invitrogen) for liver, and Trizol plus QIAeasy kit (Qiagen) for adipose tissues with DNase digestion (Roche). Q-PCR data collected on the Roche LightCycler 480 were normalized to ribosomal l32 gene in the corresponding sample. Supplemental Table S2 lists the primer sequences.
Western Blot and Quantitation
Lysates preparation, Western blots, antibodies, and band density quantitation were performed as previously described (27, 31). Lysates from adipocytes were concentrated 10-fold using the Microsep 10K MWCO microconcentrators (Pall Corp.).
Culture of Bone Marrow-derived Macrophages (BMDM) and Primary Adipocytes
Femurs from 6-week-old C57BL/6 mice were flushed with PBS using a 1 ml syringe to obtain single cell suspension. After lysis of red blood cells, cells were seeded on a 6-well plate in RPMI1640 medium containing 10% fetal bovine serum. L929 conditioned culture medium were added to 30% of final volume as the sources of macrophage colony-stimulating factor. Cells were cultured with fresh medium every 4 days. On day 7, cells were treated with 20 ng/ml IL-4 or 1 μg/ml LPS for 5 h. For primary adipocyte culture, floating cells from collagenase-digested adipose tissue were washed and spun twice at 1000 rpm for 5 min with KRBH buffer (30). Following 1 h recovery, cells were stimulated with 20 ng/ml IL-4 in KRBH buffer for indicated time, wash twice with cold KRBH buffer (without BSA), and snap-frozen for protein and RNA extractions.
H&E Histology
Adipose tissues were fixed in 4% formaldehyde, embedded in paraffin and sectioned by the Cornell Histology Core Facility. Pictures were taken using the Axiovert 200 m microscope (Zeiss). Cross-sectional area of each adipocyte in each field was measured using image analysis software NIS-Elements D (Nikon) at 10× magnification. For each group, cell sizes of ∼450 adipocytes from 3–4 mice were measured and plotted as histograms.
ELISA
Blood was collected in animals upon 6 h fasting during the day. Circulating insulin and IL-4 levels were measured using the kit from Millipore and eBioscience per supplier's protocols.
Statistical Analysis
Results are expressed as mean ± S.E. Comparisons were made using either unpaired two-tailed Student's t test of the Excel software for two-group comparisons or the one- or two-way ANOVA test with the Bonferroni Post-tests of the PRISM software for multi-group comparisons. p < 0.05 was considered as statistically significant.
RESULTS
The Metabolic and Inflammatory Changes Associated with Acute HFD Feeding
In line with several earlier studies (4–6, 9), short-term 4d HFD feeding of 6-week-old male mice increased body weight by ∼10%, tripled epididymal WAT weight (Fig. 1, A and B) and caused significant adipocyte hypertrophy (Fig. 1, C--E). Although fasting insulin and glucose levels did not change (Fig. 1F), glucose tolerance and insulin sensitivity were impaired with 4d HFD (Fig. 1, G and H).
FIGURE 1.

Metabolic effects of acute 4d HFD feeding. A and B, body (A) and epididymal fat weights (B) of wild type 6-week-old C57BL/6 male mice under HFD (60%) for 4 days, compared with age-matched male mice on LFD (13% fat). n = 12–15 mice with three repeats. C, histology section of adipose tissue. D, measurement of diameters of 450 adipocytes from 3–4 mice on 4d HFD (gray) and age-matched LFD (white). E, Whisker plot of adipocyte diameters. F, serum insulin and glucose levels in WT mice (following a 6 h fast for insulin and 16 h fast for glucose) on 60% HFD for 4 days or 8 weeks, compared with age-matched mice on LFD (13% fat). n = 8–10 mice each, 2 repeats. G and H, GTT and ITT of WT mice on LFD or 4d HFD. n = 15 each cohort, three repeats. Note that glucose intolerance develops within days of HFD feeding. Mice were placed on HFD at the age of 6 weeks. Values represent mean ± S.E. *, p < 0.05; **, p < 0.01; and ***, p < 0.005.
Unexpectedly, 4d HFD feeding not only increased the transcript levels for M1 genes such as Tnfa (tumor necrosis factor a), Il6 (interleukin 6), and Mip1a (macrophage inflammatory protein 1a), but also many M2 genes including Arg1 (arginase 1) and Chi3l3 (chitinase-3 like 3) in adipose tissue (Fig. 2A). This effect was not seen in the liver following 4d HFD feeding (Fig. 2B) or in WAT following 1d HFD challenge (Fig. 2C). In line with the transcript level, Arg1 protein, a key marker of M2 polarization (20), increased 4–6-fold in WAT upon 4d HFD but not 1–2 day nor 2 week HFD feeding (Fig. 2D). Impressively, at the single cell level, the percent of adipose-resident macrophages expressing Arg1 protein was increased by over 50% upon 4d HFD feeding (Fig. 2E). This increase was not due to the accumulation of macrophages as 4d HFD had no effect on macrophage cell number in adipose tissue (supplemental Fig. S1A). Pointing to a tissue-specific effect of 4d HFD, Arg1 protein level was not affected in the liver (supplemental Fig. S1B). Thus, acute 4d HFD feeding increases M2 macrophage polarization and Arg1 expression in adipose tissue.
FIGURE 2.

The effect of acute 4d HFD feeding on macrophage polarization and Arg1 expression in WAT. A, Q-PCR analysis of M1 and M2 genes (purple) in A WAT of 4d HFD or LFD mice (n = 12–15 mice each group, 3 repeats), B in the liver of mice following LFD or 4d HFD (n = 4–5 each cohort), and C in the WAT of mice following LFD or 1d HFD (n = 4–5 each cohort, 2 repeats). D, Western blot analysis of Arg1 protein in WAT of wild type mice and quantitated below. D, n = 4 mice each with two repeats (representative data from one experiment shown). E, flow cytometric analysis of intracellular Arg1 in CD45+ F4/80+ cells from adipose tissue of mice under LFD versus 4d HFD. Percent of positive cells is indicated. Values represent averages of one experiment (n = 6 mice each), two repeats. F, IL-4 ELISA of culture medium of various cell types purified from adipose tissue with purity shown in supplemental Fig. S3. Medium was collected after 12 h in culture. n = 25 mice, two repeats. Values represent mean ± S.E. *, p < 0.05; **, p < 0.01; ***, p < 0.005.
Bias toward M2 polarization can be promoted by immunomodulatory TH2 cytokines such as IL-4 and IL-13 (3). To explore potential underlying mechanisms, we purified three cell types from adipose tissue of 4d HFD mice, NKT cells, eosinophils, and CD4+ T cells with over 74% purity (supplemental Fig. S2). These three cell types are known to secrete TH2 cytokines such as IL-4 and IL-13 (3). Intriguingly, NKT cells secreted 5-fold more IL-4 in vitro than purified CD4+ T cells and eosinophils (Fig. 2F). This observation prompted us to test the hypothesis that NKT cells may be responsible for increased M2 macrophage polarization in adipose tissue following 4d HFD feeding in an IL-4-dependent manner.
Characterization of Type I NKT Cells in Mouse Adipose Tissue
CD1d-restricted NKT cells can be further classified into two main types with the majority being αGalCer-reactive invariant type I while the rest being variant type II NKT cells. Type II NKT cells have been reported in the liver (32), and their function is far less well characterized than the type I cells because of the lack of reliable methods to stain and quantitate this population. Using flow cytometric analysis, we estimated ∼15,000 type I NKT cells per gram epididymal adipose tissue in a 6-week-old lean mouse, about half of CD4+ T cells but 4 times higher than CD8+ T cells (white bars in Fig. 3A). Further analyses of type I NKT cells in adipose tissue revealed a couple of interesting features.
FIGURE 3.
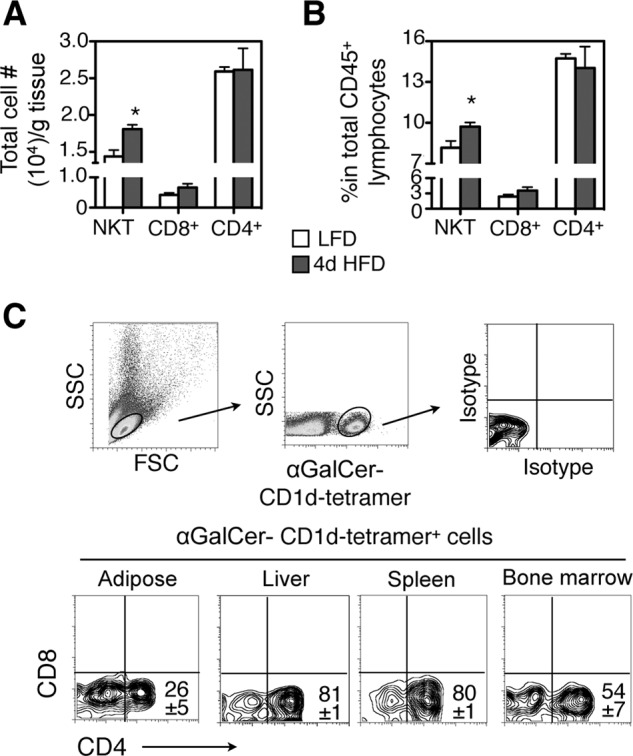
Adipose-resident type I NKT cells increase with 4d HFD and are predominantly CD4−CD8−. Analysis of NKT cells in epididymal adipose tissue of 6-week-old male lean mice. A and B, total number of NKT cells per gram of adipose tissue (A) and percent (B) of NKT cells in total adipose lymphocytes are shown. n = 12 mice with three repeats. C, characterization of cell-surface markers CD4-CD8 of αGalCer-CD1d-tetramer-positive NKT cells from indicated tissues. Numbers in the flow histogram indicate the percent of CD1d-tetramer-positive NKT cells. n = 10–12 mice with at least 4 repeats. Values represent mean ± S.E. *, p < 0.05.
First, unlike the situation under prolong HFD feeding (27, 33), both the proportion and the absolute numbers of type I NKT cells in adipose tissue were increased by ∼20 and 25%, respectively, with 4d HFD challenge (white versus black bars of NKT cells in Fig. 3, A and B). This was not seen in other adipose-resident T cells such as CD4+, CD8+ T cells (Fig. 3, A and B). Second, adipose-resident type I NKT cells were primarily CD4− CD8− with one quarter being CD4+ CD8− (Fig. 3C). In contrast, type I NKT cells in liver and spleen consisted primarily of CD4+ CD8− with a small fraction of double negative CD4− CD8−, and in bone marrow the ratio of CD4+ CD8− to CD4− CD8− type 1 NKT cells was about 1:1 (Fig. 3C). Examination of other activation markers CD44, CD69, and CD25 revealed no differences among type I NKT cells in various tissues as they all were CD44hi CD69+ CD25− (supplemental Fig. S3 and not shown). Taken together, these data suggest that adipose tissues of lean and 4d HFD mice contain primarily CD4− CD8− type I NKT cells.
The Metabolic Effects of NKT Cells upon 4D HFD
To delineate the physiological importance of NKT cells at the onset of obesity, we characterized the metabolic phenotypes of 6-week-old NKT-deficient CD1d−/− mice following 4d HFD. CD1d−/− mice exhibited no difference in comparison to wild type cohorts upon 4d feeding in terms of body weight and fasting insulin levels (Fig. 4, A and B). However, CD1d−/− mice exhibited further deterioration in glucose intolerance (Fig. 4C) and insulin sensitivity (Fig. 4D) after 4d HFD. The CD1d effect on glucose tolerance was dependent on 4d HFD feeding as no effect was observed in age-matched LFD groups at 7 weeks old (Fig. 4E). Thus, loss of NKT cells impairs systemic glucose tolerance and insulin sensitivity upon 4d HFD.
FIGURE 4.

Metabolic phenotypes of CD1d−/− mice with 4d HFD challenge. A, body weight and B, serum insulin level of three cohorts with LFD or 4d HFD feeding followed by a 6 h fasting. n = 8–10 mice per group, two repeats. C and D, GTT and ITT of 4d HFD cohorts. * refers to the p values comparing CD1d−/− HFD to other groups (color-coded). n = 8–10 mice each group, 2 repeats. E, GTT of 7-week-old WT and CD1d−/− mice on LFD. n = 10 mice each, two repeats. Values represent mean ± S.E. *, p < 0.05; **, p < 0.01; ***, p < 0.005.
The Effect of NKT Cells on Adipose Inflammation upon 4D HFD
We next examined the inflammatory status of liver and adipose tissue of CD1d−/− mice following 4d HFD feeding. The induction of many M2 genes in adipose tissue (e.g. Arg1, Chi3l3, and Pdcd1lg2), and to a lesser extent of M1 genes, was dramatically reduced in CD1d−/− mice (Fig. 5A). At the protein level, 4d HFD induced 4-fold increase of Arg1 in WAT in a fully NKT-dependent manner, but not in the liver (Fig. 5, B and C). At the single cell level, loss of NKT cells prevented the increase of Arg1-expressing adipose-resident macrophages (Figs. 5D versus 2E). Thus, our data show that NKT cells are responsible for 4d HFD-induced M2 macrophage polarization and Arg1 expression in adipose tissue.
FIGURE 5.

Loss of NKT cells alters inflammatory responses in adipose tissue with 4d HFD challenge. 6-week-old WT or CD1d−/− mice were placed on LFD or HFD for 4 days. A, Q-PCR analysis of M1 and M2 (purple) genes in the WAT (n = 12–15 mice each group, three repeats). B and C, Western blot analysis of Arg1 expression in WAT (upper) and liver (lower) of WT and CD1d−/− cohorts on either LFD or 4d HFD. n = 3–4 mice each with two repeats. Quantitation shown in C. D, flow cytometric analysis of intracellular Arg1 in CD45+ F4/80+ cells of adipose tissue of CD1d−/− mice under LFD versus 4d HFD. Percent of positive cells is indicated. Values represent averages of one experiment (n = 6 mice each) with two repeats. Values represent mean ± S.E. n.s., not significant; *, p < 0.05 and **, p < 0.01 comparing the two groups or groups included in brackets.
The Effect of NKT Cells on Adipose Inflammation Is Mediated by IL-4
We next investigated possible molecular mechanism underlying the NKT cell effect at 4d HFD. Among NKT signature cytokines IL-4 and IFN-γ, only IL-4 mRNA was doubled upon 4d HFD in an NKT-dependent manner (Fig. 6A). This observation prompted us to determine the importance of IL-4 in adipose tissue. IL-4 treatment of SVC fraction of adipose tissue, not primary adipocytes, stimulated robust tyrosine phosphorylation (p-Y) of its target STAT6 within 1 h (Fig. 6B). Pointing to the specificity of the IL-4 signaling, p-Y of STAT3 was not affected by IL-4 treatment (Fig. 6B). Mouse primary adipocytes expressed STAT3 protein but unexpectedly very little STAT6 protein compared with the SVC fraction (Fig. 6B and supplemental Fig. S4A). However, Stat6 mRNA was readily detectable in mouse primary adipocytes (supplemental Fig. S4B), suggesting a possible post-transcriptional control of STAT6 expression in adipocytes. Treatment of BMDM in vitro with IL-4 significantly increased expression of M2 markers while LPS had the opposite effect (supplemental Fig. S4C).
FIGURE 6.

4d HFD feeding increases IL-4 levels in WAT via NKT cells. A, Q-PCR analysis of IL-4 and IFN-γ mRNA levels following 4d HFD feeding in adipose tissue of WT and CD1d−/− mice (n = 12–15 mice each group, three repeats). B, Western blot analyses of p-Y STAT proteins in IL-4-treated purified primary adipocytes and SVC of adipose tissue from WT mice (two repeats). Values represent mean ± S.E. **, p < 0.01.
The Effect of IL-4 on Adipose Inflammation Following 4D HFD Feeding
In adipose tissue, loss of IL-4 significantly attenuated or abolished the expression of several M2 genes, most notably Arg1, Chi3l3, and Il1rn (IL1 receptor antagonist) (Fig. 7A). The induction of Arg1 protein in adipose tissue at 4d HFD was completely abolished in IL-4−/− mice (Fig. 7B), similar to that in NKT-deficient CD1d−/− mice (Fig. 5, B and C). This was further confirmed at the single cell level using flow cytometry (Figs. 7C versus 2E). Thus, our data revealed that, in response to acute HFD feeding, adipose-resident NKT cells promote M2 macrophage polarization largely via IL-4.
FIGURE 7.

Loss of IL-4 alters inflammatory responses in adipose tissue with 4d HFD challenge. A, Q-PCR analysis of M1 and M2 (purple) genes in the WAT of 4 cohorts (n = 4–5 mice each cohort). B, Western blot analysis of Arg1 expression in WAT of WT and IL-4−/− cohorts on either LFD or 4d HFD with quantitation shown below. n = 3–4 mice each, two repeats. C, flow cytometric analysis of intracellular Arg1 in CD45+ F4/80+ cells of adipose tissue of IL-4−/− mice under LFD versus 4d HFD. Percent of positive cells is indicated. Values represent averages of one experiment (n = 6 mice each), two repeats. Values represent mean ± S.E. *, p < 0.05. D, proposed function of adipose-resident NKT cells in response to acute HFD feeding. Upon acute 4d HFD challenge, NKT cells promote M2 polarization and Arg1 expression via IL-4 in adipose tissue, thereby promoting systemic insulin sensitivity and glucose tolerance.
DISCUSSION
HFD feeding is believed to promote pro-inflammatory responses in adipose tissue, which contributes significantly to the pathogenesis of obesity-associated complications such as atherosclerosis and type 2 diabetes. Interestingly, our data show that acute 4d HFD feeding is associated with elevated M2 polarization and Arg1 expression in adipose tissue, an effect that is mediated by NKT cells in adipose tissue (Fig. 7D). Indeed, NKT cells modulate M2 macrophage polarization in adipose tissue upon acute HFD challenge, thereby exerting a salutary effect on systemic glucose homeostasis and insulin sensitivity. The effect of adipose NKT cells on M2 polarization is largely IL-4-dependent. Thus, our data reveal, for the first time at the cellular level, that immune responses associated with acute HFD challenge are remarkably pronounced and dynamic in adipose tissue.
Short-term or acute HFD leads to glucose intolerance and insulin resistance (4–9). Using clamp studies, Samuel et al. (8) showed that insulin resistance induced by acute 3d HFD feeding is largely due to fat accumulation and insulin resistance in the liver. However, the role of other peripheral tissues such as adipose tissue was unclear. Using microarray analyses, Kleemann et al. (5) recently showed that genes involved in inflammatory responses are decreased in adipose tissues and skeletal muscle, not in the liver, upon 1 week feeding of 45% HFD. In contrast, Lee et al. (9) showed that 3d HFD induces expression of several genes involved in pro-inflammatory responses in adipose tissue. These seemingly contradictory findings highlight the complexity of physiological settings where multiple signaling pathways may be activated by acute HFD. In line with both studies (5, 9), our data show that acute HFD challenge induces both M1 and M2 macrophage polarization in adipose tissue (Fig. 2). Although the mechanism underlying the M1 polarization is currently unclear, our data show that adipose-resident NKT cells are responsible for the elevated M2 macrophage polarization. Although lacking definitive evidence, it is tempting to speculate that the NKT-mediated immunomodulatory effect in WAT following short-term HFD may represent an acute response by the immune system to dampen possible detrimental effects of acute lipid infusion and help the metabolic system adapt to possible long-term HFD feeding. Supporting this hypothesis, our data show that NKT-deficient mice exhibited reduced M2 macrophage polarization and impaired systemic glucose homeostasis and insulin sensitivity during short-term HFD.
Our data demonstrate that adipose-resident NKT cells have important immunomodulatory effect during acute HFD challenge. This is consistent with the known role of NKT cells in lipid sensing (15, 19) and of these cells as early effector cells in immunity (29). The possibility that NKT cells are either directly or indirectly activated by dietary lipids is indeed very exciting and deserves more studies. Our study is especially interesting in light of several recent studies demonstrating the lack of metabolic effect in mice lacking NKT cells following long-term HFD feeding, with 45% HFD for over 26 weeks or 60% for 8–12 weeks (3, 25–27). The lack-of-effect of NKT cells in the loss-of-function mouse model at late stages of obesity is not surprising, in light of the massive infiltration and expansion of other cells such as CD8+ T cells and macrophages (1, 2). Moreover, based on this study, we speculate that NKT activation by acute HFD challenge may be responsible for the apparent lack-of-effect of these cells at late stages of obesity because early activation of immune cells is known to lead to hyporesponsiveness, a process known as “activation-induced anergy” (34). Providing further support to this scenario, we recently showed that upon activation with a strong lipid agonist such as αGalCer, NKT cells do have beneficial metabolic effects even in chronic obesity with 24-week HFD feeding (27).
Using CD1d−/− mice, this study focuses on the role of NKT cells as a whole during acute HFD feeding. NKT cells are a heterogeneous population with type I NKT cells being most abundant and best characterized while the rest being type II NKT cells (35). The role of type II NKT cells remains largely unknown due to the lack of specific analytical tools, although some studies have suggested that a subset of type II NKT cells with reactivity to glycolipid sulfatides may have opposing functions to type I counterparts in some experimental settings such as autoimmunity, liver injury, and asthma (35–37). The role of type II NKT cells in adipose tissue in the context of obesity remains unexplored. Using Jα18−/− (lacking type I NKT cells) and CD1d−/− (lacking both type I and II NKT cells) mice, a recent study suggested that type II NKT cells may play a role in adipose inflammation in chronic obesity (28). However, as the CD1d−/− mice in this study (28) exhibited different metabolic phenotypes as what have been described in three other reports (25–27), further studies are required to establish the role of NKT subpopulations in obesity.
Our study underscores a distinct NKT-mediated TH2 response in adipose tissue upon 4d HFD feeding. Interestingly, NKT cells in adipose tissue have a very strong TH2-biasing effect due to their ability to increase IL-4 signaling. Both NKT and IL-4 deficiencies lead to similar changes in inflammatory gene expression and Arg1 protein levels in WAT and adipose-resident macrophages. The ability of NKT cells to regulate inflammatory responses at the onset of obesity makes them unique among adipose-resident TH2-cytokine-producing cells such as adipocytes, CD4+ T cells, and eosinophils (38, 39). In a screen for IL-4 secreting cell types in adipose tissue using IL-4 reporter mice, Wu et al. (39) reported that nearly 90% of the IL-4 competent cells from perigonadal adipose tissue are eosinophils at 10 days following the infection with migratory helminth Nippostrongylus brasiliensis. It is not surprising that NKT cells were not identified in this study given the nature of NKT cell activation and given the unique design of the study. Indeed, a recent study showed that NKT cells were not activated 5 days post N. brasiliensis infection (40). Further studies are required to delineate whether NKT cells directly contribute to the “IL-4” pool in adipose tissue in obesity.
Our observation that, unlike their hepatic counterparts, adipose-resident NKT cells have TH2-bias effect upon 4d HFD is very intriguing and may be related to the nature of endogenous activating lipids, tissue microenvironment, and/or the unique lineage of NKT cells in adipose tissue (15). Unlike other peripheral tissues, the majority of NKT cells in adipose tissue is CD4− CD8−, and thus may be associated with specific functional changes. Indeed, earlier studies have shown that CD4− CD8− versus CD4+ CD8− NKT cells likely represent functionally separate lineages that may promote different TH response with distinct capacities to secrete TH1 and TH2 cytokines (15, 41–43). Additionally, the difference in NKT cell effect between the liver and adipose tissue upon 4d HFD may reflect a unique microenvironment of adipose tissue in terms of antigen presenting cells and available lipid antigens that activate resident NKT cells. Indeed, it is known that antigen-presenting cells are important factor in NKT cell responses (44–47). Intriguingly, as adipocytes have detectable Cd1d transcripts (supplemental Fig. S4B), they may be able to present lipids to and directly activate adipose-resident NKT cells. Moreover, glycolipids that are available in adipose tissue are likely to be different from those in the liver. It has been reported that NKT cell production of IFN-γ is more susceptible to the sphingosine length of glycolipid ligand than that of IL-4 (48): Glycolipids with shorter sphingosine length bind to CD1d molecules with less affinity and preferentially drive IL-4 production by NKT cells (17, 48). Finally, as NKT cell activation by bacterial lipid antigens may be toll-like receptor 4-dependent and IL-12-mediated (49, 50), it will be interesting to investigate whether this is true for adipose NKT cells.
Supplementary Material
Acknowledgments
We thank Dr. Suzanne Ostrand-Rosenberg (University of Maryland) for sharing the protocol for intracellular Arg1 flow; and Dr. Sander Kersten (Wageningen University) and other members of the Qi laboratory for technical assistance and insightful discussions. We are very grateful to the NIH Tetramer Facility (Emory University) for generous supply of the αGalCer-loaded CD1d tetramers.
This study was funded, in whole or in part, by National Institutes of Health NIDDK R01DK082582 and R01DK082582-S1 (to L. Q.) and American Diabetes Association (ADA) Grants 7-08-JF-47 and 1-12-CD-04.

This article contains supplemental Figs. S1–S4 and Tables S1 and S2.
- HFD
- high fat diet
- d
- day
- α-GalCer
- α-galactosylceramide
- NKT
- Natural Killer T
- SVC
- stromal vascular cells
- WAT
- white adipose tissues
- LFD
- low fat diet.
REFERENCES
- 1. Olefsky J. M., Glass C. K. (2010) Macrophages, inflammation, and insulin resistance. Annu. Rev. Physiol. 72, 219–246 [DOI] [PubMed] [Google Scholar]
- 2. Donath M. Y., Shoelson S. E. (2011) Type 2 diabetes as an inflammatory disease. Nat. Rev. Immunol. 11, 98–107 [DOI] [PubMed] [Google Scholar]
- 3. Sun S., Ji Y., Kersten S., Qi L. (2012) Mechanisms of Inflammatory Responses in Obese Adipose Tissue. Annu. Rev. Nutr., in press [DOI] [PMC free article] [PubMed] [Google Scholar]
- 4. Li J., Yu X., Pan W., Unger R. H. (2002) Gene expression profile of rat adipose tissue at the onset of high-fat-diet obesity. Am. J. Physiol. Endocrinol. Metab 282, E1334–1341 [DOI] [PubMed] [Google Scholar]
- 5. Kleemann R., van Erk M., Verschuren L., van den Hoek A. M., Koek M., Wielinga P. Y., Jie A., Pellis L., Bobeldijk-Pastorova I., Kelder T., Toet K., Wopereis S., Cnubben N., Evelo C., van Ommen B., Kooistra T. (2010) Time-resolved and tissue-specific systems analysis of the pathogenesis of insulin resistance. PLoS ONE 5, e8817. [DOI] [PMC free article] [PubMed] [Google Scholar]
- 6. Posey K. A., Clegg D. J., Printz R. L., Byun J., Morton G. J., Vivekanandan-Giri A., Pennathur S., Baskin D. G., Heinecke J. W., Woods S. C., Schwartz M. W., Niswender K. D. (2009) Hypothalamic proinflammatory lipid accumulation, inflammation, and insulin resistance in rats fed a high-fat diet. Am. J. Physiol. Endocrinol. Metab. 296, E1003–E1012 [DOI] [PMC free article] [PubMed] [Google Scholar]
- 7. Kraegen E. W., Clark P. W., Jenkins A. B., Daley E. A., Chisholm D. J., Storlien L. H. (1991) Development of muscle insulin resistance after liver insulin resistance in high-fat-fed rats. Diabetes 40, 1397–1403 [DOI] [PubMed] [Google Scholar]
- 8. Samuel V. T., Liu Z. X., Qu X., Elder B. D., Bilz S., Befroy D., Romanelli A. J., Shulman G. I. (2004) Mechanism of hepatic insulin resistance in non-alcoholic fatty liver disease. J. Biol. Chem. 279, 32345–32353 [DOI] [PubMed] [Google Scholar]
- 9. Lee Y. S., Li P., Huh J. Y., Hwang I. J., Lu M., Kim J. I., Ham M., Talukdar S., Chen A., Lu W. J., Bandyopadhyay G. K., Schwendener R., Olefsky J., Kim J. B. (2011) Inflammation Is Necessary for Long-Term but Not Short-Term High-Fat Diet-Induced Insulin Resistance. Diabetes 60, 2474–2483 [DOI] [PMC free article] [PubMed] [Google Scholar]
- 10. Cerundolo V., Silk J. D., Masri S. H., Salio M. (2009) Harnessing invariant NKT cells in vaccination strategies. Nat. Rev. Immunol. 9, 28–38 [DOI] [PubMed] [Google Scholar]
- 11. Bendelac A., Lantz O., Quimby M. E., Yewdell J. W., Bennink J. R., Brutkiewicz R. R. (1995) CD1 recognition by mouse NK1+ T lymphocytes. Science 268, 863–865 [DOI] [PubMed] [Google Scholar]
- 12. Bendelac A. (1995) Positive selection of mouse NK1+ T cells by CD1-expressing cortical thymocytes. J. Exp. Med. 182, 2091–2096 [DOI] [PMC free article] [PubMed] [Google Scholar]
- 13. Kawano T., Cui J., Koezuka Y., Toura I., Kaneko Y., Motoki K., Ueno H., Nakagawa R., Sato H., Kondo E., Koseki H., Taniguchi M. (1997) CD1d-restricted and TCR-mediated activation of vα14 NKT cells by glycosylceramides. Science 278, 1626–1629 [DOI] [PubMed] [Google Scholar]
- 14. Yoshimoto T., Bendelac A., Watson C., Hu-Li J., Paul W. E. (1995) Role of NK1.1+ T cells in a TH2 response and in immunoglobulin E production. Science 270, 1845–1847 [DOI] [PubMed] [Google Scholar]
- 15. Bendelac A., Savage P. B., Teyton L. (2007) The biology of NKT cells. Annu. Rev. Immunol. 25, 297–336 [DOI] [PubMed] [Google Scholar]
- 16. Berzins S. P., Smyth M. J., Baxter A. G. (2011) Presumed guilty: natural killer T cell defects and human disease. Nat. Rev. Immunol. 11, 131–142 [DOI] [PubMed] [Google Scholar]
- 17. Miyamoto K., Miyake S., Yamamura T. (2001) A synthetic glycolipid prevents autoimmune encephalomyelitis by inducing TH2 bias of natural killer T cells. Nature 413, 531–534 [DOI] [PubMed] [Google Scholar]
- 18. Bai L., Sagiv Y., Liu Y., Freigang S., Yu K. O., Teyton L., Porcelli S. A., Savage P. B., Bendelac A. (2009) Lysosomal recycling terminates CD1d-mediated presentation of short and polyunsaturated variants of the NKT cell lipid antigen α-GalCer. Proc. Natl. Acad. Sci. U.S.A. 106, 10254–10259 [DOI] [PMC free article] [PubMed] [Google Scholar]
- 19. Kronenberg M. (2005) Toward an understanding of NKT cell biology: progress and paradoxes. Annu. Rev. Immunol. 23, 877–900 [DOI] [PubMed] [Google Scholar]
- 20. Gordon S., Martinez F. O. (2010) Alternative activation of macrophages: mechanism and functions. Immunity 32, 593–604 [DOI] [PubMed] [Google Scholar]
- 21. Bensinger S. J., Tontonoz P. (2008) Integration of metabolism and inflammation by lipid-activated nuclear receptors. Nature 454, 470–477 [DOI] [PubMed] [Google Scholar]
- 22. Lumeng C. N., Bodzin J. L., Saltiel A. R. (2007) Obesity induces a phenotypic switch in adipose tissue macrophage polarization. J. Clin. Invest. 117, 175–184 [DOI] [PMC free article] [PubMed] [Google Scholar]
- 23. Odegaard J. I., Ricardo-Gonzalez R. R., Red Eagle A., Vats D., Morel C. R., Goforth M. H., Subramanian V., Mukundan L., Ferrante A. W., Chawla A. (2008) Alternative M2 activation of Kupffer cells by PPARδ ameliorates obesity-induced insulin resistance. Cell Metab. 7, 496–507 [DOI] [PMC free article] [PubMed] [Google Scholar]
- 24. Odegaard J. I., Ricardo-Gonzalez R. R., Goforth M. H., Morel C. R., Subramanian V., Mukundan L., Red Eagle A., Vats D., Brombacher F., Ferrante A. W., Chawla A. (2007) Macrophage-specific PPARγ controls alternative activation and improves insulin resistance. Nature 447, 1116–1120 [DOI] [PMC free article] [PubMed] [Google Scholar]
- 25. Kotas M. E., Lee H. Y., Gillum M. P., Annicelli C., Guigni B. A., Shulman G. I., Medzhitov R. (2011) Impact of CD1d deficiency on metabolism. PLoS ONE 6, e25478. [DOI] [PMC free article] [PubMed] [Google Scholar]
- 26. Mantell B. S., Stefanovic-Racic M., Yang X., Dedousis N., Sipula I. J., O'Doherty R. M. (2011) Mice lacking NKT cells but with a complete complement of CD8 T-cells are not protected against the metabolic abnormalities of diet-induced obesity. PLoS ONE 6, e19831. [DOI] [PMC free article] [PubMed] [Google Scholar]
- 27. Ji Y., Sun S., Xu A., Bhargava P., Yang L., Lam K. S., Gao B., Lee C. H., Kersten S., Qi L. (2012) Activation of natural killer T cells promotes M2 macrophage polarization in adipose tissue and improves systemic glucose tolerance via interleukin-4 (IL-4)/STAT6 protein signaling axis in obesity. J. Biol. Chem. 287, 13561–13571 [DOI] [PMC free article] [PubMed] [Google Scholar]
- 28. Satoh M., Andoh Y., Clingan C. S., Ogura H., Fujii S., Eshima K., Nakayama T., Taniguchi M., Hirata N., Ishimori N., Tsutsui H., Onoe K., Iwabuchi K. (2012) Type II NKT cells stimulate diet-induced obesity by mediating adipose tissue inflammation, Steatohepatitis and insulin resistance. PLoS ONE 7, e30568. [DOI] [PMC free article] [PubMed] [Google Scholar]
- 29. Stetson D. B., Mohrs M., Reinhardt R. L., Baron J. L., Wang Z. E., Gapin L., Kronenberg M., Locksley R. M. (2003) Constitutive cytokine mRNAs mark natural killer (NK) and NK T cells poised for rapid effector function. J. Exp. Med. 198, 1069–1076 [DOI] [PMC free article] [PubMed] [Google Scholar]
- 30. Xia S., Sha H., Yang L., Ji Y., Ostrand-Rosenberg S., Qi L. (2011) Gr-1+ CD11b+ myeloid-derived suppressor cells suppress inflammation and promote insulin sensitivity in obesity. J. Biol. Chem. 286, 23591–23599 [DOI] [PMC free article] [PubMed] [Google Scholar]
- 31. Sha H., He Y., Chen H., Wang C., Zenno A., Shi H., Yang X., Zhang X., Qi L. (2009) The IRE1α-XBP1 pathway of the unfolded protein response is required for adipogenesis. Cell Metab. 9, 556–564 [DOI] [PMC free article] [PubMed] [Google Scholar]
- 32. Godfrey D. I., Stankovic S., Baxter A. G. (2010) Raising the NKT cell family. Nat. Immunol. 11, 197–206 [DOI] [PubMed] [Google Scholar]
- 33. Lynch L., O'Shea D., Winter D. C., Geoghegan J., Doherty D. G., O'Farrelly C. (2009) Invariant NKT cells and CD1d(+) cells amass in human omentum and are depleted in patients with cancer and obesity. Eur. J. Immunol. 39, 1893–1901 [DOI] [PubMed] [Google Scholar]
- 34. MacDonald H. R., Lees R. K., Baschieri S., Herrmann T., Lussow A. R. (1993) Peripheral T-cell reactivity to bacterial superantigens in vivo: the response/anergy paradox. Immunol. Rev. 133, 105–117 [DOI] [PubMed] [Google Scholar]
- 35. Gao B., Radaeva S., Park O. (2009) Liver natural killer and natural killer T cells: immunobiology and emerging roles in liver diseases. J. Leukoc Biol. 86, 513–528 [DOI] [PMC free article] [PubMed] [Google Scholar]
- 36. Zhang G., Nie H., Yang J., Ding X., Huang Y., Yu H., Li R., Yuan Z., Hu S. (2011) Sulfatide-activated type II NKT cells prevent allergic airway inflammation by inhibiting type I NKT cell function in a mouse model of asthma. Am. J. Physiol.. Lung Cell. Mol. Physiol. 301, L975–L984 [DOI] [PubMed] [Google Scholar]
- 37. Halder R. C., Aguilera C., Maricic I., Kumar V. (2007) Type II NKT cell-mediated anergy induction in type I NKT cells prevents inflammatory liver disease. J. Clin. Invest. 117, 2302–2312 [DOI] [PMC free article] [PubMed] [Google Scholar]
- 38. Kang K., Reilly S. M., Karabacak V., Gangl M. R., Fitzgerald K., Hatano B., Lee C. H. (2008) Adipocyte-derived Th2 cytokines and myeloid PPARδ regulate macrophage polarization and insulin sensitivity. Cell Metab. 7, 485–495 [DOI] [PMC free article] [PubMed] [Google Scholar]
- 39. Wu D., Molofsky A. B., Liang H. E., Ricardo-Gonzalez R. R., Jouihan H. A., Bando J. K., Chawla A., Locksley R. M. (2011) Eosinophils sustain adipose alternatively activated macrophages associated with glucose homeostasis. Science 332, 243–247 [DOI] [PMC free article] [PubMed] [Google Scholar]
- 40. Neill D. R., Wong S. H., Bellosi A., Flynn R. J., Daly M., Langford T. K., Bucks C., Kane C. M., Fallon P. G., Pannell R., Jolin H. E., McKenzie A. N. (2010) Nuocytes represent a new innate effector leukocyte that mediates type-2 immunity. Nature 464, 1367–1370 [DOI] [PMC free article] [PubMed] [Google Scholar]
- 41. Lee P. T., Benlagha K., Teyton L., Bendelac A. (2002) Distinct functional lineages of human V(alpha)24 natural killer T cells. J. Exp. Med. 195, 637–641 [DOI] [PMC free article] [PubMed] [Google Scholar]
- 42. Benlagha K., Kyin T., Beavis A., Teyton L., Bendelac A. (2002) A thymic precursor to the NK T cell lineage. Science 296, 553–555 [DOI] [PubMed] [Google Scholar]
- 43. Pellicci D. G., Hammond K. J., Uldrich A. P., Baxter A. G., Smyth M. J., Godfrey D. I. (2002) A natural killer T (NKT) cell developmental pathway involving a thymus-dependent NK1.1(-)CD4(+) CD1d-dependent precursor stage. J. Exp. Med. 195, 835–844 [DOI] [PMC free article] [PubMed] [Google Scholar]
- 44. Wu D., Xing G. W., Poles M. A., Horowitz A., Kinjo Y., Sullivan B., Bodmer-Narkevitch V., Plettenburg O., Kronenberg M., Tsuji M., Ho D. D., Wong C. H. (2005) Bacterial glycolipids and analogs as antigens for CD1d-restricted NKT cells. Proc. Natl. Acad. Sci. U.S.A. 102, 1351–1356 [DOI] [PMC free article] [PubMed] [Google Scholar]
- 45. Bezbradica J. S., Stanic A. K., Matsuki N., Bour-Jordan H., Bluestone J. A., Thomas J. W., Unutmaz D., Van Kaer L., Joyce S. (2005) Distinct roles of dendritic cells and B cells in Va14Ja18 natural T cell activation in vivo. J. Immunol. 174, 4696–4705 [DOI] [PubMed] [Google Scholar]
- 46. Zajonc D. M., Maricic I., Wu D., Halder R., Roy K., Wong C. H., Kumar V., Wilson I. A. (2005) Structural basis for CD1d presentation of a sulfatide derived from myelin and its implications for autoimmunity. J. Exp. Med. 202, 1517–1526 [DOI] [PMC free article] [PubMed] [Google Scholar]
- 47. Bai L., Constantinides M. G., Thomas S. Y., Reboulet R., Meng F., Koentgen F., Teyton L., Savage P. B., Bendelac A. (2012) Distinct APCs explain the cytokine bias of α-galactosylceramide variants in vivo. J. Immunol. 188, 3053–3061 [DOI] [PMC free article] [PubMed] [Google Scholar]
- 48. Oki S., Chiba A., Yamamura T., Miyake S. (2004) The clinical implication and molecular mechanism of preferential IL-4 production by modified glycolipid-stimulated NKT cells. J. Clin. Invest. 113, 1631–1640 [DOI] [PMC free article] [PubMed] [Google Scholar]
- 49. Brigl M., Bry L., Kent S. C., Gumperz J. E., Brenner M. B. (2003) Mechanism of CD1d-restricted natural killer T cell activation during microbial infection. Nat. Immunol. 4, 1230–1237 [DOI] [PubMed] [Google Scholar]
- 50. Brigl M., Tatituri R. V., Watts G. F., Bhowruth V., Leadbetter E. A., Barton N., Cohen N. R., Hsu F. F., Besra G. S., Brenner M. B. (2011) Innate and cytokine-driven signals, rather than microbial antigens, dominate in natural killer T cell activation during microbial infection. J. Exp. Med. 208, 1163–1177 [DOI] [PMC free article] [PubMed] [Google Scholar]
Associated Data
This section collects any data citations, data availability statements, or supplementary materials included in this article.