

Abstract
Large amplitude slow waves are characteristic for the summary brain activity, recorded as electroencephalogram (EEG) or local field potentials (LFP), during deep stages of sleep and some types of anesthesia. Slow rhythm of the synchronized EEG reflects an alternation of active (depolarized, UP) and silent (hyperpolarized, DOWN) states of neocortical neurons. In neurons, involvement in the generalized slow oscillation results in a long-range synchronization of changes of their membrane potential as well as their firing. Here, we aimed at intracellular analysis of details of this synchronization. We asked which components of neuronal activity exhibit long-range correlations during the synchronized EEG? To answer this question, we made simultaneous intracellular recordings from two to four neocortical neurons in cat neocortex. We studied how correlated is the occurrence of active and silent states, and how correlated are fluctuations of the membrane potential in pairs of neurons located close one to the other or separated by up to 13 mm. We show that strong long-range correlation of the membrane potential was observed only (i) during the slow oscillation but not during periods without the oscillation, (ii) during periods which included transitions between the states but not during within-the-state periods, and (iii) for the low-frequency (<5 Hz) components of membrane potential fluctuations but not for the higher-frequency components (>10 Hz). In contrast to the neurons located several millimeters one from the other, membrane potential fluctuations in neighboring neurons remain strongly correlated during periods without slow oscillation. We conclude that membrane potential correlation in distant neurons is brought about by synchronous transitions between the states, while activity within the states is largely uncorrelated. The lack of the generalized fine-scale synchronization of membrane potential changes in neurons during the active states of slow oscillation may allow individual neurons to selectively engage in short living episodes of correlated activity—a process that may be similar to dynamical formation of neuronal ensembles during activated brain states.
Keywords: intracellular recording, cat, sleep, synchrony
Introduction
Large amplitude waves in the electroencephalogram (EEG) occurring at low frequency are characteristic of deep stages of sleep (Blake and Gerard, 1937; Niedermeyer and Lopes da Silva, 2005). Pioneering work of Steriade et al. (1993a, b,c) revealed the cellular basis of the large waves that are encountered about once per second. The slow oscillation in the gross electrical signals of the brain, EEG, or local field potentials (LFP) is produced by correlated changes of the membrane potential in neocortical cells, which alternates between depolarized and hyperpolarized states (Contreras and Steriade, 1995; Steriade et al., 1993a,b,c, 2001; Timofeev and Steriade, 1996; Timofeev et al., 2001). This pattern of activity is illustrated in Fig. 1, which shows traces of the membrane potential in a neocortical neuron, LFP, and electromyogram (EMG) recorded in a cat during slow-wave sleep and a transition to a wake state. During slow-wave sleep, both membrane potential and LFP exhibit large amplitude and slow fluctuations (Fig. 1b). In the neuron, depolarized states, that are also called UP or active states, are characterized by high-frequency fluctuations of the membrane potential reflecting vigorous synaptic activity in the thalamo-cortical network and neuronal firing. During hyperpolarized states, called also DOWN or silent states, membrane potential of neurons is 10–20 mV more hyperpolarized than during an UP state and shows little fluctuations which indicate little or absent synaptic activity in the network. No action potentials are generated during DOWN states. This pattern of regularly alternating active and silent states is clearly different from the activity pattern during a wake state (Fig. 1a and b). In a wake state of the brain, membrane potential of neurons stays at depolarized level and fluctuates at high frequencies, leading to generation of irregular sequences of action potentials. Irregular synaptic activity and spiking of neuronal populations produce an irregular pattern of small amplitude, high-frequency fluctuations in the LFP. This pattern of irregular neuronal activity and LFP is also characteristic for the rapid-eye-movement (REM) stage of sleep, making it clearly distinguishable from the slow-wave sleep (Fig. 1c).
Fig. 1.

Patterns of electric activity in cat neocortex during different states of vigilance: slow-wave sleep (SWS), wake, and rapid-eye-movement (REM) sleep. (a) Membrane potential, local filed potential (LFP), and electromyogram (EMG) recorded during a transition from natural slow-wave sleep to wakefulness in a cat. Oblique arrows show EMG activation at awaking. (b) Portions of the membrane potential and LFP traces from (a) during slow-wave sleep and wakefulness at expanded time scale. (c) Membrane potential and LFP traces during natural SWS and REM sleep in a cat. Modified, with permission from Mukovski et al. (2007) and Volgushev et al. (2008).
During slow-wave sleep, large amplitude waves can be recorded over the whole neocortex of sleeping cats and humans (Amzica and Steriade, 1995a,b; Massimini et al., 2004; Niedermeyer and Lopes da Silva, 2005). Since the onset time of the slow waves recorded at different locations is similar, slow oscillation results in a highly synchronized alternation of activity and silence in the whole cortical network. Because of the large-scale synchronization of summary electric activity of the brain, the EEG pattern during slow-wave sleep is traditionally referred to as synchronized EEG, in contrast to a “desynchronized” or activated EEG during wakefulness or REM sleep (Niedermeyer and Lopes da Silva, 2005). An overall synchronization of summary electric activity and membrane potential changes in cells is expressed as strong crosscorrelation of EEG (and LFP) signals recorded over large distances as well as correlated firing of neurons and changes of membrane potential in closely and distantly located neurons (Amzica and Steriade, 1995a,b). Here, we aimed at intracellular analysis of this synchronization in neocortical neurons located close one to the other or separated by up to 13 mm. We asked, what is synchronous in neurons during the synchronized EEG? To answer this question, we studied how correlated is the occurrence of UP and DOWN states, and how correlated are the membrane potential fluctuations in neurons. Specifically, in pairs of simultaneously recorded neurons we analyzed: (i) the distance-dependence of the cooccurrence of UP (or DOWN) states, (ii) the strength of correlation and a shift of peak on the crosscorrelogram, (iii) the dynamics of the correlation—if and how does the correlation change in the course of the slow oscillation, and (iv) the contribution of different components of membrane potential fluctuations to the overall correlation of neuron activity.
Methods: simultaneous intracellular recording from neocortical neurons
To address detailed properties of the membrane potential correlations during slow oscillation, we made simultaneous recordings of LFP and intra-cellular activity of two to four neurons in cat neocortex.
All experiments were carried out in accordance with the NIH Guide for the Care and Use of Laboratory Animals (NIH publication no. 86–23, revised 1987) and were approved by the Committee for Animal Care of Laval University.
Preparation, experiments in anesthetized animals
For acute experiments, adult cats of both sexes (N=19) were anesthetized with ketamine and xylazine (10–15 and 2–3 mg/kg, i.m., respectively). All pressure points and the tissues to be incised were infiltrated with lidocaine (0.5%). Throughout the experiment animals, a sleep-like state of an animal was ascertained by continuous recording of the EEG and maintained by administering additional doses of ketamine (5 mg/kg). The animals were paralyzed with gallamine triethiodide and artificially ventilated, maintaining the end-tidal CO2 concentration at 3.5–3.8%. The body temperature was monitored by a rectal probe and maintained at 37 °C via a feedback-controlled heating pad. The heart rate was continuously monitored (90–110 beats/min). The stability of intracellular recordings was ensured by cisternal drainage, bilateral pneumothorax, hip suspension, and by filling the hole made for recordings with a solution of 4% agar. At the end of experiments, the cats were given a lethal dose of pentobarbital (50 mg/kg, i.v.).
Preparation, experiments in nonanesthetized animals
Experiments on nonanesthetized animals were conducted on two adult cats, chronically implanted as previously described (Timofeev et al., 2001). Surgical procedures for chronic implantation of recording electrodes were carried out under deep barbiturate anesthesia (Somnotol, 35 mg/kg, i.p.), followed by two to three administrations of analgesic (buprenorphine, 0.03 mg/kg, i.m., every 12 h) to prevent pain. Penicillin (500,000 units, i.m.) was injected during three consecutive days. During the surgery, electrodes for recording electrooculogram (EOG), EMG from neck muscles, and intracortical EEG were implanted. A chamber allowing the intracellular penetrations of micropipettes was placed over neocortical areas 5 and 7. The electrodes and recording chamber were fixed on the scull using acrylic dental cement.
Recording
LFP were recorded in the vicinity of impaled neurons and/or from more distant sites using tungsten electrodes. Intracellular recordings were performed using glass micropipettes filled with a solution of 2.5 M potassium acetate (KAc). Neurons were recorded throughout the cortical thickness. All electrical signals were sampled at 20 kHz and digitally stored on Vision (Nicolet, Wisconsin, USA). Offline data analysis was done with custom written MATLAB (The MathWorks, Inc.) programs. Further details of experimental techniques can be found in Chauvette et al. (2010), Timofeev et al. (2001), Volgushev et al. (2006).
Dual, triple, or quadruple intracellular recordings were made in the suprasylvian gyrus, from neurons located either close one to the other, with <0.3-mm horizontal separation or separated by distances up to ~12–13 mm. Figure 2 illustrates an example of simultaneous intracellular recording from four neurons. Recording sites were located along the suprasylvian gyrus and separated by ~4 mm one from the other. Figure 2a (top) shows in-scale position of the recording sites A–D along the gyrus, and the morphology of four simultaneously recorded neurons which were labeled with neurobiotin during the recording. Neurons recorded at locations A and C had typical pyramidal morphology with an apical dendrite extending toward the cortical surface (Fig. 2a, zoom-in). Neurons recorded at locations B and D had nonpyramidal morphology. Numerous spines were present on the dendrites of all four neurons in Fig. 2 (not shown), indicating that all these cells were excitatory. In the experiments with simultaneous intracellular recording from several neurons, we used ketamine–xylazine anesthesia, which reliably induces slow oscillation with activity pattern similar to that during the slow-wave sleep (Chauvette and Timofeev, 2009; Chauvette et al., 2007, 2010 also compare to Fig. 1). Figure 2b shows membrane potential traces of the four neurons from Fig. 2a (same color code) and LFP. The recordings show a typical pattern of the slow oscillation: large amplitude slow waves in the LFP and large amplitude slow fluctuation of the membrane potential. The pattern of membrane potential changes is strikingly similar in all four neurons, including cells located 8 or 12 mm apart one from the other, indicating the generalized nature of the slow oscillation. These results are consistent with earlier reports on long-range synchronization of EEG, LFP, and neuronal firing during slow oscillation (Amzica and Steriade, 1995a,b; Bullock et al., 1995; Massimini et al., 2004), as well as on the tight relation between slow oscillation of summary signals and membrane potential changes in neocortical neurons (Contreras and Steriade, 1995; Steriade et al., 1993b,c; Timofeev and Steriade, 1996). To assess quantitatively the synchronization of membrane potential changes in pairs of simultaneously recorded neurons, we compared the onset times and overlap of the active (or silent) states and made correlation analysis of membrane potential traces.
Fig. 2.

Experimental setup: simultaneous recording of intracellular activity in four neurons and LFP in cat neocortex during slow oscillation. Ketamine-xylazine anesthesia. (a) Location and morphology of four simultaneously recorded neurons. Recording electrodes were positioned at ~4-mm intervals along the suprasylvian gyrus, in areas 5, 7, and 21, as schematically shown in the inset. Reconstructed morphology of four simultaneously recorded neurons is shown in-scale with recording locations (a–d) in the upper panel and at an expanded scale below the inset. All four simultaneously recorded neurons were excitatory, as judged by the presence of spines on their dendrites. Cells recorded at locations A and C were pyramids; cells at locations B and D had nonpyramidal morphology. (b) Membrane potential traces of the four cells share the same color code as in (a), and simultaneously recorded LFP. Modified, with permission from Volgushev et al. (2006).
Detection of active and silent states
We have used two approaches to detect and segregate active (UP) and silent (DOWN) states (Volgushev et al., 2006). In the first approach, we used two levels of the membrane potential, placed at equal distances between the peaks of bimodal membrane potential distribution that was typical for slow oscillation (Fig. 3a). Membrane potential levels were used as thresholds for detecting the states. Periods when the membrane potential was more depolarized than the upper level (green horizontal line in Fig. 3a) were considered as active states, and periods when the membrane potential was more hyperpolarized than the lower level (red line in Fig. 3a) were considered as silent states. Processing of the results of the formal initial detection included merging of two level crossing periods of the same sign if they were separated by <40 ms, and elimination of those lasting <40 ms. These procedures allowed to largely avoid disturbances of the detection results by transient membrane potential peaks. For the example presented in Fig. 3a, active and silent states detected using the threshold method are shown below (silent states, red brackets) and above (active states, green brackets) the membrane potential traces.
Fig. 3.
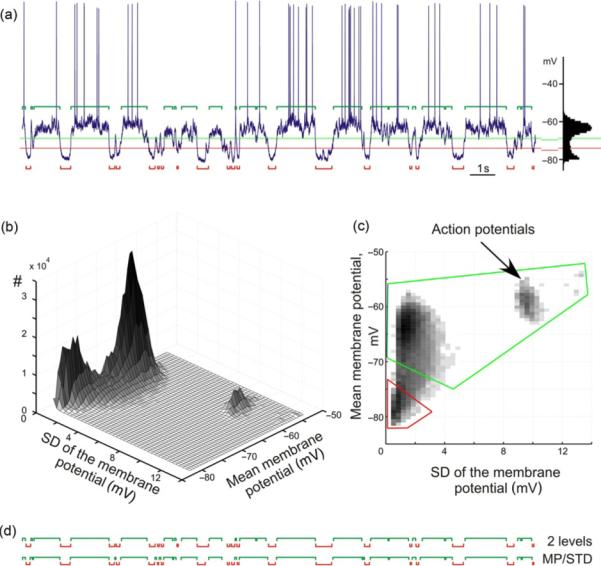
Two methods of state detection in membrane potential traces. (a) Detection of active and silent states using membrane potential levels. Membrane potential trace of a neuron with a clearly bimodal distribution of membrane potential values, typical for slow oscillation. Levels for detection of active states (green) and silent states (red) were placed at equal distances from the peaks of bimodal distribution. Detected states are shown above (acitve states, green) and below (silent states, red) the membrane potential trace. (b, c) Detection of states using a combination of mean values and SD of membrane potential in a running window. Mean value of the membrane potential in a running window of 25 ms were used as x-coordinates, the SD as y-coordinate, and the frequency of occurrence as z-coordinate of a three-dimensional plot (b); (c) illustrates a top view on this plot, with regions used for detection of active (delimited green) and silent (red) states. (d) Comparison of the sequence of active and silent states detected with the two methods. Modified, with permission, from Volgushev et al. (2008).
In the second approach, we exploited the fact that during active states not only the membrane potential is more depolarized, but it also exhibits stronger high-frequency fluctuations than during silent states. To quantify these two measures, we run a window of 25 ms length on the traces and calculated the membrane potential mean and its standard deviation (SD) in each window. A three-dimensional occurrence distribution of the calculated values (Fig. 3b and c) shows clear peaks at hyperpolarized membrane potential with low SD, which corresponds to silent states and at more depolarized membrane potential with higher SD, corresponding to the active states. A separate small peak at depolarized membrane potential and very high SD values (~9–13 mV) represents windows with action potentials. Next, we delimited two regions that included the peaks corresponding to active and silent states, and classified the data points within these regions as active or silent states, respectively. Similar after-processing routines (merging the same-sign states separated by <40 ms, and deleting the states shorter than 40 ms) were then used to finalize the state detection. Although detection of states using either of the two approaches, the level based and the mean–SD based gave usually similar results (Fig. 3d), the results of the mean–SD detection corresponded better to the expert assessment of states (see Volgushev et al., 2006) and were therefore used for the following analyses.
Correlated occurrence of active and silent states in neocortical neurons during slow oscillation
Having detected the active and silent states, we can now compare the onset times and overlap of the states in simultaneously recorded neurons. Figure 4a illustrates an example of quadruple intracellular and LFP recording, together with active and silent states detected in each neuron and labeled with green (active) and red (silent) brackets below each trace. Similarity of the pattern of state alternations in all four simultaneously recorded neurons and in the LFP stands out clearly both in a short example period (Fig. 4a), as well as during a longer period (Fig. 4b). Most often, the states occurred simultaneously in all recorded neurons. To quantify this relation, we have calculated the overlap between active states in pairs of neurons as follows. We calculated the time during which both cells in a pair were simultaneously in the active state and for each cell expressed this time as percent of total time this cell spent in the active state. The same procedure was used to calculate the overlap of silent states. Simultaneously recorded neurons expressed a high degree of state overlap, with a similar pattern of distance-dependence for active states and for silent states (Fig. 4c). The overlap was maximal in neighboring neurons, which were separated one from the other by <0.3 mm in the horizontal plane (78±14% for active states, and 80±15% for silent states, n=124; here and throughout the text, mean±SD are given). With the distance between cells in a pair increasing to 4 mm, the overlap decreased slightly (70±16% for active states, 67±16% for silent states, n=126) and then leveled off for the cells separated by 8 or 12 mm (70±16%, n=64 and 71±16%, n=34 for active states, and 67±17% and 67±15% for silent states). These quantitative results substantiate the visual observation of similarity of the patterns of active and silent state alternation in the membrane potential of simultaneously recorded neurons. Notably, the occurrence of states remained highly correlated even in cells located up to ~12–13 mm apart, which was the largest separation of recording sites in this study.
Fig. 4.

Long-range synchronization of active and silent states in neocortical neurons during slow oscillation. (a) Traces of the membrane potential of four neurons (a–d) and LFP recorded simultaneously in cat neocortex during slow oscillation. Active and silent states are indicated below each trace. Inset shows schematic position of four intracellular recording electrodes. (b) Sequences of state changes in simultaneously recorded cells and LFP. Note the similarity of the pattern of state changes in all four cells separated by up to 12 mm and the LFP. (c) Overlap of active (or silent) states in cell pairs plotted against the separation between two cells in a pair. Overlap was calculated in percent, as a portion of time during which two cells were simultaneously in the same state, relative to the total time a cell spent in that state. Note that the state overlap remains high even in the cells separated by up to 12 mm. Each point represents data for one cell. For <0.3-mm separation n=124 cells, for 4 mm n=126, for 8 mm n=64, and for 12 mm n=34. (d) Delay of the onset of active (or silent) states in cell pairs plotted against the distance between two cells. For <0.3-mm separation n=62 pairs, for 4 mm n=63, for 8 mm n=32, and for 12 mm n=17. In each pair, a more anteriorly located cell was taken as a reference. Note that at distances of 8- and 12-mm active states have a tendency to occur later in more posteriorly located cells, but this tendency is absent for the silent states.
Analysis of the delays of state onset in cell pairs revealed a difference between active and silent states (Fig. 4d). Onsets of states in a more anterior cell in a pair were always used as reference, relative to which the time of state onsets in a more posteriorly located cell in a pair were calculated. For active states, no systematic delay of the onset was found for neurons separated by 4 mm (1.4±9 ms, n=63 pairs). However, in pairs of neurons separated by 8 or 12 mm, active states had a clear tendency to begin later in more posteriorly located neurons than in anteriorly located cells. The averaged delay was 7.8±7.8 ms (n=32 pairs) for 8 mm separation and 7.1±5.9 ms (n=17 pairs) for 12 mm separation between two neurons in a pair. These results are consistent with two previously suggested hypotheses on the origin of active states in neocortical networks. Cases when no or little delay of active state onset was observed between cells in a pair support the hypothesis on the origin of activity at different loci with subsequent synchronization (Massimini et al., 2004; Timofeev et al., 2000a,b). Cases with positive delays of the active state onsets in more posteriorly located cells relative to more anteriorly located neurons are consistent with the hypothesis on preferential origin of activity in specific locations or a group of cells (Cossart et al., 2003; Sanchez-Vives and McCormick, 2000), in this case frontal regions (Massimini et al., 2004), with subsequent spread toward posterior parts of the brain. The observed delays of ~7–8 ms over the distances of 8–12 mm correspond to activity propagation at a speed of ~ 1–1.5 m/s, which is in the range of the spreading speed of traveling waves that can be found in human EEG during slow-wave sleep (Massimini et al., 2004). In contrast to active states, no systematic distance-dependence of the onset of silent states was found between neurons recorded 4, 8, or 12 mm apart one from the other.
The highly correlated occurrence of alternations between active and silent states during slow oscillation, demonstrated here with simultaneous intracellular recordings from several neurons, is consistent with the extensive literature on long-range synchronization of the slow rhythms in the EEG, LFP, and neuronal firing during slow-wave sleep (Amzica and Steriade, 1995a,b; Massimini et al., 2004; Steriade, 1997). These results also extend previous findings which demonstrated that slow waves in the membrane potential of neurons sequentially recorded at different locations had similar phase-relation to slow waves in the LFP (Contreras and Steriade, 1995). Since the fact that during slow oscillation, all neocortical neurons are involved in the same rhythm implies correlated changes of membrane potential, in the following we analyze details of these correlations.
Long-range correlation of membrane potential changes during slow oscillation
Figure 5a and b illustrates membrane potential traces of three simultaneously recorded neurons and their correlations. The three neurons were recorded at locations A, B, and D as indicated in the inset by red letter labeling of the respective electrodes and next to the membrane potential traces. An electrode C, recording from which is not shown in the figure is labeled with a light gray letter in the inset. Same code will be used also in following figures of this type. In all three pairs of neurons, membrane potential changes were strongly correlated with the peak at r=0.84, 0.63, and 0.73 between cells separated by 4, 8, and 12 mm, respectively (Fig. 5b). Strong membrane potential correlations were typical for our sample (Fig. 5c). Correlation between membrane potential changes was strongest in pairs composed of neighboring neurons with horizontal separation <0.3 mm (averaged r=0.56±0.16, n=112 pairs). With larger distances between cells, correlation was slightly smaller but still very strong. At distances between two neurons in a pair of 4, 8, 12 mm, mean values of the correlation peaks were 0.47±0.17 (4 mm, n=76), 0.48±0.21 (8 mm, n=45), and 0.44±0.2 (12 mm, n=41), respectively. Thus, even in neurons located up to 12–13 mm one from the other, which was the largest separation studied, membrane potential changes were typically strongly correlated. Interestingly, the pattern of distance-dependence of the correlation strength was similar to the distance-dependence of state overlap: strongest in neighboring neurons and slightly decreasing to a plateau in neurons separated by a few millimeters (compare Figs. 5c and 4c).
Fig. 5.

Long-range correlation of membrane potential changes in neocortical cells during slow oscillation. (a, b) Membrane potential traces of three simultaneously recorded neurons (a) and their pairwise correlation (b). The recorded neocortical neurons were separated one from the other by 4, 8, and 12 mm (see inset). In this and the following figures, electrodes from which neurons were recorded in the illustrated example are labeled with red letters in the inset (A, B, D in this figure); the distance between neurons in a pair (Δ) is indicated above each correlogram. (c) Correlation between membrane potential changes in cell pairs plotted against the distance between two cells in a pair. Each point represents data from one cell pair. For <0.3-mm separation n=112 pairs, for 4 mm n=76, for 8 mm n=45, and for 12 mm n=41. Note the high degree of correlation between cells separated by up to 12 mm. (d) Shift of the peak in the crosscorrelogram plotted against the distance between cells in a pair. For <0.3-mm separation n=111 pairs, for 4 mm n=75, for 8 mm n=43, and for 12 mm n=35. Shifts were not plotted for peaks weaker than 0.15. (e) Relation between the correlation strength (abscissa, correlation coefficient) and the shift of the peak. Note that larger peak shifts were found in pairs with weaker correlations.
The shift of the crosscorrelogram peak had a tendency to increase with the increasing distance (Fig. 5d). It was 4±7 ms for crosscorrelations between neighboring neurons with <0.3 mm separation (n=111 pairs), 10±22 ms in pairs of neurons separated by 4 mm (n=75), 15±23 ms for 8 mm (n=44), and 39±64 ms for 12 mm separation (n=35). The shift of the peak could occasionally reach up to 150–260 ms, compatible with earlier study of the correlation between extracellularly recorded signals during slow oscillation (Amzica and Steriade, 1995a,b). With increasing distance between neurons in a pair, the variability of the peak shift also increased dramatically, indicating a heterogeneity of temporal relations between slow oscillation of membrane potential in different cell pairs. Furthermore, large peak shifts were found in cell pairs with weaker correlation (Fig. 5e). Notably, even in pairs with maximal separation between the recorded neurons (~12–13 mm), the shift of crosscorrelation peak could be close to zero, indicating that even in distant neurons membrane potential changes could take place essentially synchronously. This observation is consistent with the present finding of fast, all-or-none-like spread of large amplitude LFP patterns in the monkey cortex (Thiagarajan et al., 2010).
The above analysis shows that during slow oscillation, an overall correlation between membrane potential changes is strong, even in neurons separated by ~12–13 mm (maximal distance in the present data sample). How is this pattern of highly correlated changes of the membrane potential in neocortical neurons during slow oscillation related to the correlation pattern during periods without slow oscillation? To address this question, we used occasional periods of recordings without slow oscillation. Figure 6a shows membrane potential traces of two neurons separated by ~5 mm one from the other. In this recording, periods without slow oscillation and with slow oscillation can be clearly distinguished. During a period without slow oscillation, membrane potential changes in two neurons were uncorrelated (Fig. 6b, left panel). Just few seconds later, when the slow oscillation developed, changes of the membrane potential in these same neurons became highly correlated (Fig. 6b, right panel, r=0.54). The dramatic decrease of the membrane potential correlation in distant neurons during periods without slow oscillation as compared to the periods with the slow oscillation was typical in our sample (Fig. 6c). During periods without the oscillation, the correlation was very weak in pairs of neurons separated by ~5 mm (mean r=0.2±0.14, n=6), and absent in pairs of neurons separated by ~13 mm (r=0.08±0.05, n=14). Both values were significantly smaller than measured in the same pairs of neurons but during periods of slow oscillation (r=0.56±0.05 and 0.37+0.17, respectively). Scatter in Fig. 6d shows the relation between the correlation strengths during periods with and without slow oscillation for cell pairs in which correlation was calculated for both conditions. All data points in the scatter are located above the main diagonal, showing that without the slow oscillation correlation was always weaker. One consequence of this relation would be the dependence of the correlation strength on the expression of the slow correlation during the period used for calculating the correlation. For the periods with clear, well-developed slow oscillation, the correlation should be stronger than for the periods including intervals of less regular oscillation, which occurred close to transitions from or to periods without the slow oscillations. Indeed, when we reinspected results presented in Figs. 4 and 5, we found that in pairs with low correlation values or low state overlap the analyzed periods included intervals with less expressed or absent slow oscillation in one of the recorded neurons. Although this dependence holds for all neurons, the correlation of membrane potential changes in five pairs of neighboring neurons for which periods with and without slow oscillation were available remained strongly correlated even without the slow oscillation (r=0.52±0.24, n=5 triangle symbols in Fig. 6d). Strong correlation of the membrane potential changes in neighboring neurons even without slow oscillation is consistent with a previous report on highly correlated membrane potential fluctuations in closely located neurons in the visual cortex (Lampl et al., 1999).
Fig. 6.

High correlation of membrane potential changes in distant neocortical cells is restricted to periods of slow oscillation. (a) Simultaneous intracellular recording from two neocortical neurons during periods without slow oscillation and during slow oscillation, as indicated by the presence of large amplitude slow waves in the LFP and membrane potential traces. (b) Correlograms of the membrane potential in two cells from (a) calculated for periods with and without slow oscillation, as indicated. (c) Distance-dependence of the correlation between membrane potential changes in cell pairs during slow oscillation (blue diamond symbols, data from Fig. 5c) and during periods without slow oscillation (red circles, n=25). Note that during nonoscillating state the strength of correlation decreases dramatically with distance and membrane potential changes in cell separated by 12 mm are essentially uncorrelated. (d) Correlation of membrane potential changes in cell pairs during slow oscillation plotted against the correlation during periods without slow oscillation in the same pair of neurons. All data points are located at or above the main diagonal, indicating that correlation is always higher during periods of slow oscillation. This holds both for the cells recorded close one to the other (<1-mm horizontal distance, typically <300 μm, red triangle symbols, n=5), and for the neurons recorded at a distance >3 mm one from the other (blue diamond symbols, n=20).
Thus, in neurons separated by <0.3 mm horizontally, membrane potential changes are correlated both during periods with and without slow oscillation. In pairs of cells separated by several millimeters, strong membrane potential correlations were observed only during periods of slow oscillation, while without slow oscillation correlation was weak or absent. These results suggest that correlation of membrane potential changes in distant neurons is imposed by the slow oscillation. Therefore, next we studied the contribution of different phases of the slow oscillation and different frequency components of membrane potential fluctuations to the observed strong overall correlation.
Dynamics of the membrane potential correlation: high correlation during the transitions between active and silent states but low correlation within states
To assess the dynamics of membrane potential correlation during the slow oscillation, we calculated crosscorrelation function in a sliding window of 200 ms width, with a 50-ms step. Figure 7 shows an example of the dynamics of the correlation of membrane potential in a pair of neurons separated by 12 mm. Membrane potential exhibits clear slow oscillation, and its changes are highly correlated in the two neurons (Fig. 7a and b). However, the correlation does not remain at the same level but varies dramatically during the oscillation cycle (Fig. 7c). The plot of the correlation time course reveals that correlation is especially strong during the transitions between the states, as indicated by red colors in the color-coded plot and high values of the peak. One crosscorrelogram computed for a period covering transition from silent to the active state is illustrated in Fig. 7d (right panel, peak r=0.82). In contrast, correlation is weak or absent during states, as indicated by the predominance of green colors in the color-coded plot of crosscorrelation dynamics and low values of the correlation peak (Fig. 7c). An example crosscorrelogram calculated for a period during the active state in both neurons is illustrated in Fig. 7d (left panel, peak r=0.16). These results show that correlated are transitions between states but not the activity within the states.
Fig. 7.

Dynamics of membrane potential correlation in a pair of neurons during slow oscillation. (a) Membrane potential traces of two simultaneously recorded neocortical neurons during slow oscillation. Active and silent states are indicated below the traces. (b) A scheme of recording electrode location, and a crosscorrelogram calculated using membrane potential traces from (a). (c) Time course of the correlation between membrane potential in two cells from (a), same time scale. Correlation was calculated in a sliding window of 200 ms length, with a step of 50 ms. Crosscorrelograms for each window are color-coded and shown in the top panel. Lower panel shows the time course of changes of the correlation peak. (d) Example correlograms of membrane potential in two neurons calculated for a period within an active state and a period that includes a transition from silent to the active state. Periods used to calculate correlograms in (d) are indicated with gray vertical bars in (a) and (c). Note that correlation between membrane potential of recorded neurons changes dramatically during the oscillation cycle. The correlation is weak or absent when calculated for periods within the active (or silent) state but increases dramatically when transition between active and silent states occurs. See online version for color version of the figure.
To study the relation between the phase of slow oscillation and the correlation strength in a systematic way, we selected for crosscorrelation analysis 300 ms periods of membrane potential traces, either (a) centered over the middle of active states, so that no transitions between the states occurred within these periods, or (b) containing the transition from silent to active states, specifically, starting 100 ms before the beginning of active states in cell A. Examples of the selected parts of the membrane potential traces are illustrated in Fig. 8a, with greenish boxes in the left part of the figure showing selected in-state periods, and gray boxes in the right part showing selected periods with transition from silent to active state. Crosscorrelogram computed using the periods during active states shows that membrane potential changes in two neurons were essentially uncorrelated (Fig. 8c, peak r=0.1). In a marked contrast, the crosscorrelogram calculated using periods with transition between the states revealed a strong correlation of the membrane potential in two neurons (Fig. 8d, peak r=0.61). Similar high correlations were obtained when the periods selected for the analysis contained transitions in the opposite direction, from active to silent states (not shown). There results corroborate the conclusion that strong overall correlation of membrane potential changes in distantly located cells during slow oscillation is due to correlated transitions between the states, while during the states membrane potential fluctuations in distant neurons are uncorrelated.
Fig. 8.

High correlation of membrane potential changes in distant neurons during slow oscillation is restricted to periods of transition between active and silent states. (a) Membrane potential traces of two simultaneously recorded neocortical neurons during slow oscillation. Active and silent states are indicated below the traces. (b) A scheme of recording electrode location, and a correlogram calculated using membrane potential traces from (a). (c) Membrane potential traces in the two cells during periods selected around the middle of active states in the cell A, as illustrated by greenish vertical bars, and a crosscorrelogram calculated using such periods. (d) Membrane potential traces in the two cells during the periods that include the transition from silent to active state in the cell A, as illustrated by gray vertical bars, and a crosscorrelogram calculated using such periods. In (c) and (d), action potentials have variable amplitudes due to downsampling of the recorded membrane potential traces. Note that correlation between membrane potential changes in two neurons is strong only during periods that include the onset of states but is weak or absent for the periods within the active states.
Long-range membrane potential correlation: slow rhythm is correlated, but fast fluctuations are not
Membrane potential fluctuations in neocortical neurons contain multiple frequency components. The slow oscillation introduces a strong low-frequency component, while during the active states high-frequency components are most pronounced in the membrane potential fluctuations (Mukovski et al., 2007; Steriade et al., 1996a,b; Timofeev et al., 2001). To disentangle the contribution of the slow oscillation to the overall strong membrane potential correlation in neuron pairs from a possible contribution of other rhythms, we have extracted the low-frequency (<5 Hz) and the high-frequency (>10 Hz) components of membrane potential fluctuations using fast Fourier transformation (FFT). To extract fluctuations at frequencies <5 Hz, we performed FFT of the signal, then set in the result all coefficients which corresponded to frequencies >5 Hz to zero, and then performed an inverse FFT (Mukovski et al., 2007; Volgushev et al., 2003). High-frequency components were extracted using the similar procedure, but Fourier coefficients corresponding to frequencies <10 Hz were set to zero in this case. Figure 9 shows unprocessed membrane potential traces of two neurons, which exhibited strong overall correlation (Fig. 9a, peak r=0.79), and low-frequency and high-frequency components extracted from the membrane potential (Fig. 9b and c). As expected, fluctuations of the low-frequency components which contained the slow rhythm were strongly correlated in two neurons (Fig. 9b, peak r=0.87). In contrast, fluctuations at frequencies >10 Hz showed little correlation (Fig. 9c, peak r=0.11). These results substantiate the conclusion that high correlation of membrane potential changes during slow oscillations is due to the slow rhythm of synchronously occurring transitions between the states, while fluctuations at higher frequencies, which are most pronounced during the active states, are not synchronized in distant neurons (Steriade et al., 1996a,b).
Fig. 9.
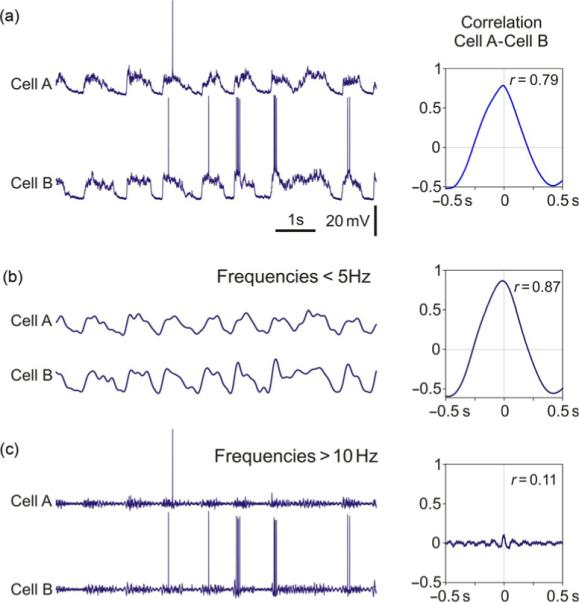
Strong correlation of membrane potential changes in neocortical neurons during slow oscillation is dominated by low frequencies. (a) Membrane potential traces of two simultaneously recorded neurons and their crosscorrelogram. (b) Low-frequency components (<5 Hz) of the membrane potential fluctuations extracted from traces in (a), and crosscorrelogram between these components. (c) High-frequency components (>10 Hz) extracted from membrane potential traces in (a), and their crosscorrelogram. Note that while low-frequency components of the membrane potential fluctuations in two neurons express a strong correlation, high-frequency components show only little correlation.
Summary and conclusions: what is synchronous in neurons during the synchronized EEG?
To summarize, our analyses revealed a highly correlated occurrence of active and silent states and a strong overall correlation of membrane potential changes in pairs of simultaneously recorded neurons during slow oscillation. On average, about 70% of time both neurons in a pair were in the same state, either active or silent. This highly correlated occurrence of states was observed even in pairs with maximal separation between the cells, up to 13 mm. Similarly, the membrane potential correlation remained high even at maximal distance between neurons in our sample. The strong long-range correlation of the membrane potential was observed only (i) during the slow oscillation but not during periods without the oscillation, (ii) during periods which included transitions between states but not during within-the-state periods, and (iii) for the low-frequency (<5 Hz) components of membrane potential fluctuations but not for the higher-frequency components (>10 Hz). These results are consistent with previous reports on correlation between the LFP, firing, and membrane potential changes in neocortical neurons during slow oscillation (Amzica and Steriade, 1995a,b; Contreras and Steriade, 1995; Steriade and Amzica, 1996; Steriade et al., 1996a,b) and extend previous findings by demonstrating that membrane potential correlation in distant neurons is brought about by synchronous transitions between states, while activity within states is largely uncorrelated. In contrast to the neurons separated apart by several millimeters, membrane potential fluctuations in neighboring neurons remain correlated during periods without slow oscillation, consistent with an earlier report for the visual cortex neurons (Lampl et al., 1999).
Thus, during the slow oscillation, generalized and synchronized over large distances are transitions between the states, which produce the characteristic pattern of the synchronized summary activity, EEG or LFP. Fine patterns of neuronal activity during active states do not express long-range synchronization, but correlations of the membrane potential during active states remain local and rapidly decay with distance.
It has been stressed elsewhere (Amzica and Steriade, 1995a,b; Steriade et al., 1996a,b) that desynchronization of the EEG during brain activation does not mean absence of any correlated neuronal activity. Rather, during the activation, properties and time scale of the synchronization change (Buzsaki, 2006). It becomes not generalized but selective, so that only specific neurons and neuronal populations are synchronously active, and not continuing but dynamic, so that emergence of synchrony brings neurons together to temporally operate as a united ensemble, while synchrony decay breaks the ensemble apart. This selection of neurons by synchrony may be, for example, task-specific (Howard et al., 2003; Roelfsema et al., 1997; Womelsdorf et al., 2006) or object-specific (Eckhorn et al., 1988; Gray and Singer, 1989; von der Malsburg, 1994). Due to its dynamic nature, this synchronization produces short living episodes of fast, high-frequency rhythms, which are suggested to underlay cognitive processes (Gray, 1999; Jensen et al., 2007; Lakatos et al., 2008; Singer, 1999).
Much like “desynchronized EEG” does not mean the lack of correlated neuronal activity, also the “synchronized EEG” does not mean that activity of neurons throughout the cortex is correlated on the fine time scale. Slow oscillation imposes a coarse yet very pronounced common low-frequency structure on neuronal activity, which organizes other rhythms (Contreras and Steriade, 1995; Steriade and Timofeev, 2003; Steriade et al., 1993b, 1996a,b), but there is no generalized synchronization of activity of neurons on the fine time scale during the active states. A proposition that neuronal activity during active states is governed by mechanisms of dynamic selection of cell ensembles that are similar to those operating during activated state of the brain is very compelling but its test awaits supporting evidence from future experiments.
Acknowledgments
We are grateful to Marina Chistiakova for stimulating discussions and Vladimir Ilin for the help with data processing. This work was supported by Bundesministerium für Bildung und Forschung (01GQ07112) and start-ups from University of Connecticut to M. V.; Canadian Institutes of Health Research (MOP-37862, MOP-67175), National Science and Engineering Research Council of Canada (grant 298475) and National Institute of Neurological Disorders and Stroke (1R01-NS060870 and 1R01-NS059740) to I. T. I. T. is Fonds de la Recherche en Santé du Québec Research Scholar.
Abbreviations
- EEG
electroencephalogram
- EMG
electromyogram
- LFP
local field potentials
- REM
rapid eye movement
- SD
standard deviation
- SWS
slow-wave sleep
References
- Amzica F, Steriade M. Disconnection of intracortical synaptic linkages disrupts synchronization of a slow oscillation. The Journal of Neuroscience. 1995a;15(6):4658–4677. doi: 10.1523/JNEUROSCI.15-06-04658.1995. [DOI] [PMC free article] [PubMed] [Google Scholar]
- Amzica F, Steriade M. Short- and long-range neuronal synchronization of the slow (<1 Hz) cortical oscillation. Journal of Neurophysiology. 1995b;73(1):20–38. doi: 10.1152/jn.1995.73.1.20. [DOI] [PubMed] [Google Scholar]
- Blake H, Gerard RW. Brain potentials during sleep. The American Journal of Physiology. 1937;119:692–703. [Google Scholar]
- Bullock TH, McClune MC, Achimowicz JZ, Iragui-Madoz VJ, Duckrow RB, Spencer SS. Temporal fluctuations of coherence of brain waves. Proceedings of the National Academy of Science of the United States of America. 1995;92:11568–11572. doi: 10.1073/pnas.92.25.11568. [DOI] [PMC free article] [PubMed] [Google Scholar]
- Buzsaki G. Rhythms of the brain. Oxford University Press; New York: 2006. p. 448. [Google Scholar]
- Chauvette S, Timofeev I. Slow oscillation properties are not identical in different cortical areas of anesthetized and nonanesthetized cats. Program No. 173.2. 2009 Neuroscience Meeting Planner. Society for Neuroscience; Washington, DC: 2009. Online. [Google Scholar]
- Chauvette S, Volgushev M, Mukovski M, Timofeev I. Local origin and long-range synchrony of active state in neocortex during slow oscillation. In: Timofeev I, editor. Mechanisms of spontaneous active states in the neocortex. Research Signpost; Kerala, India: 2007. pp. 73–92. [Google Scholar]
- Chauvette S, Volgushev M, Timofeev I. Origin of active states in local neocortical networks during slow sleep oscillation. Cerebral Cortex. 2010;20:2660–2674. doi: 10.1093/cercor/bhq009. [DOI] [PMC free article] [PubMed] [Google Scholar]
- Contreras D, Steriade M. Cellular basis of EEG slow rhythms: A study of dynamic corticothalamic relationships. The Journal of Neuroscience. 1995;15:604–622. doi: 10.1523/JNEUROSCI.15-01-00604.1995. [DOI] [PMC free article] [PubMed] [Google Scholar]
- Cossart R, Aronov D, Yuste R. Attractor dynamics of network UP states in the neocortex. Nature. 2003;423:283–288. doi: 10.1038/nature01614. [DOI] [PubMed] [Google Scholar]
- Eckhorn R, Bauer R, Jordan W, Brosch M, Kruse W, Munk M, et al. Coherent oscillations: A mechanism of feature linking in the visual cortex? Biological Cybernetics. 1988;60:121–130. doi: 10.1007/BF00202899. [DOI] [PubMed] [Google Scholar]
- Gray CM. The temporal correlation hypothesis of visual feature integration: Still alive and well. Neuron. 1999;24:31–47. doi: 10.1016/s0896-6273(00)80820-x. [DOI] [PubMed] [Google Scholar]
- Gray CM, Singer W. Stimulus-specific neuronal oscillations in orientation columns of cat visual cortex. Proceedings of the National of Academy Science of the United States of America. 1989;86:1698–1702. doi: 10.1073/pnas.86.5.1698. [DOI] [PMC free article] [PubMed] [Google Scholar]
- Howard MW, Rizzuto DS, Caplan JB, Madsen JR, Lisman J, Aschenbrenner-Scheibe R, et al. Gamma oscillations correlate with working memory load in humans. Cerebral Cortex. 2003;13:1369–1374. doi: 10.1093/cercor/bhg084. [DOI] [PubMed] [Google Scholar]
- Jensen O, Kaiser J, Lachaux JP. Human gamma-frequency oscillations associated with attention and memory. Trends in Neurosciences. 2007;30:317–324. doi: 10.1016/j.tins.2007.05.001. [DOI] [PubMed] [Google Scholar]
- Lakatos P, Karmos G, Mehta AD, Ulbert I, Schroeder CE. Entrainment of neuronal oscillations as a mechanism of attentional selection. Science. 2008;320:110–113. doi: 10.1126/science.1154735. [DOI] [PubMed] [Google Scholar]
- Lampl I, Reichova I, Ferster D. Synchronous membrane potential fluctuations in neurons of the cat visual cortex. Neuron. 1999;22:361–374. doi: 10.1016/s0896-6273(00)81096-x. [DOI] [PubMed] [Google Scholar]
- Massimini M, Huber R, Ferrarelli F, Hill S, Tononi G. The sleep slow oscillation as a traveling wave. The Journal of Neuroscience. 2004;24:6862–6870. doi: 10.1523/JNEUROSCI.1318-04.2004. [DOI] [PMC free article] [PubMed] [Google Scholar]
- Mukovski M, Chauvette S, Timofeev I, Volgushev M. Detection of active and silent states in neocortical neurons from the field potential signal during slow-wave sleep. Cerebral Cortex. 2007;17:400–414. doi: 10.1093/cercor/bhj157. [DOI] [PubMed] [Google Scholar]
- Niedermeyer E, Lopes da Silva F. Electroencephalography: Basic principles, clinical applications and related fields. Lippincott Williams & Wilkins; Philadelphia: 2005. p. 1309. [Google Scholar]
- Roelfsema PR, Engel AK, König P, Singer W. Visuomotor integration is associated with zero time-lag synchronization among cortical areas. Nature. 1997;385:157–161. doi: 10.1038/385157a0. [DOI] [PubMed] [Google Scholar]
- Sanchez-Vives MV, McCormick DA. Cellular and network mechanisms of rhythmic recurrent activity in neocortex. Nature Neuroscience. 2000;3:1027–1034. doi: 10.1038/79848. [DOI] [PubMed] [Google Scholar]
- Singer W. Neuronal synchrony: A versatile code for the definition of relations? Neuron. 1999;24:49–65. doi: 10.1016/s0896-6273(00)80821-1. [DOI] [PubMed] [Google Scholar]
- Steriade M. Synchronized activities of coupled oscillators in the cerebral cortex and thalamus at different levels of vigilance. Cerebral Cortex. 1997;7(6):583–604. doi: 10.1093/cercor/7.6.583. [DOI] [PubMed] [Google Scholar]
- Steriade M, Amzica F. Intracortical and corticothalamic coherency of fast spontaneous oscillations. Proceedings of the National Academy of Sciences of the United States of America. 1996;93(6):2533–2538. doi: 10.1073/pnas.93.6.2533. [DOI] [PMC free article] [PubMed] [Google Scholar]
- Steriade M, Amzica F, Contreras D. Synchronization of fast (30–40 Hz) spontaneous cortical rhythms during brain activation. The Journal of Neuroscience. 1996a;16(1):392–417. doi: 10.1523/JNEUROSCI.16-01-00392.1996. [DOI] [PMC free article] [PubMed] [Google Scholar]
- Steriade M, Contreras D, Amzica F, Timofeev I. Synchronization of fast (30–40 Hz) spontaneous oscillations in intrathalamic and thalamocortical networks. The Journal of Neuroscience. 1996b;16:2788–2808. doi: 10.1523/JNEUROSCI.16-08-02788.1996. [DOI] [PMC free article] [PubMed] [Google Scholar]
- Steriade M, Contreras D, Dossi RC, Nuñez A. The slow (<1 Hz) oscillation in reticular thalamic and thalamo-cortical neurons: Scenario of sleep rhythm generation in interacting thalamic and neocortical networks. The Journal of Neuroscience. 1993a;13:3284–3299. doi: 10.1523/JNEUROSCI.13-08-03284.1993. [DOI] [PMC free article] [PubMed] [Google Scholar]
- Steriade M, Nuñez A, Amzica F. A novel slow (<1 Hz) oscillation of neocortical neurons in vivo: Depolarizing and hyperpolarizing components. The Journal of Neuroscience. 1993b;13:3252–3265. doi: 10.1523/JNEUROSCI.13-08-03252.1993. [DOI] [PMC free article] [PubMed] [Google Scholar]
- Steriade M, Nuñez A, Amzica F. Intracellular analysis of relations between the slow (<1 Hz) neocortical oscillations and other sleep rhythms of electroencephalogram. The Journal of Neuroscience. 1993c;13:3266–3283. doi: 10.1523/JNEUROSCI.13-08-03266.1993. [DOI] [PMC free article] [PubMed] [Google Scholar]
- Steriade M, Timofeev I. Neuronal plasticity in thalamocortical networks during sleep and waking oscillations. Neuron. 2003;37(4):563–576. doi: 10.1016/s0896-6273(03)00065-5. [DOI] [PubMed] [Google Scholar]
- Steriade M, Timofeev I, Grenier F. Natural waking and sleep states: A view from inside neocortical neurons. Journal of Neurophysiology. 2001;85:1969–1985. doi: 10.1152/jn.2001.85.5.1969. [DOI] [PubMed] [Google Scholar]
- Thiagarajan TC, Lebedev MA, Nicolelis MA, Plenz D. Coherence potentials: Loss-less, all-or-none network events in the cortex. PLoS Biology. 2010;8(1):e1000278. doi: 10.1371/journal.pbio.1000278. [DOI] [PMC free article] [PubMed] [Google Scholar]
- Timofeev I, Grenier F, Bazhenov M, Sejnowski TJ, Steriade M. Origin of slow cortical oscillations in deafferented cortical slabs. Cerebral Cortex. 2000a;10:1185–1199. doi: 10.1093/cercor/10.12.1185. [DOI] [PubMed] [Google Scholar]
- Timofeev I, Grenier F, Steriade M. Impact of intrinsic properties and synaptic factors on the activity of neocortical networks in vivo. Journal of Physiology, Paris. 2000b;94:343–355. doi: 10.1016/s0928-4257(00)01097-4. [DOI] [PubMed] [Google Scholar]
- Timofeev I, Grenier F, Steriade M. Disfacilitation and active inhibition in the neocortex during the natural sleep–wake cycle: An intracellular study. Proceedings of the National Academy of Sciences of the United States of America. 2001;98:1924–1929. doi: 10.1073/pnas.041430398. [DOI] [PMC free article] [PubMed] [Google Scholar]
- Timofeev I, Steriade M. Low-frequency rhythms in the thalamus of intact-cortex and decorticated cats. Journal of Neurophysiology. 1996;76:4152–4168. doi: 10.1152/jn.1996.76.6.4152. [DOI] [PubMed] [Google Scholar]
- Volgushev M, Chauvette S, Mukovski M, Timofeev I. Precise long-range synchronization of activity and silence in neocortical neurons during slow-wave sleep. The Journal of Neuroscience. 2006;26:5665–5672. doi: 10.1523/JNEUROSCI.0279-06.2006. [DOI] [PMC free article] [PubMed] [Google Scholar]
- Volgushev M, Mukovski M, Chauvette S, Timofeev I. Detection of active and silent states in neocortical networks during slow oscillations. In: Timofeev I, editor. Mechanisms of spontaneous active states in the neocortex. Kerala, India: 2008. pp. 93–122. ResearchSignpost 37/661 (2), Fort P.O., Trivandrum-695 023. [Google Scholar]
- Volgushev M, Pernberg J, Eysel UT. Gamma-frequency fluctuations of the membrane potential and response selectivity in visual cortical neurons. European Journal of Neuroscience. 2003;17:1768–1776. doi: 10.1046/j.1460-9568.2003.02609.x. [DOI] [PubMed] [Google Scholar]
- von der Malsburg C. The correlation theory of brain function. In: Domany E, van Hemmen JL, Schulten K, editors. 1981 MPI biophysical chemistry, internal report 81-2. Reprinted in Models of neural networks II. Springer; Berlin: 1994. [Google Scholar]
- Womelsdorf T, Fries P, Mitra PP, Desimone R. Gamma-band synchronization in visual cortex predicts speed of change detection. Nature. 2006;439:733–736. doi: 10.1038/nature04258. [DOI] [PubMed] [Google Scholar]