

Abstract
We examined midbrain, medial temporal lobe, and basal ganglia serotonin transporter (SERT) distribution volume ratio (DVR) values in subjects with major depressive disorder versus healthy volunteers using a selective SERT radioligand and single photon emission computed tomography (SPECT). We hypothesized that the DVR value for SERT binding would be lower in depressed versus non-depressed subjects. [123I]-ADAM SPECT scans were acquired from 20 drug free, depressed subjects and 10 drug free, healthy volunteers. The primary outcome measure was the DVR value for [123I]-ADAM uptake in the midbrain, medial temporal lobe, and basal ganglia regions. Depressed subjects demonstrated significantly lower DVR values in the midbrain, right and left medial temporal lobe, and right and left basal ganglia. There was s significant probability that lower DVR values could distinguish between depressed and non-depressed subjects in the midbrain, medial temporal lobe, and the right and left basal ganglia. These findings confirm prior observations of lower SERT binding in depression, and suggest that low SERT binding may represent a putative biomarker of depression. Future studies are needed to confirm these observations.
Keywords: Single photon emission computed tomography (SPECT), Serotonin transporter, Major depression, Biomarker, Midbrain, Medial temporal lobe, Basal ganglia
1. INTRODUCTION
Studies suggest that serotonin transporter (SERT) activity may reflect the general state of neuronal serotonin (5-HT) activity throughout the brain. For example, SERT sites in humans are primarily located in the thalamus, hypothalamus, amygdala, ventral striatum, nucleus accumbens, cingulate gyrus, and occipital lobes (Kovachich, Aronson, and Brunswick, 1992; Gurevich and Joyce, 1996); therefore, regions involved in the genesis and modulation of mood, affect, rage, and euphoria. Serotonin may therefore play a role in the pathophysiology of depression and may also facilitate the therapeutic action of some antidepressant drugs. For example, several postmortem studies reported lower SERT density in brain samples of depressed patients compared to non-depressed individuals (Leake et al., 1991; Arango et al., 1995). Arango et al. (1995) found lower SERT density in 42 of 43 brain regions in depressed compared to non-depressed individuals, with the lowest SERT density in the ventrolateral prefrontal cortex – a region involved in mediating behavior and emotions (Bennett and Hacker, 2005), and a region showing low glucose metabolism in depression (Ito et al., 1996; Oda et al., 2003). Joensuu et al. (2007) also reported decreased midbrain SERT binding in 29 depressed patients compared to 19 healthy controls. However, decreased SERT density in depression has not been universally observed (Conway and Brunswick, 1985; Lawrence et al., 1997).
Imaging studies of pre- and post-synaptic 5-HT receptors have also shown decreased 5-HT2 (Meyer et al., 1999; Yatham et al., 1999) and 5-HT2A receptor binding (Biver et al., 1997; Massou et al., 1997) in depressed patients compared to non-depressed ones, although these findings are not universally observed (D’haenen et al., 1992). While studies of SERT binding in depression have been attempted using 11C and 18F-labeled fluoxetine, sertraline, citalopram and paroxetine (Dannals et al., 1990; Suehiro et al., 1991; Das and Mukherjee, 1993), these agents were not suitable for imaging in humans (Scheffel et al., 1994). In contrast, the selective radioligand, [11C](+)McN5652, has been used successfully to image SERT sites in humans (Suehiro et al., 1993; Szabo et al., 1995). Although one preliminary PET study showed significantly greater 11C](+)McN5652 uptake in the left frontal (p=0.013) and right cingulate (p=0.043) cortex of depressed patients compared to non-depressed individuals (Reivich et al., 2004), subsequent studies with larger patient samples found lower SERT binding in depression (Ichimiya et al., 2002; Parsey et al., 2006). Several non-selective SERT and dopamine transporter agents (e.g., [123I]-β-CIT) have also been used to study SERT binding in depression. For example, Malison et al. (1998) and Eggers et al. (2003) reported lower SERT binding in depressed patients, although these findings have not been universally observed (Staley, Sanacora, and Tamagnan, 2005). However, these results are difficult to interpret because [123I]-β-CIT is not selective for SERT sites (Malison et al., 1998; Kugaya et al., 2003).
More recently, we used the selective SERT radioligand, 123I-labeled ((2-((dimethylamino)methy) phenyl)thio)-5-iodophenylamine) ([123I]-ADAM; Oya et al., 2000; Newberg et al., 2004; Erlandsson et al., 2005) to image brain SERT binding in depression. In a preliminary study of 7 depressed and 6 non-depressed subjects, we observed decreased midbrain SERT binding in the depressed subjects (p=0.01; Newberg et al., 2005). However, other studies did not confirm these observations (Catafu et al., 2006; Herold et al., 2006).
In the current study, we prospectively examined a new cohort of drug free, depressed subjects in an effort to replicate our earlier finding of lower SERT binding in depressed versus non-depressed subjects using [123I]-ADAM, and to test the hypothesis that low SERT binding may represent a putative biomarker to distinguish depressed from non-depressed subjects.
2. METHODS
2.1. Subjects
Depressed subjects ≥18 years old with a DSM IV-TR Axis I diagnosis of major depressive disorder were enrolled. The clinical diagnosis was verified by a highly trained psychiatrist using the Structured Clinical Interview for DSM-IV-TR format (First et al., 2001). Subjects were off prior psychotropic medication ≥6 months, and had a 17-item Hamilton Depression Rating (HAM-D; Williams, 1988) score ≥16. Subjects had a physical examination by a board certified internist and laboratory evaluation (including electrolyte, hepatic, renal, thyroid panels, urinalysis, illicit drug screen, and electrocardiogram). Subjects were in good health and had no meaningful laboratory abnormalities. Women of child-bearing potential had a negative pregnancy test. Subjects were excluded from the study if they had any of the following: primary Axis I diagnosis other than major depressive disorder; history of mania or psychosis; actively suicidal; substance abuse or dependence within the preceding 3 months; positive screen for illicit drugs; use of psychotropic medication within the preceding 12 months; unstable medical condition; pregnant or nursing; known history of transient ischemic attack, cerebral infarction, hypertensive encephalopathy, intracranial hemorrhage, head trauma with loss of consciousness, encephalitis, exposure to neurotoxin, dementia, normal pressure hydrocephalus, brain tumor, basal ganglia disease, polyneuropathy, or unable to provide informed consent. It should be noted that there were three control subjects with a family history of depression. However, this should result in SERT binding that is more similar to the patients with major depression strengthening any findings that demonstrate a differentiation between the control and depressed subjects.
2.2. Informed Consent
Subjects provided written informed consent in accordance with the ethical standards of the Institutional Review Board of the University of Pennsylvania. The study was conducted under IND #65,542 for [123I]-ADAM using Good Clinical Practice guidelines with oversight by the local Office of Human Research and an independent Data & Safety Monitoring Board.
2.3. Scan Procedures
Subjects were administered 18 drops of concentrated Lugol’s solution in order to block 123I uptake by the thyroid. [123I]-ADAM 185 MBq (5 mCi) was injected through an indwelling venous catheter. Four hours after [123I]-ADAM administration, SPECT images were acquired over a 60 minutes on a on a triple-head gamma camera equipped with ultra-high resolution fan-beam collimators (Picker 3000; Picker International, Cleveland, OH). Prior kinetic modeling with [123I]-ADAM indicated that the 4-hour delay in image acquisition allowed for the use of the reference region method for estimating SERT binding, without the need for arterial sampling (Acton et al., 2001).
2.4. Image Processing & Analysis
SPECT images were analyzed using previously used methods for our studies of depression (Newberg et al., 2005). Images were reconstructed using a low pass filter and Chang’s first order attenuation correction (coefficient of 0.11 cm-1). All scans were resliced along the canthomeatal line. Regions of interest (ROIs) were placed on each scan utilizing a standardized template containing ROIs that were fit directly on each SPECT scan based upon a previously validated magnetic resonance imaging template that uses well defined brain structures (Resnick et al., 1993). Within the x-y plane, ROIs in the template were smaller than the actual structures they represent in order to minimize resolution induced problems with ill defined edges. To reduce the effects of volume averaging in the axial direction, the small ROIs were not placed on the slices that contained the upper most and lower most portions of the structures they represent. This limits the small ROIs to the central aspect of structures they represented. This results in a high degree of quantitative accuracy with test-retest reliability typically less than 6%. Whole brain boundaries were drawn by hand on slices located 12 mm above the highest slice that included the basal ganglia. The primary imaging outcome measure was the distribution volume ratio (DVR) at 3 to 4 hours post injection, when the distribution of [123I]-ADAM approached a near equilibrium state that reflected the ratio of k3/k4, which was related to [123I]-ADAM binding potential. The DVR value was calculated as the ROI ÷ reference region where the reference region was the cerebellum which consists of non-specific binding, as described previously (Acton et al., 2001).
2.5. Statistical Procedures
Analyses were implemented with the realization that the limited sample size may only allow for the detection of large differences between groups. All analyses were conducted in Stata 11.0 (College Station, TX) with two-sided tests. Initial analyses were descriptive and stratified according to ROI. Analyses included means, medians, ranges, and standard deviation (SD) of continuous covariates (e.g. age) and DVR values. The ‘sktest’ procedure in Stata was used to assess the normality of DVR values at each ROI. The intra-subject association of DVR values was estimated using Spearman rank correlation coefficients for each ROI. Pearson and Spearman rank correlation coefficients were also used to examine the relationship between baseline HAM-D score and DVR values for each ROI. Student t-tests and linear regression were used to compare DVR values for each ROI in depressed versus non-depressed subjects, and in depressed subjects with or without prior psychotropic medication exposure.
Logistic regression was used to examine the predictive association between DVR values and the odds of having a diagnosis of depression (versus non-depression) with the DVR for each ROI as the covariate. The significance level associated with each DVR value was calculated in both sets of logistic regression models. Receiver operator characteristic (ROC) curves were constructed and the area under the curve (AUC) was obtained for each model. The Hosmer-Lemeshow goodness of fit test was applied to each model to test the hypothesis of adequate fit. A p value >0.05 indicated that the hypothesis of good fit was not rejected.
Bonferroni adjustment for multiple comparisons was not applied to the criterion for statistical significance. While this adjustment assumes that the various tests are statistically independent; it is more likely that the various SERT measures are correlated with each other. However, to obtain a more concise result that combines two DVR values, we also performed a stepwise logistic model. The initial model included age, gender, temporal lobes (sum of left and right), and basal ganglia. A backward stepwise approach was employed that removed variables associated with a p-value >= 0.05 one at a time, in a successive fashion. The final model included the temporal lobe, which as mentioned above was created as the sum of the left and right temporal lobe.
3. RESULTS
3.1 Enrollment
20 depressed subjects (5 women) with a mean (SD) age of 41.0 (12.75) years (range 25–63 years) and 10 non-depressed subjects (3 women) with a mean (SD) age of 44.8 (10.93) years (range 26–62 years) were enrolled (see Table 1). This study did not include subjects who were previously included in our prior studies (Newberg et al., 2004, 2005) and, thus, represents a completed new subject cohort. There were no screen failures. The mean age at 1st depressive episode was 21 (7.34) (range 13–40) years, and the mean number of prior depressive episodes was 3.5 (3.3) (range 0–10). The mean current episode duration was 23.7 (32.63) (range 2–120) months. Ten depressed subjects (2 women) never received psychotropic medication, while 10 (5 women) previously received a mean of 3.0 (2.0) (range 0 – 10) antidepressant treatments over the course of their illness. The last psychotropic medication received was either an SSRI, bupropion, or venlafaxine; however, none of the depressed subjects received treatment within a year prior to evaluation.
Table 1.
Subject demographics.
| Subject | Group | Age | Sex | Ethnicity | Hamilton | # Prior MDD |
|---|---|---|---|---|---|---|
| 1 | MDE | 29 | M | C | 20 | 4 |
| 2 | MDE | 39 | M | C | 23 | 5 |
| 3 | MDE | 28 | M | C | 16 | 0 |
| 4 | MDE | 35 | F | AA | 21 | 10 |
| 5 | MDE | 62 | M | C | 16 | 6 |
| 6 | MDE | 40 | M | C | 16 | 0 |
| 7 | MDE | 44 | M | C | 25 | 0 |
| 8 | MDE | 28 | F | C | 23 | 4 |
| 9 | MDE | 41 | M | C | 21 | 5 |
| 10 | MDE | 53 | M | C | 19 | 10 |
| 11 | MDE | 26 | M | AA | 21 | 1 |
| 12 | MDE | 61 | M | C | 17 | 5 |
| 13 | MDE | 26 | M | C | 23 | 0 |
| 14 | MDE | 56 | M | C | 22 | 4 |
| 15 | MDE | 31 | M | C | 20 | 0 |
| 16 | MDE | 58 | M | AA | 20 | 0 |
| 17 | MDE | 25 | F | AS | 19 | 0 |
| 18 | MDE | 33 | F | AS | 20 | 1 |
| 19 | MDE | 26 | M | C | 22 | 4 |
| 20 | MDE | 43 | F | C | 21 | 7 |
| 21 | Control | 34 | F | C | 2 | 0 |
| 22 | Control | 53 | F | C | 0 | 0 |
| 23 | Control | 56 | F | C | 0 | 0 |
| 24 | Control | 40 | M | C | 0 | 0 |
| 25 | Control | 48 | M | C | 1 | 0 |
| 26 | Control | 26 | M | C | 0 | 0 |
| 27 | Control | 36 | M | HIS | 0 | 0 |
| 28 | Control | 62 | M | C | 0 | 0 |
| 29 | Control | 47 | M | C | 0 | 0 |
| 30 | Control | 46 | M | C | 0 | 0 |
C=Caucasian; AA=African American; AS=Asian; HIS=Hispanic
Prior MDE= Number of prior major depressive episodes
3.2. DVR Values
DVR values were highly correlated across all ROIs within depressed and non-depressed subjects (n=30) (Table 2) and among depressed subjects (n=20) (Table 3). This demonstrates that the SERT binding between the different structures is highly correlated regardless of whether all subjects or just depressed subjects are analyzed.
Table 2.
Intra-subject correlation of [123I]-ADAM DVR values in 30 depressed and non-depressed subjects*
| Midbrain | Right Basal Ganglia | Left Basal Ganglia | Right Temporal | Left Temporal | |
|---|---|---|---|---|---|
| Midbrain | 1.0000 | ||||
| Right Basal Ganglia | 0.3593* | 1.0000 | |||
| Left Basal Ganglia | 0.2835* | 0.8972* | 1.0000 | ||
| Right Temporal | 0.4084* | 0.3681* | 0.3418* | 1.0000 | |
| Left Temporal | 0.3766* | 0.5353* | 0.4901* | 0.7918* | 1.0000 |
Spearman rank correlation coefficient p<0.0005 for all tests
Table 3.
Intra-subject Pearson correlation of [123I]-ADAM DVR values in 20 depressed subjects
| Midbrain | Right Basal Ganglia | Left Basal Ganglia | Right Temporal | Left Temporal | |
|---|---|---|---|---|---|
| Midbrain | 1.0000 | ||||
| Right Basal Ganglia | 0.4330 § | 1.0000 | |||
| Left Basal Ganglia | 0.3423 * | 0.9030 # | 1.0000 | ||
| Right Temporal | 0.4519 § | 0.2398 | 0.2388 | 1.0000 | |
| Left Temporal | 0.3668 † | 0.5020 # | 0.5190 # | 0.6284 # | 1.0000 |
Significance:
p<0.01;
p<0.005;
p<0.0005;
p<0.00001
Depressed subjects had significantly lower mean (SD) DVR values for the midbrain (p<0.005), right temporal (p<0.0005) and left temporal (p<0.004) lobes, and the right basal ganglia (p<0.03) and left basal ganglia (p=0.016) regions (Table 4; Figure 1).
Table 4.
Mean (SD) DVR values in depressed versus non-depressed subjects shows
| Non-depressed (n=10) | Depressed (n=20) | p-value† | |
|---|---|---|---|
| Midbrain | 2.07 (0.18) | 1.89 (0.13) | 0.005 |
| Right Basal Ganglia | 1.47 (0.19) | 1.29 (0.20) | 0.03 |
| Left Basal Ganglia | 1.45 (0.18) | 1.27 (0.17) | 0.016 |
| Right Temporal | 1.56 (0.19) | 1.33 (0.13) | 0.0005 |
| Left Temporal | 1.56 (0.24) | 1.33 (0.16) | 0.004 |
Age and gender were not significant in the regression models, so the unadjusted p-value is provided.
Figure 1.
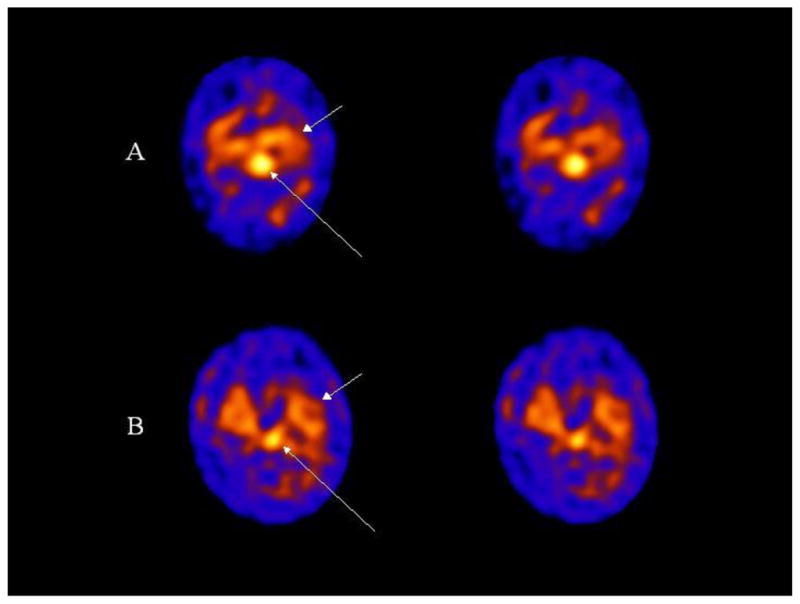
Transaxial 123I ADAM SPECT images are shown of a control (A) and depression (B) subject. The long arrows point to uptake in the midbrain which is markedly decreased in the subject with depression compared to the control subject. Non-specific binding in the cerebellum is observed below the midbrain uptake on the images (posteriorly). The short arrows point to 123I ADAM binding in the medial temporal lobe.
We also performed a stepwise logistic regression in a model that initially included age, gender, temporal lobes, and ganglia in order to eliminate any laterality effects. Beginning with the full model we get a p = 0.29 >= 0.05 by removing gender; p = 0.23 >= 0.05 by removing; and p = 0.32 >= 0.05 by removing the basal ganglia. The final model included only the temporal lobe variable, with an estimated regression coefficient of −3.91 and a p value of 0.011 (95% confidence interval from −7.13 to −0.92). The increase in odds ratio that corresponds to a 0.10 decrease in the temporal lobe DVR value is 0.68 (calculated as the exponent of the product of −3.91 and 0.10). This result indicated a lower SERT DVR value in depressed versus non-depressed subjects. The AUC value for the ROC curve for this regression model is 0.83, indicating a good predictive ability for this model (Figure 2).
Figure 2.

ROC curve based on the stepwise logistic regression model that includes the predictor temporal lobe.
There were no significant difference in any mean DVR value for depressed subjects with, or without, prior psychotropic medication exposure (p>0.20 for all ROIs) (Table 5). We explored all possible effects of gender, age, prior medication, type and treatment duration, and identified no statistically significant relationship with ADAM DVR values that would explain the difference observed between depressed versus non-depressed subjects.
Table 5.
Mean (SD) DVR values in depressed subjects with versus without prior treatment
| No prior Rx (n=13) | Prior Rx (n=7) | p-value*† | |
|---|---|---|---|
| Midbrain | 1.88 (0.14) | 1.92 (0.12) | 0.62 |
| Right Basal Ganglia | 1.21 (0.22) | 1.27 (0.16) | 0.68 |
| Left Basal Ganglia | 1.32 (0.19) | 1.21 (0.22) | 0.20 |
| Right Temporal | 1.37 (0.14) | 1.26 (0.08) | 0.07 |
| Left Temporal | 1.34 (0.19) | 1.30 (0.10) | 0.55 |
Age and gender were not significant in most of the regression models, so the unadjusted p-value is provided.
There were no statistically significant Pearson or Spearman correlations between baseline HAM-D scores and DVR values in depressed subjects (estimated correlations ranged from −0.21 to 0.03 with all p-values >0.05).
The ROC curve plots the sensitivity versus 1 minus the specificity of DVR values for tests based on all possible predicted probability values from the logistic regression models (where each probability value is used as a cutoff point for distinguishing depressed from non-depressed subjects). The AUC for the logistic regression models and the Hosmer-Lemeshow goodness of fit test for each ROI are displayed in Table 6 and Figure 2. Adjustment for age and gender did not change the findings with respect to significance of the results, or result in any reductions in the odds ratio associated with each DVR value. Values of the AUC closer to one indicate better predictive value of the final model than do values of the AUC that are farther from one. We calculated the distance between each (sensitivity, specificity) value and (1.1), as a means of ordering the probability and associated (sensitivity, specificity) values with respect to being simultaneously closer to a value of 1. The predictive ability of each ROI to distinguish depressed from non-depressed subjects is high because the AUC values are close to 1.0.
Table 6.
Predictive ability of DVR value to distinguish depressed from non-depressed subjects
| Odds ratio (95% CI) | p- value | AUC§ | Hosmer- Lemeshow† | Odds ratio (95% CI) | p- value | AUC§ | Hosme- Lemeshow† | |
|---|---|---|---|---|---|---|---|---|
| Unadjusted Model | Adjusted for age and gender | |||||||
| Midbrain | 0.001 (<0.005,0.37) | 0.024 | 0.80 | 0.51 | 0.001 (<0.005,0.48) | 0.03 | 0.81 | 0.38 |
| Right Basal Ganglia | 0.01 (<0.005,0.97) | 0.049 | 0.74 | 0.46 | 0.001 (<0.005,0.75) | 0.04 | 0.78 | 0.48 |
| Left Basal Ganglia | 0.004 (<0.005,0.57) | 0.03 | 0.75 | 0.48 | 0.002 (<0.005,0.51) | 0.03 | 0.78 | 0.42 |
| Right Temporal | 0.0001 (<0.005,0.10) | 0.008 | 0.87 | 0.69 | 0.00003 (<0.005,0.07) | 0.009 | 0.89 | 0.44 |
| Left Temporal | 0.002 (<0.005,0.32) | 0.02 | 0.79 | 0.50 | 0.002 (<.0005,0.30) | 0.02 | 0.82 | 0.37 |
p-value for the odds ratio is adjusted for age only because gender was not significant in these models
AUC = 1.0 indicates that the DVR value has high predictive ability for diagnosing depression
Hosmer-Lemeshow test >0.05 indicates adequate fit of regression models
4. DISCUSSION
In a separate cohort of 7 drug free depressed and 6 non-depressed subjects studied with [123I]-ADAM, we previously reported significantly lower midbrain SERT binding in depressed versus non-depressed subjects (p=0.01) (Newberg et al., 2005). In that preliminary study, however, we found no difference in SERT binding in the basal ganglia or medial temporal lobes. In contrast, the current cohort of depressed subjects showed lower SERT binding in the right and left basal ganglia regions (p=0.03 and p=0.016, respectively) and in the right and left median temporal lobes (p=0.0005 and p=0.004, respectively) (versus non-depressed subjects). The ability to detect the reduced SERT binding in the basal ganglia and temporal lobes in the current study is likely related to the inclusion of a larger sample size. The previous study did show a trend toward lower SERT binding in all ROIs in depressed subjects; however, it did not achieve statistical significance. Moreover, while our previous study showed a significant correlation between symptom severity (i.e., baseline HAM-D score) and 123I ADAM uptake in the midbrain (r=0.82, p=0.02) (Newberg et al., 2005), we found no relationship between baseline HAM-D scores and SERT binding in a larger subject cohort. It is possible that the current study provides a more variable relationship between symptom severity and SERT binding in depression. Despite this discrepancy, the overall results from the current study generally corroborate the finding of decreased SERT binding in depression observed in our prior, pre;iminary study (Newberg et al., 2005).
Several post-mortem studies have suggested that SERT density may be decreased in the brains of depressed patients compared to non-depressed individuals (Leake et al., 1991; Arango et al., 1995). While Malison et al. (1998), Eggers et al. (2003), and Joensuu et al. (2007, 2010) reported decreased SERT density in depressed subjects, these findings have not been universally observed (Conway & Brunswick, 1985; Lawrence et al., 1997; Staley et al., 2005). Interestingly, Lehto et al. (2006) used [123I nor-β-CIT SPECT to distinguish those depressed patients with atypical, melancholic, and “undifferentiated” depression and found that all subgroups except those with undifferentiated depression had lower SERT densities compared to controls. However, differences in methodology make it difficult to compare studies. For example, some studies have used [3H]imipramine or [123I]-β-CIT to assess SERT binding (Lawrence et al., 1997; Malison et al., 1998), and these agents also bind to other transporters – making it difficult to interpret results. Other methodological issues include the use of postmortem specimens, various degrees of prior drug exposure, and the use of different imaging modalities.
Several limitations should be considered in the interpretation of the current findings. For example, SERT binding may be influenced by gender and age. In the current study, women were included without regard to menopausal status or phase of the menstrual cycle. Similarly, several studies have shown an influence of age on SERT binding (Malison et al., 1998; Newberg et al., 2005) – although the current age and gender adjusted analyses found no effect on SERT binding values that would explain the differences between the depressed patients and controls.
It is possible that illness heterogeneity influenced DVR values in the current study. For example, the presence of anxiety may contribute to changes in SERT binding (Reimold, 2008). It is also possible that prior antidepressant exposure influenced DVR values and may have increased SERT binding with prior exposure. In our prior [123I]-ADAM study, the drug naïve depressed subjects demonstrated the lowest SERT binding. In the present study, however, we found no influence of prior psychotropic medication exposure on DVR values
It is also possible that differences in illness length, episode duration, symptom severity, or psychosocial stress may have influenced DVR values. Differences in stamina, daily activity level, sleep, seasonal effects, and circadian rhythms may influence DVR values (Willeit et al., 2000; Uusitalo et al., 2004; Ruhé et al., 2009; Tsai et al., 2009; Erritzoe et al., 2010; Kalbitzer et al., 2010). Furthermore, the extent of tobacco and social alcohol consumption was not specifically controlled in the current study. It is possible that smoking and social alcohol use may have influenced DVR values (Heinz et al., 1998; Heinz et al., 2003).
5. CONCLUSION
The finding of lower SERT binding in depressed subjects replicated our prior observations using [123I]-ADAM, and suggests that depression may be associated with low SERT binding. Moreover, low SERT binding may represent a state-dependent possible biomarker of depression with good predictive ability to distinguish between depressed versus non-depressed individuals. Future studies will be needed to confirm these observations.
Table 7.
Comparison of studies evaluating SERT binding in patients with depression
| Study | Patients | N | Imaging Modality | Findings regarding SERT binding |
|---|---|---|---|---|
| Mallison et al. (1998) | MDD | 15 | [123I] β-CIT SPECT | Decreased brainstem |
| Willeit et al. (2000) | SAD | 11 | [123I] β-CIT SPECT | Decreased in thalamus but not midbrain |
| Eggers et al. (2003) | Wilson’s Dis | 23 | [123I] β-CIT SPECT | Decreased thalamus associated with depression |
| Reivich et al. (2004) | MDD | 4 | [11C](+)McN5652 PET | Increased in the frontal and cingulate cortices |
| Meyer et al. (2004) | MDD | 20 | [11C]DASB PET | No difference between MDD and controls, but increased in prefrontal cortex, anterior cingulate, and thalamus in patients with most depressive symptoms |
| Newberg et al. (2005) | MDD | 7 | [123I] ADAM SPECT | Decreased in midbrain |
| Parsey et al. (2006) | MDD | 25 | [11C](+)McN5652 PET | Decreased in midbrain and amygdala |
| Lehto et al. (2006) | Depression | 29 | [123]nor-β-CIT SPECT | Decreased in atypical and melancholic compared to controls, but not different in “undifferentiated” depression |
| Joensuu et al. (2007) | MDD | 29 | [123]nor-β-CIT SPECT | Decreased in midbrain |
| Joensuu et al. (2010) | MDD | 23 | [123]nor-β-CIT SPECT | Decreased medial prefrontal cortex in patients homozygous for the short allele of serotonin-transporter-linked polymorphic region gene |
| Hammoud et al. (2010) | HIV | 18 | [11C]DASB PET | HIV patients were decreased compared to controls, but depressed patients had relatively higher binding compared to non-depressed HIV patients |
| Hsieh et al. (2010) | MDD Hx | 13 | [123I] ADAM SPECT | No difference in euthymic patients with history of MDD |
| Chou et al. (2010) | Bipolar | 28 | [123I] ADAM SPECT | Decreased in midbrain in euthymic patients with Bipolar I Disorder but not Bipolar II Disorder |
| Ruhé et al. (2009) | MDD | 49 | [123I] β-CIT SPECT | Males had decreased midbrain compared to controls, but not women, and higher binding in all groups was found in the winter |
Acknowledgments
This work was supported in part by NIH grants MH-077580, AG-17524, DA-09469, NS-18509, and the Jack Warsaw Fund for Research in Biological Psychiatry (Depression Research Unit, University of Pennsylvania Medical Center).
Footnotes
7. DISCLOSURES
Dr. Newberg currently receives grant support from NIH grant AG028688. He is not a member of any industry-sponsored scientific advisory board or speaker’s bureau, and has no significant financial interest in any pharmaceutical company.
Dr. Amsterdam receives grant support from NIMH grants MH06099, MH060353, MH080097, MH077580, and NIH/NCCAM grant AT005074. He is not a member of any pharmaceutical industry-sponsored advisory board or speaker’s bureau, and has no significant financial interest in any pharmaceutical company.
Ms. Wintering MH077580, AT004921 and AG028688. She is not a member of any pharmaceutical industry-sponsored advisory board or speaker’s bureau, and has no significant financial interest in any pharmaceutical company.
Dr. Shults receives research support from NIMH grants MH060998, MH060353, MH080097, and MH077580. She is not a member of any pharmaceutical industry-sponsored advisory board or speaker’s bureau, and has no significant financial interest in any pharmaceutical company.
Publisher's Disclaimer: This is a PDF file of an unedited manuscript that has been accepted for publication. As a service to our customers we are providing this early version of the manuscript. The manuscript will undergo copyediting, typesetting, and review of the resulting proof before it is published in its final citable form. Please note that during the production process errors may be discovered which could affect the content, and all legal disclaimers that apply to the journal pertain.
References
- Acton PD, Choi SR, Hou C, Plössl K, Kung HF. Quantification of serotonin transporters in nonhuman primates using [(123)I]ADAM and SPECT. Journal of Nuclear Medicine. 2001;42:1556–1562. [PubMed] [Google Scholar]
- Arango V, Underwood MD, Gubbi AV, Mann JJ. Localized alterations in pre- and postsynaptic serotonin binding sites in the ventrolateral prefrontal cortex of suicide victims. Brain Research. 1995;688:121–133. doi: 10.1016/0006-8993(95)00523-s. [DOI] [PubMed] [Google Scholar]
- Bennett MR, Hacker PM. Emotion and cortical-subcortical function, conceptual developments. Progress in Neurobiology. 2005;75:29–52. doi: 10.1016/j.pneurobio.2004.11.002. [DOI] [PubMed] [Google Scholar]
- Biver F, Wikler D, Lotstra F, Damhaut P, Goldman S, Mendlewicz J. Serotonin 5-HT2 receptor imaging in major depression, focal changes in orbito-insular cortex. British Journal of Psychiatry. 1997;171:444–448. doi: 10.1192/bjp.171.5.444. [DOI] [PubMed] [Google Scholar]
- Catafau AM, Perez V, Plaza P, Pascual JC, Bullich S, Suarez M, Penengo MM, Corripio I, Puigdemont D, Danus M, Perich J, Alvarez E. Serotonin transporter occupancy induced by paroxetine in patients with major depression disorder, a (123)I-ADAM SPECT study. Psychopharmacology (Berlin) 2006;189:145–153. doi: 10.1007/s00213-006-0540-y. [DOI] [PubMed] [Google Scholar]
- Chou YH, Wang SJ, Lin CL, Mao WC, Lee SM, Liao MH. Decreased brain serotonin transporter binding in the euthymic state of bipolar I but not bipolar II disorder: a SPECT study. Bipolar Disorders. 2010;12:312–318. doi: 10.1111/j.1399-5618.2010.00800.x. [DOI] [PubMed] [Google Scholar]
- Conway PG, Brunswick DJ. High- and low-affinity binding components for [3H]imipramine in rat cerebral cortex. Journal of Neurochemistry. 1985;45:206–209. doi: 10.1111/j.1471-4159.1985.tb05494.x. [DOI] [PubMed] [Google Scholar]
- Dannals RF, Ravert HT, Wilson AA, Wagner HN., Jr Synthesis of a selective serotonin uptake inhibitor, [11C]citalopram. International Journal of Radiation Applications and Instrumentation. 1990;41:541–543. doi: 10.1016/0883-2889(90)90036-g. [DOI] [PubMed] [Google Scholar]
- Das MK, Mukherjee J. Radiosynthesis of [F-18]fluoxetine as a potential radiotracer for serotonin reuptake sites. Applied Radiation Isotopes. 1993;44:835–842. [Google Scholar]
- D’haenen H, Bossuyt A, Mertens J, Bossuyt-Piron C, Gijsemans M, Kaufman L. SPECT imaging of serotonin2 receptors in depression. Psychiatry Research. 1992;45:227–237. doi: 10.1016/0925-4927(92)90018-y. [DOI] [PubMed] [Google Scholar]
- Eggers B, Hermann W, Barthel H, Sabri O, Wagner A, Hesse S. The degree of depression in Hamilton rating scale is correlated with the density of presynaptic serotonin transporters in 23 patients with Wilson’s disease. Journal of Neurology. 2003;250:576–580. doi: 10.1007/s00415-003-1039-7. [DOI] [PubMed] [Google Scholar]
- Erlandsson K, Sivananthan T, Lui D, Spezzi A, Townsend CE, Mu S, Lucas R, Warrington S, Ell PJ. Measuring SSRI occupancy of SERT using the novel tracer [123I]ADAM, a SPECT validation study. European Journal of Nuclear Medicine and Molecular Imaging. 2005;32:1329–1336. doi: 10.1007/s00259-005-1912-y. [DOI] [PubMed] [Google Scholar]
- Erritzoe D, Frokjaer VG, Haahr MT, Kalbitzer J, Svarer C, Holst KK, Hansen DL, Jernigan TL, Lehel S, Knudsen GM. Cerebral serotonin transporter binding is inversely related to body mass index. Neuroimage. 2010;52:284–289. doi: 10.1016/j.neuroimage.2010.03.086. [DOI] [PubMed] [Google Scholar]
- First MB, Spitzer RL, Gibbon M, Williams JBW. Structured Clinical Interview for DSM-IV-TR Axis I Disorders, Research Version, Patient Edition With Psychotic Screen (SCID-I/P W/ PSY SCREEN) New York, NY: Biometrics Research, New York State Psychiatric Institute; 2001. [Google Scholar]
- Gurevich EV, Joyce JN. Comparison of [3H]paroxetine and [3H]cyanoimipramine for quantitative measurement of serotonin transporter sites in human brain. Neuropsychopharmacology. 1996;14:309–323. doi: 10.1016/0893-133X(95)00139-5. [DOI] [PubMed] [Google Scholar]
- Hammoud DA, Endres CJ, Hammond E, Uzuner O, Brown A, Nath A, Kaplin AI, Pomper MG. Imaging serotonergic transmission with [11C]DASB-PET in depressed and non-depressed patients infected with HIV. Neuroimage. 2010;49:2588–2595. doi: 10.1016/j.neuroimage.2009.10.037. [DOI] [PMC free article] [PubMed] [Google Scholar]
- Heinz A, Jones DW, Gorey JG, Bennet A, Suomi SJ, Weinberger DR, Higley JD. Serotonin transporter availability correlates with alcohol intake in non-human primates. Molecular Psychiatry. 2003;8(2):231–234. doi: 10.1038/sj.mp.4001214. [DOI] [PubMed] [Google Scholar]
- Heinz A, Ragan P, Jones DW, Hommer D, Williams W, Knable MB, Gorey JG, Doty L, Geyer C, Lee KS, Coppola R, Weinberger DR, Linnoila M. Reduced central serotonin transporters in alcoholism. American Journal of Psychiatry. 1998;155(11):1544–1549. doi: 10.1176/ajp.155.11.1544. [DOI] [PubMed] [Google Scholar]
- Herold N, Uebelhack K, Franke L, Amthauer H, Luedemann L, Bruhn H, Felix R, Uebelhack R, Plotkin M. Imaging of serotonin transporters and its blockade by citalopram in patients with major depression using a novel SPECT ligand [123I]ADAM. Journal of Neural Transmission. 2006;113(5):659–6670. doi: 10.1007/s00702-005-0429-7. [DOI] [PubMed] [Google Scholar]
- Hsieh PC, Lee IH, Yeh TL, Chen KC, Huang HC, Chen PS, Yang YK, Yao WJ, Lu RB, Chiu NT. Distribution volume ratio of serotonin and dopamine transporters in euthymic patients with a history of major depression - a dual-isotope SPECT study. Psychiatry Research. 2010;184:157–161. doi: 10.1016/j.pscychresns.2010.09.004. [DOI] [PubMed] [Google Scholar]
- Ichimiya T, Suhara T, Sudo Y, Okubo Y, Nakayama K, Nankai M, Inoue M, Yasuno F, Takano A, Maeda J, Shibuya H. Serotonin transporter binding in patients with mood disorders, a PET study with [11C](+)McN5652. Biological Psychiatry. 2002;51:715–722. doi: 10.1016/s0006-3223(01)01351-8. [DOI] [PubMed] [Google Scholar]
- Ito H, Kawashima R, Awata S, Ono S, Sato K, Goto R, Koyama M, Sato M, Fukuda H. Hypoperfusion in the limbic system and prefrontal cortex in depression, SPECT with anatomic standardization technique. Journal of Nuclear Medicine. 1996;37:410–414. [PubMed] [Google Scholar]
- Joensuu M, Tolmunen T, Saarinen PI, Tiihonen J, Kuikka J, Ahola P, Vanninen R, Lehtonen J. Reduced midbrain serotonin transporter availability in drug-naïve patients with depression measured by SERT-specific [(123)I] nor-beta-CIT SPECT imaging. Psychiatry Research. 2007;154:125–131. doi: 10.1016/j.pscychresns.2006.08.001. [DOI] [PubMed] [Google Scholar]
- Joensuu M, Lehto SM, Tolmunen T, Saarinen PI, Valkonen-Korhonen M, Vanninen R, Ahola P, Tiihonen J, Kuikka J, Pesonen U, Lehtonen J. Serotonin-transporter-linked promoter region polymorphism and serotonin transporter binding in drug-naïve patients with major depression. Psychiatry and Clinical Neuroscience. 2010;64:387–393. doi: 10.1111/j.1440-1819.2010.02111.x. [DOI] [PubMed] [Google Scholar]
- Kalbitzer J, Erritzoe D, Holst KK, Nielsen FA, Marner L, Lehel S, Arentzen T, Jernigan TL, Knudsen GM. Seasonal changes in brain serotonin transporter binding in short serotonin transporter linked polymorphic region-allele carriers but not in long-allele homozygotes. Biological Psychiatry. 2010;67:1033–1039. doi: 10.1016/j.biopsych.2009.11.027. [DOI] [PubMed] [Google Scholar]
- Kovachich GB, Aronson CE, Brunswick DJ. Effect of repeated administration of antidepressants on serotonin uptake sites in limbic and neocortical structures of rat brain determined by quantitative autoradiography. Neuropsychopharmacology. 1992;7:317–324. [PubMed] [Google Scholar]
- Kugaya A, Seneca NM, Snyder PJ, Williams SA, Malison RT, Baldwin RM, Seibyl JP, Innis RB. Changes in human in vivo serotonin and dopamine transporter availabilities during chronic antidepressant administration. Neuropsychopharmacology. 2003;28:413–420. doi: 10.1038/sj.npp.1300036. [DOI] [PubMed] [Google Scholar]
- Lawrence KM, De Paermentier F, Lowther S, Crompton MR, Katona CL, Horton RW. Brain 5-hydroxytryptamine uptake sites labeled with [3H]paroxetine in antidepressant drug-treated depressed suicide victims and controls. Journal of Psychiatry and Neuroscience. 1997;22:185–191. [PMC free article] [PubMed] [Google Scholar]
- Leake A, Fairbairn AF, McKeith IG, Ferrier IN. Studies on the serotonin uptake binding site in major depressive disorder and control post-mortem brain, neurochemical and clinical correlates. Psychiatry Research. 1991;39:155–165. doi: 10.1016/0165-1781(91)90084-3. [DOI] [PubMed] [Google Scholar]
- Lehto S, Tolmunen T, Joensuu M, Saarinen PI, Vanninen R, Ahola P, Tiihonen J, Kuikka J, Lehtonen J. Midbrain binding of [123I]nor-beta-CIT in atypical depression. Progress in Neuropsychopharmacology and Biological Psychiatry. 2006;30:1251–1255. doi: 10.1016/j.pnpbp.2006.03.019. [DOI] [PubMed] [Google Scholar]
- Malison RT, Price LH, Berman R, van Dyck CH, Pelton GH, Carpenter L, Sanacora G, Owens MJ, Nemeroff CB, Rajeevan N, Baldwin RM, Seibyl JP, Innis RB, Charney DS. Reduced brain serotonin transporter availability in major depression as measured by [123I]-2 beta-carbomethoxy-3 beta-(4-iodophenyl)tropane and single photon emission computed tomography. Biological Psychiatry. 1998;44:1090–1098. doi: 10.1016/s0006-3223(98)00272-8. [DOI] [PubMed] [Google Scholar]
- Massou JM, Trichard C, Attar-Levy D, Feline A, Corruble E, Beaufils B, Martinot JL. Frontal 5-HT2A receptors studied in depressive patients during chronic treatment by selective serotonin reuptake inhibitors. Psychopharmacology (Berlin) 1997;133:99–101. doi: 10.1007/s002130050377. [DOI] [PubMed] [Google Scholar]
- Meyer JH, Kapur S, Houle S, DaSilva J, Owczarek B, Brown GM, Wilson AA, Kennedy SH. Prefrontal cortex 5-HT2 receptors in depression, an [18F]setoperone PET imaging study. American Journal of Psychiatry. 1999;56:1029–1034. doi: 10.1176/ajp.156.7.1029. [DOI] [PubMed] [Google Scholar]
- Meyer JH, Houle S, Sagrati S, Carella A, Hussey DF, Ginovart N, Goulding V, Kennedy J, Wilson AA. Brain serotonin transporter binding potential measured with carbon 11-labeled DASB positron emission tomography: effects of major depressive episodes and severity of dysfunctional attitudes. Archives of General Psychiatry. 2004;61:1271–1279. doi: 10.1001/archpsyc.61.12.1271. [DOI] [PubMed] [Google Scholar]
- Newberg AB, Ploessl K, Mozley PD, Stubbs JB, Wintering N, Udeshi M, Alavi A, Kauppinen T, Kung HF. Biodistribution and imaging with (123)I-ADAM: a serotonin transporter imaging agent. Journal of Nuclear Medicine. 2004;45:834–841. [PubMed] [Google Scholar]
- Newberg AB, Amsterdam JD, Wintering N, Ploessl K, Swanson RL, Shults J, Alavi A. 123I ADAM binding to serotonin transporters in patients with major depression and healthy controls, A preliminary study. Journal of Nuclear Medicine. 2005;46:993–997. [PubMed] [Google Scholar]
- Oda K, Okubo Y, Ishida R, Murata Y, Ohta K, Matsuda T, Matsushima E, Ichimiya T, Suhara T, Shibuya H, Nishikawa T. Regional cerebral blood flow in depressed patients with white matter magnetic resonance hyperintensity. Biological Psychiatry. 2003;53:150–156. doi: 10.1016/s0006-3223(02)01548-2. [DOI] [PubMed] [Google Scholar]
- Oya S, Choi SR, Hou C, Mu M, Kung MP, Acton PD, Siciliano M, Kung HF. 2-((2-((dimethylamino)methyl)phenyl)thio)-5-iodophenylamine (ADAM), an improved serotonin transporter ligand. Nuclear Medicine Biology. 2000;27:249–254. doi: 10.1016/s0969-8051(00)00084-6. [DOI] [PubMed] [Google Scholar]
- Parsey RV, Hastings RS, Oquendo MA, Huang YY, Simpson N, Arcement J, Huang Y, Ogden RT, Van Heertum RL, Arango V, Mann JJ. Lower serotonin transporter binding potential in the human brain during major depressive episodes. American Journal of Psychiatry. 2006;163:52–58. doi: 10.1176/appi.ajp.163.1.52. [DOI] [PubMed] [Google Scholar]
- Reimold M, Batra A, Knobel A, Smolka MN, Zimmer A, Mann K, Solbach C, Reischl G, Schwärzler F, Gründer G, Machulla HJ, Bares R, Heinz A. Anxiety is associated with reduced central serotonin transporter availability in unmedicated patients with unipolar major depression: a [11C]DASB PET study. Molecular Psychiatry. 2008;13:606–613. doi: 10.1038/sj.mp.4002149. [DOI] [PubMed] [Google Scholar]
- Reivich M, Amsterdam JD, Brunswick DJ, Shiue C. PET brain imaging with [(11)C](+)McN5652 shows increased serotonin transporter availability in major depression. Journal of Affective Disorders. 2004;82:321–327. doi: 10.1016/j.jad.2003.12.014. [DOI] [PubMed] [Google Scholar]
- Ruhé HG, Booij J, Reitsma JB, Schene AH. Serotonin transporter binding with [123I]beta-CIT SPECT in major depressive disorder versus controls: effect of season and gender. European Journal of Nuclear Medicine and Molecular Imaging. 2009;36:841–849. doi: 10.1007/s00259-008-1057-x. [DOI] [PubMed] [Google Scholar]
- Scheffel U, Dannals RF, Suehiro M, Ricaurte GA, Carroll FI, Kuhar MJ, Wagner HN., Jr Development of PET/SPECT ligands for the serotonin transporter. NIDA Research Monograph. 1994;138:111–130. [PubMed] [Google Scholar]
- Staley JK, Sanacora G, Tamagnan G. Sex differences in diencephalons serotonin transporter availability in major depression. Biological Psychiatry. 2005;59:40–47. doi: 10.1016/j.biopsych.2005.06.012. [DOI] [PubMed] [Google Scholar]
- Suehiro M, Scheffel U, Dannals RF, Ravert HT, Ricaurte GA, Wagner HN. A PET radiotracer for studying serotonin uptake sites, carbon-11-McN-5652Z. Journal of Nuclear Medicine. 1993;34:120–127. [PubMed] [Google Scholar]
- Suehiro M, Wilson AA, Scheffel U, Dannals RF, Ravert HT, Wagner HN., Jr Radiosynthesis and evaluation of N-(3-[18F]fluoropropyl)-paroxetine as a radiotracer for in vivo labeling of serotonin uptake sites by PET. Nuclear Medicine Biology. 1991;18:791–796. doi: 10.1016/0883-2897(91)90019-h. [DOI] [PubMed] [Google Scholar]
- Szabo Z, Kao PF, Mathews WB, Ravert HT, Musachio JL, Scheffel U, Dannals RF. Positron emission tomography of 5-HT reuptake sites in the human brain with [11C]McN5652 extraction of characteristic images by artificial neural-network analysis. Behavioral Brain Research. 1995;73:221–224. doi: 10.1016/0166-4328(96)00100-3. [DOI] [PubMed] [Google Scholar]
- Tsai HC, Yeh TL, Hsieh MH, Lee IH, Chen KC, Chen PS, Yang YK, Yao WJ. Association between serotonin transporter availability and overall rating scores of quality of life in healthy volunteers. Progress in Neuropsychopharmacology and Biological Psychiatry. 2009;33:711–714. doi: 10.1016/j.pnpbp.2009.03.018. [DOI] [PubMed] [Google Scholar]
- Uusitalo AL, Valkonen-Korhonen M, Helenius P, Vanninen E, Bergström KA, Kuikka JT. Abnormal serotonin reuptake in an overtrained, insomnic and depressed team athlete. International Journal of Sports Medicine. 2004;25:150–153. doi: 10.1055/s-2004-819952. [DOI] [PubMed] [Google Scholar]
- Willeit M, Praschak-Rieder N, Neumeister A, Pirker W, Asenbaum S, Vitouch O, Tauscher J, Hilger E, Stastny J, Brücke T, Kasper S. [123I]-beta-CIT SPECT imaging shows reduced brain serotonin transporter availability in drug-free depressed patients with seasonal affective disorder. Biological Psychiatry. 2000;47:482–489. doi: 10.1016/s0006-3223(99)00293-0. [DOI] [PubMed] [Google Scholar]
- Williams JBW. A structured interview guide for the Hamilton Depression Rating Scale. Archives of General Psychiatry. 1988;45:742–747. doi: 10.1001/archpsyc.1988.01800320058007. [DOI] [PubMed] [Google Scholar]
- Yatham LN, Liddle PF, Dennie J, Shiah IS, Adam MJ, Lane CJ, Lam RW, Ruth TJ. Decrease in brain serotonin 2 receptor binding in patients with major depression following desipramine treatment, a positron emission tomography study with fluorine-18-labeled setoperone. Archives of General Psychiatry. 1999;56:705–711. doi: 10.1001/archpsyc.56.8.705. [DOI] [PubMed] [Google Scholar]