

Abstract
Benchmarks for molecular docking have historically focused on re-docking the cognate ligand of a well-determined protein-ligand complex to measure geometric pose prediction accuracy, and measurement of virtual screening performance has been focused on increasingly large and diverse sets of target protein structures, cognate ligands, and various types of decoy sets. Here, pose prediction is reported on the Astex Diverse set of 85 protein ligand complexes, and virtual screening performance is reported on the DUD set of 40 protein targets. In both cases, prepared structures of targets and ligands were provided by symposium organizers. The re-prepared data sets yielded results not significantly different than previous reports of Surflex-Dock on the two benchmarks. Minor changes to protein coordinates resulting from complex pre-optimization had large effects on observed performance, highlighting the limitations of cognate ligand re-docking for pose prediction assessment. Docking protocols developed for cross-docking, which address protein flexibility and produce discrete families of predicted poses, produced substantially better performance for pose prediction. Performance on virtual screening performance was shown to benefit by employing and combining multiple screening methods: docking, 2D molecular similarity, and 3D molecular similarity. In addition, use of multiple protein conformations significantly improved screening enrichment.
Introduction
The field of small molecule docking was initiated by the pioneering work of Kuntz and Blaney on rigid ligands in the 1980’s [1]. The first practical and fully automatic methods began to appear in the 1990’s, with AutoDock [2; 3], GOLD [4; 5], Hammerhead [6; 7; 8], and FlexX [9; 10]. The earliest efforts typically demonstrated successful re-docking of ligands into their cognate protein binding sites, usually with just a handful of examples, frequently including cases such as trypsin/benzamidine (3PTB), streptavidin/biotin (1STP), and DHFR/methotrexate (4DFR). With the publication of the 1997 GOLD validation paper [5], reporting pose prediction performance on 100 complexes, the scale of validation experiments for ligand pose prediction changed permanently. Publication of the independent benchmarking of docking algorithms by Rognan’s group in 2000 added virtual screening assessment (on thymidine kinase and estrogen receptor) to the types of formal assessments commonly made of docking algorithms [11]. Development of the Surflex-Dock approach (first described in 2003 [12]), the descendent of the Hammerhead system, benefited from cognate-docking benchmarks for pose prediction assessment (81 complexes derived from validation of GOLD [5]) and from benchmarks for virtual screening assessment (2 target systems, known positive ligands, and a decoy set from Rognan’s group [11]).
The early years of the new millennium saw the introduction and popularization of additional docking algorithms, with independent benchmarking becoming increasingly prevalent. Studies from Perola et al. [13] and Warren et al. [14] were particularly influential. During this same period, larger and more diverse virtual screening benchmarks were developed, notably the set of 29 screening target systems for testing scoring function optimization by Pham and Jain [15] and 40 screening targets forming the DUD set by Huang, Shoichet, and Irwin [16]. With respect to measuring pose prediction, the importance of high-quality structures was gaining prominence, highlighted by the publication in 2007 of the Astex Diverse set of 85 protein ligand complexes [17]. At the same time, the limitations of using cognate ligand re-docking were beginning to be recognized, for example by Sutherland et al. [18] and also by Verdonk et al. [19] who each developed benchmarks for assessment of non-cognate pose prediction.
A special symposium on evaluation of molecular modeling methods took place at the Fall 2007 National ACS meeting, with special attention paid to the issues governing proper assessment of docking algorithms. The meeting yielded several papers, published in a special issue of this Journal, introduced with an editorial by the symposium co-organizers Nicholls and Jain [20]. While consensus among the broader community has been elusive, several issues of central importance were identified relating to benchmark construction and statistical methodology. In the area of virtual screening evaluation, some agreement was made as to sensible statistical methods for measuring enrichment, but decoy set design approaches remained controversial. These consisted of two types: “designed” decoy sets chosen to mimic properties of a set of known actives for a particular target and “agnostic” decoy sets chosen to mimic properties of a typical small molecule screening library. In the area of pose prediction assessment, serious problems with cognate docking benchmarks were highlighted involving “memory effects” that develop when optimizing a protein’s pocket structure in the presence of the ligand to be docked as a test [21].
This paper is part of a collection devoted to a follow-up to the aforementioned symposium that took place in Spring 2011, co-organized by the authors of the lead editorial in this special issue of the Journal of Computer-Aided Molecular Design [22]. Participants were asked to present comparable data and analyses on pose prediction using the Astex Diverse set of 85 protein ligand complexes for pose prediction and on screening utility using the DUD set of 40 protein targets, along with known positive ligands and designed decoy sets for each target. Both sets involved multiple aspects of manual re-curation, especially as to the protein structures themselves.
Performance of Surflex-Dock on the re-prepared Astex85 set was not statistically significantly different than our previous application to the originally released data set [23], with success rates for single top-scoring poses within 2.0 Å RMSD ranging from 66–80% depending on input coordinate variations and run conditions and success rates for best of 20 top-scoring poses of approximately 95%. Performance of Surflex-Dock on the re-prepared DUD40 set yielded a mean ROC area of 0.72 (stdev. 0.15) and mean 1% ROC enrichment of 19 (stdev. 14.5). This was not statistically significantly different than what was reported in the independently published report of Cross et al. [24], which compared results for several docking methods. They concluded that GLIDE and Surflex-Dock were capable of superior performance in both pose prediction and in virtual screening to the other methods tested: DOCK, FlexX, ICM, and PhDock. Use of SP mode for GLIDE and enabling ring flexibility for Surflex-Dock produced the best overall results in that study.
In addition to the baseline benchmarking that provided a comparative platform for the symposium, we addressed four additional questions, two related to pose prediction and two related to virtual screening: 1) to what extent are subtle changes in protein preparation capable of yielding large improvements in nominal pose prediction performance? 2) is it possible to make use of protein pocket adaptation during the docking process to produce high quality pose prediction results? 3) is a multi-pronged strategy for virtual screening, which combines docking, 2D similarity, and 3D similarity, more robust and reliable that one method alone? 4) is it possible to make use of multiple protein conformational alternatives to improve virtual screening performance without requiring ad hoc scoring adjustments?
We observed gains in pose prediction success rates of nearly 20 percentage points by making very small changes to protein structures (typically 0.3 Å RMSD within the protein pocket) prior to docking by joint optimization of protein and cognate ligand. However, we also showed that very high success rates could be obtained using a practical procedure that adapted protein pockets during the docking process and produced pose families based on clustering and a Boltzmann weighting scheme. With respect to virtual screening, we showed that using the combination of docking and similarity approaches produced robust performance, with early enrichment of 15-fold or greater 75% of the time and overall ROC area of 0.80 or greater 60% of the time. Use of multiple alternative protein conformations was also shown to have a significant positive impact in two target systems where data were available to make direct comparisons.
Data and Methods
The primary molecular data sets for this study were obtained as part of participation in a symposium. The details of the pose prediction set, 85 complexes adapted from the Astex Diverse Set [17], which will be referred to as the Astex85 set, can be found in the lead editorial of this special issue [22]. The details of the virtual screening benchmark set, 40 targets along with nominal true ligands and designed matched decoy sets was adapted from the DUD benchmark [16], which will be referred to as the DUD40 set, can also be found in the lead editorial. For both benchmarks, substantial re-preparation of protein structures was carried out in order to provide a common set of coordinates (including hydrogen atoms) to participants. Modifications to ligand structures were quite significant for the Astex85 set, where fresh input coordinates were generated in order to fully eliminate memory effects of bound cognate ligand poses. For the DUD40 set, some targets received a degree of re-curation of positive examples of ligand structures (e.g. to address bond order errors in trypsin ligands and chirality errors in PDE5 ligands).
All docking and similarity calculations were carried out using standard protocols with Surflex-Dock and Surflex-Sim version 2.514. For pose prediction tasks on the Astex85 set, the “-pgeom” parameter set selecting the geometric docking search protocol was used, with “+ring” additionally since the input ligands coordinates often had strained ring systems. The limited protein pocket adaptation tasks were carried out using standard docking followed by pocket optimization (the “rescore_multi” command) and pose family generation (the “posefam” command) as reported in the paper introducing the Surflex-Dock pocket optimization protocol [23]. Demonstration of the effects of protein structure pre-optimization for the Astex85 set was carried out as previously illustrated on a different set initially reported by Vertex [13; 21; 25]. For virtual screening tasks on the DUD40 set, the “-pscreen” parameter set selecting the fast screening search protocol was used, and ring search was not enabled. Comparisons were also made using Surflex-Sim’s 3D surfaced-based molecular similarity approach and the Surflex 2D approach called GSIM [26; 27; 28]. For application of molecular similarity, the cognate ligand of each protein target in question was used as the target of the similarity search. We also carried out tests of the Surflex-Dock multi-structure docking protocol (the “mdock_list” command [23]) using standard screening parameters.
Data archives can be requested through www.jainlab.org.
Results and Discussion
The performance of Surflex-Dock on the Astex85 and DUD40 sets has been published previously. For the former set, using the original structures from Hartshorn et al. [17], we used the set to draw a contrast between the ease of cognate ligand re-docking compared with non-cognate docking [23]. For the latter set, a careful and comprehensive comparison of several docking programs was carried out by Cross et al. [24]. Both studies were relatively recent and made use of up-to-date Surflex-Dock versions. The modifications to the benchmarks for this symposium were not extensive, so those published results differed little from what is reported here. In what follows, first for pose prediction and then for virtual screening efficiency, we will briefly summarize the baseline results while highlighting differences from previous work. In addition, we will address questions involving protein-ligand complex pre-optimization, protein pocket adaptation as part of the docking process, use of hybrid screening approaches that combine docking and similarity computations, and use of multiple protein structural examples as the target of virtual screening.
Cognate Docking: Performance on the Astex85 Set
Table 1 reports the results of several docking runs on the Astex85 set, making use of different protein and ligand starting coordinates or run protocols. The top two rows are directly comparable. The first row shows results on the protein and ligand coordinates released by the originators of the Astex85 set [17]; these results had been reported as part of a study exploring the effects of protein conformational adaptation [23]. The second row shows results on the re-prepared Astex85 set [22]. The key differences in the protein coordinates stemmed from fresh structure refinement in the re-prepared set and optimization of proton positions using GoldScore with the cognate ligand in the original set. The key differences in the ligand coordinates stemmed from use of CORINA to produce fully agnostic memory-free ligand starting coordinates in the re-prepared set and a protocol of torsional and alignment randomization and minimization for the original set. The differences in protein coordinates yielded relatively subtle changes in the energetic landscape to be probed by ligand docking. The differences in ligand coordinates were more profound in many cases, resulting in important changes in protonation state, tautomeric state, and input ring conformations. The docking success rates (proportion of dockings with RMSD ≤ 2.0 Å) were somewhat better for the original set than for the re-prepared set (80% vs. 66% for top scoring pose and 96% vs. 93%). However, neither the success rates, nor the mean RMSD values, differed in a statistically significant manner. Figure 1 shows the comparison of the cumulative histograms.
Table 1.
Summary of results for pose prediction accuracy on Astex Diverse Set of 85 complexes.
| % Correct: Top | % Correct: Best | Mean Top RMSD (stdev) | |
|---|---|---|---|
|
| |||
| Original Astex85 | 80 | 96 | 1.66 (1.82) |
| Re-prepared | 66 | 93 | 2.18 (2.09) |
|
| |||
| Proton-optimized | 73 | 95 | 1.85 (1.88) |
| All-optimized | 84 | 95 | 1.34 (1.46) |
|
| |||
| Top pose family | 68 | - | 1.99 (2.19) |
| Top two pose families | 82 | - | 1.31 (1.56) |
| All pose families | 87 | - | 1.15 (1.37) |
Figure 1.

Comparison of results from the original Astex Diverse Set release compared with the Re-prepared Set. Differences in top-scoring pose performance were larger than for best pose of top 20, but were not statistically significant at the 2.0 Å success cutoff.
There are two key reasons that cognate ligand re-docking is an artificial test of pose prediction. First, this is never the operationally important application in a real-world use-case of docking for binding-mode prediction. In a real-world application, a modeler would choose to explore the binding mode possibilities for some ligand that is different from any whose bound configuration is known. Depending on the protein, the binding pocket may adapt in subtle or unsubtle ways, but it will generally change at least a little. So, the “memory” of the ligand expressed in the particular pocket coordinates of a protein used in a cognate docking test represent an advantage that is never present in a real-world application. Second, as we have shown before [21; 25], very small changes in protein pocket conformation, even involving just proton movement, can have a large impact on pose ranking within the top set of docking poses returned. In particular, coordinate optimization of a complex can exacerbate the memory effect already present in the cognate protein structure. To illustrate the magnitude of this effect, beginning with the re-prepared Astex85 set, for each complex, we performed joint optimization of ligand and protein binding pocket, either only for protons or including non-hydrogen protein pocket atoms as well.
We then repeated the docking computations using these protein variants. These results are summarized in the middle rows of Table 1. While little effect was seen on success rates for best pose among the top 20, a nearly 20-point increase in success percentage for the top pose was obtained using the protein variant generated with all-atom pocket optimization. The difference between 66% and 84% success rates for 85 complexes was statistically significant (p = 0.01 using Fisher’s exact test). Figure 2 shows the corresponding cumulative histograms of observed RMS deviations. The red curves correspond to the unmodified re-prepared protein coordinates (as in Figure 1). The only difference between the red and green curves was changes in proton positions for the latter, and the blue curve shows the effects of allowing non-hydrogen atoms as well to adapt to a local minimum prior to docking. The magenta curves make one additional change: measuring the RMS deviation from the optimized cognate ligand coordinates (for the all atom protocol) instead of the crystallographically modeled ones. Complex pre-optimization has a very significant impact on top-scoring pose performance, owing to the enhancement of the particular local minimum corresponding to the known bound ligand configuration. This effect derives from very small movements in protein atoms (see Figure 3). The effect of measuring from the optimized ligand coordinates has an enormous impact on the fraction of very low RMSD results, which also skews statistics involving mean RMSD. Given the uncertainty in coordinate precision for even high-quality structural models, high proportions of RMS deviation values for pose prediction less than 0.5 Å suggest this type of coordinate optimization.
Figure 2.

Optimization of protein-ligand complex prior to docking can have a significant impact on nominal pose prediction performance, especially for top-scoring pose. The two graphs show Surflex-Dock performance on the re-prepared Astex85 set under different preparation and RMSD measurement protocols (the top graph shows top pose RMSD cumulative histograms and the bottom shows corresponding information for best pose of the top 20 returned). Results on the re-prepared Astex85 set are shown in red, results for the same proteins after proton optimization in green, and all pocket atom optimization in blue. The magenta lines shows the change in RMSD when measuring deviation from the optimized ligand coordinates rather than the crystallographic coordinates for all atom pocket pre-optimization.
Figure 3.

Coordinate changes were small, especially for the protein, even with all-atom coordinate optimization of complexes. These tiny coordinate changes gave rise to significant changes in the pose ranking that result from docking to the modified proteins.
This effect has been discussed more extensively in trying to understand differences in nominal pose prediction performance among docking methods with different congruence to an energy function used for protein optimization [13; 25]. It has also been discussed in the context of the appropriateness of protein optimization and RMS deviation measurement from optimized ligand coordinates, as practiced by some methods developers [29], in a paper devoted to questions involving docking method evaluation [21]. We do not believe that such protocols produce performance estimates that will reflect real-world application of docking methods.
Unbiased Protein Atomic Movement
As we have seen, pre-optimization of protein coordinates using an energy function that is congruent to the one being used in a docking system can predispose performance results very favorably. We believe that the best approach to avoid such problems is to test pose prediction on non-cognate ligands, often termed cross-docking. We have previously shown substantial improvements on a challenging cross-docking benchmark using Surflex-Dock’s multi-protein docking protocol coupled with protein pocket adaptation and a pose clustering and rescoring technique that yields pose families [23]. To illustrate the effects of this protocol in the context of data available for the symposium from which this paper resulted, we applied it to the Astex85 set. In the full protocol, protein conformational variants representing large movements are used, but to illustrate the effects of pocket adaptation on the Astex85 set, only the single re-prepared protein structure for each complex was used.
Figure 4 illustrates the procedure with the test complex corresponding to PDB code 1JJE. In this example, the top scoring pose from Surflex-Dock using the standard protocol was incorrect, shown in atom color at top-left along with the correct pose shown in yellow. The ligand is partially symmetric, and the top-ranked pose is a flip that places the metal-interacting moieties correctly. The Surflex-Dock pocket adaptation protocol optimizes the final docking poses within the protein pocket while allowing the pocket atoms to move, subject to a covalent force-field as well as inter-molecular scoring energy terms that govern the docking. To enhance sampling, multiple small perturbations may be carried out for each pose (in this case, two perturbation were used). A score that represents the overall energy of ligand, protein pocket, and their non-bonded interactions (with each other and among themselves) is computed for each jointly optimized configuration. The resulting ligand poses are clustered based on RMSD, and a Boltzmann-based formula is used to apportion percentages to each such pose family, with families that have too low a percentage eliminated from the output. For the example in Figure 4, there were three families generated, with the top family accounting for 93.5% of the expected joint configurations, the second family 6.5%, and the last one just 0.001%. By taking into account the overall energetics of the complex, the top family (bottom left) now clearly contains the experimentally determined pose. The original ranks of the poses that gave rise to the top family were 5, 6, and 9. The second ranked family arose from the top 3 original poses, and shows the flipped orientation of the ligand. The atomic movements of the protein (green for the top family and red for the second-ranked one) were small, but sufficient to produce the correct ranking.
Figure 4.

Use of protein pocket optimization and pose family generation offers a means to explore changes in protein pocket configuration on ligand binding in a way that is not biased. The top-left panel shows the single top scoring pose (atom color) for test case 1JJe, which was a flip of the crystallographic pose (yellow). The top scoring pose family (bottom left, atom color) was correct, resulting from rescoring after jointly optimizing the docked ligand poses, which resulted in some protein movement (green). The second ranked pose family (bottom right) required slightly more alteration of the protein binding pocket, especially at the left-hand side (red).
An advantage of this procedure is that one gains some degree of information as to the uncertainty in the pose prediction. This is reflected in the amount of movement exhibited by the ligand within each pose family and also by the number of pose families produced. Figure 5 shows an example (PDB code 1SJ0) where there was a flexible ring system in the ligand in question. The ligand coordinates used as input for docking contained a reasonable ring conformation, but it was incompatible with the correct binding mode. The middle panel shows the resulting docking without ring search for illustration only. With ring search enabled (as it was for the primary results for pose prediction), and making use of the pocket adaptation procedure, a single pose family was produced (bottom panel of Figure 5), which clearly encompassed the correct binding mode. The pose within the family that had the smallest RMS deviation was within 0.6 Å of the experimentally determined ligand coordinates. A single pose family was generated for 20 of the 85 complexes. For this group, the mean RMSD was 0.77 ± 0.62, with 95% (19/20) having RMSD ≤ 2.0 Å. The bottom rows of Table 1 summarize results for the pocket adaptation protocol. The top ranked pose family produced just a marginal improvement over the original docking protocol, but by considering the top two families, the success rate improved from 66% to 82%. When considering all pose families that were produced, we observed a success rate of 87% (p ≪ 0.01, compared with 66% success by Fisher’s exact test). Figure 6 shows the cumulative histograms for the top and top-two pose family results. Without relying on the fortune of well-oriented protein pocket hydrogen atoms, we observed very strong results, especially for the two pose family case, but even in the single family case, there were significant improvements at low RMSD.
Figure 5.
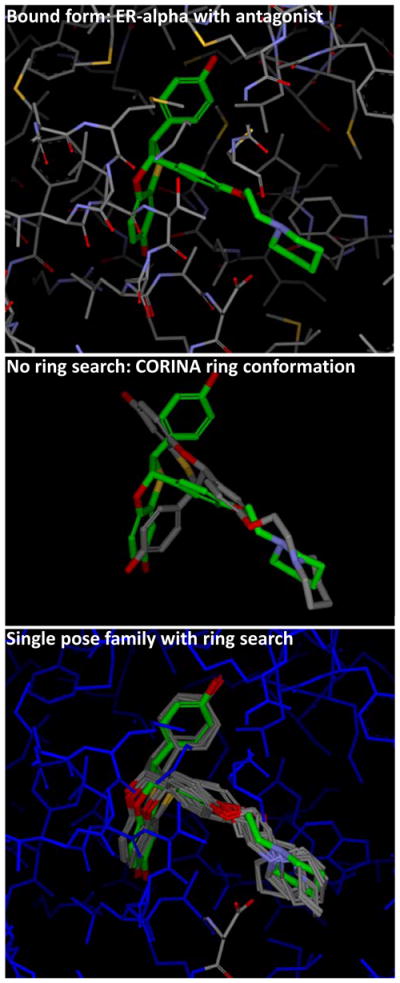
The combination of Surflex-Dock’s ring search and pocket adaptation and pose family protocol rescued a poor result using the given ligand coordinates (middle panel), yielding a single pose family (bottom panel), which closely covered the crystallographically determined ligand pose (green). Cases where only a single pose family were generated yielded correct results 95% of the time (see text for details).
Figure 6.

Results applying protein flexibility during the docking process show an improvement when considering only the top scoring pose family (blue) over results on the re-prepared set using the standard docking protocol (red), especially at low RMSD values. The gain obtained by looking at the top two pose families was very substantial (magenta line), reflecting the common occurrence of “flips” of pseudo-symmetric ligands that received very close scores. Consideration of all pose families generated (cyan line) yielded a further small gain. More than 90% cases produced five or fewer families.
Clearly, results for a single top-ranked pose and those produced when considering multiple families are of a different type. However, we believe that the modeling question addressed by pose prediction with docking is better matched to examining a small number of pose families, each associated with a percentage of coverage, than it is to examining a single pose. For the Astex85 set, 24% of the cases produced a single family, 45% produced two or fewer families, 68% three or fewer, and less than 10% produced more than five (with a maximum of seven). The type of alternative flip shown in Figure 4, where the ligand is pseudo-symmetric and where both orientations appear plausible, represent the most common variations among the different pose families. Typically, a key interaction is common among the different alternatives, with the pose families stimulating development of new hypotheses for where interaction opportunities may exist. There were also examples, as with PDB code 1U1C, where the complexes were highlighted as having poor ligand density. This case is depicted in Figure 7. The top-scoring pose family was “incorrect” (middle panel) but the second-ranked one was “correct” (bottom panel). The two alternatives were symmetrically flipped around a central axis, but the alternatives may not be definitively distinguished by the crystallographic data. Even if the nominally correct pose represents a truly better energetic configuration in the real biological system, we believe that the alternate binding mode is informative, suggesting the potential for hydrophilic interactions with the left-hand side of the pocket.
Figure 7.

PDB code 1U1C was a test case where ligand density was poor (the top panel shows the nominal bound configuration). The middle panel shows the top scoring pose family, which was a flipped orientation around the central symmetric ring system relative to the second ranked pose family (bottom panel). It was not clear whether the crystallographic data could reliably distinguish these two alternatives.
Summary
Our analysis of performance of Surflex-Dock on the Astex85 set makes four primary points. First, the minor differences in set preparation made little difference in pose prediction performance, with the bulk of the difference probably arising from the use of a different randomization protocol for ligand starting configuration in the re-prepared set compared with the original set. Second, cognate re-docking of ligands as a means to test pose prediction is fraught with difficulty, since it is so dependent on the congruence between the means used for protein structure preparation and the method to be used for docking. Use of coordinate optimization schemes that make small and benign changes to protein coordinates can produce very significant changes in the ranking of poses whose energies are close. Third, since it is clearly necessary to address protein atomic movement in order to produce useable results for cross-docking, continued use of rigid protein cognate-docking tests is difficult to support. Last, judging performance based on the deviation between the single top-ranked pose and the experimentally determined one is much less informative than considering some form of pose clustering. Such techniques usually yield few distinct solutions, the vast majority of which are reasonable, with the number of solutions related to the confidence in pose prediction.
Virtual Screening: Performance on the DUD40 Set
It is useful to place the development of the DUD set in context. Introduced in 2007 [16], it was meant to address two significant problems in assessment of docking for the purpose of virtual screening. First, issues had been raised with respect to the physical characteristics of decoy sets and the ease with which one could distinguish active ligands from such decoys. Notably, the set from Rognan’s group [11] was characterized by many, not unfairly, as being too hydrophobic compared with drug-like compounds. Second, other virtual screening benchmarks had either limited numbers of active ligands for each target or had limited numbers of targets, or both. The largest such set at the time was that from Pham and Jain [15], consisting of 29 targets, but with a maximum of 20 ligands per target. That report included two decoy sets: the Rognan set (990 molecules) as well as one derived from screening molecules meant to have similar properties to drug leads (1000 molecules). The DUD set had more targets (40), more active ligands per target (an average of about 70), and a design-based approach to constructing decoys. For each target, the idea was to come up with 40 decoys per active ligand that replicated aspects of physical characteristics but avoided 2D molecular similarity to any of the known actives. Experiments using DOCK were carried out with all ligands and decoys against all 40 protein targets. Comparisons were also made between the DUD decoys and other decoy sets, with the largest differences existing between the amalgamated (or global) DUD set of 95,316 decoys and the Rognan set. It is worth noting that the authors of the DUD set advocated using both the “own decoys” (here termed “self decoys”) and “amalgamated DUD” (here termed “global decoys”), since they represent different challenges [16].
Table 2 summarizes results for virtual screening assessment on the DUD40 set, both using the self decoys and the global decoys for Surflex-Dock, Surflex-Sim 3D molecular similarity, and for the GSIM 2D similarity metric. The results we obtained for Surflex-Dock using the DUD self decoy set on the re-prepared DUD40 set did not differ from those reported recently by Cross et al. on the original DUD set [24]. One striking feature was that while ROC AUC did not change much when comparing self decoy results to global decoy results (typical shifts in mean AUC of just 0.04), the typical early enrichments (measured using ROC 1% true-positive to false-positive ratios) nearly doubled. Data are presented in more detail in Figure 8, showing the dramatic improvement in early enrichment when using the global decoy set (top two graphs). For both docking and 3D similarity, early enrichments of greater than 45-fold were observed in roughly one-third of cases. It is also important to note that simple 2D similarity searching performed very well owing to the common occurrence extreme topological similarity of DUD actives to be retrieved compared with the cognate ligand of the protein structural target. This issue has been analyzed in greater detail previously [27], especially concerning the use of DUD in evaluating molecular similarity methods. To better approximate the real-world application of virtual screening, we also evaluated the performance of the combination of docking, 2D, and 3D similarity. Information from the three methods was combined by computing the product of the resulting ranks for each ligand. On a target-by-target basis, the hybrid approach was always better than the worst of the individual approaches, with mean improvement in AUC of 0.13 ± 0.08. The hybrid approach was generally slightly worse than the best of the individual approaches, with mean decrease in AUC 0.07 ± 0.11. Notably, the hybrid approach never performed worse than the most poorly performing individual technique, but it performed slightly better than the best individual technique nearly 20% of the time.
Table 2.
Summary of results for virtual screening performance on DUD set of 40 targets.
| Self Decoys | Global Decoys | |||
|---|---|---|---|---|
|
| ||||
| ROC Area (stdev) | 1% Enrichment (stdev) | ROC Area (stdev) | 1% Enrichment (stdev) | |
|
| ||||
| Docking | 0.72 (0.15) | 19 (14.5) | 0.76 (0.18) | 28 (31.2) |
| 2D Similarity | 0.77 (0.17) | 26 (21.5) | 0.81 (0.17) | 43 (34.6) |
| 3D Similarity | 0.65 (0.23) | 21 (20.5) | 0.73 (0.23) | 35 (32.3) |
| Combined | - | - | 0.79 (0.19) | 38 (32.9) |
Figure 8.

Performance on DUD virtual screening benchmark using self decoys and global decoys. The top two graphs show 1% ROC enrichment performance for docking, 3D molecular similarity, and 2D molecular similarity. The bottom two graphs show the corresponding ROC areas, with the bottom right graph also including a comparison to results from a previous study on 27 screening targets. Marked differences in early enrichment (highlighted in yellow at the 45-fold level) were observed, with performance on the global decoys very significantly better. Overall ROC areas changed much less, but the DUD40 set produced poorer docking performance than the Pham/Jain set.
One other aspect of note in Figure 8 is that the performance of Surflex-Dock on the Pham/Jain screening set was significantly better than on the DUD40 set. ROC AUC was greater than 0.80 about 75% of the time for the former set compared with just 40% of the time for the latter. This was also reflected in early enrichment rates, with early enrichment of 20-fold or better in 80% of cases for the Pham/Jain set [15] compared with less than 40% of cases for the DUD40 set. In order to understand these differences, we compared the active and decoy structures for each target to ligands bound to those same targets whose structures were available in the PDB. Figure 9 highlights the risks involved in designing decoys to look similar to known actives. In the top case, one of the GART decoys is shown in an experimentally determined co-crystal structure with GART. Many of the GART decoys were trivial analogs of the ligand in the 1CDE structure, and it is likely that many of those molecules have reasonable affinity for the GART protein. Similarly, the thymidine kinase decoys include one where an epimer is known to bind TK. While it may be the case that the epimer that was present in the decoy data set does not bind TK at all, we believe this to be unlikely. Further, the extreme similarity of many of the nominal TK decoys to known active TK ligands is of concern. We believe that a very significant portion of the difference between early enrichment performance when comparing DUD self to DUD global decoys stems from “false false positives” as shown in Figure 9. At best, such decoys blur the line between potency prediction, where distinctions of 1 kcal/mol are important, and virtual screening, where the expectation is to distinguish larger energy differences. In our comparison of DUD actives to the known, bound configurations that could be found in the PDB, we observed a nearly 1 in 6 rate of unrecoverable structural variations, where changes in chirality were present or bond order variations existed that were not due to tautomerism. We believe that such errors help explain the difference in overall ROC area between the DUD40 set and the Pham/Jain set.
Figure 9.

Use of designed decoy data sets, which attempt to mimic properties of active ligands bears the risk of inclusion of active molecules within decoy pools. Typical examples of actives and self decoys from the DUD40 set for GART and TK are shown. In the case of GART, the top decoy is shown crystallized with the enzyme that it is not supposed to inhibit (top right). In the case of TK, an epimer of the top left decoy is shown crystallized with TK.
Multiple Protein Structures
In keeping with the idea of trying to ascertain real-world performance, we made a limited attempt to test the effects of using multiple alternative protein structures as the target of virtual screening. To the degree that multiple structures are available for a target that exhibits active site mobility, many modelers would try to take advantage of the additional data. In the case of PDE5 (where active ligand structures had been corrected by the symposium organizers prior to release), there was a large improvement: from ROC area of 0.72 ± 0.06 with a single structure to 0.83 ± 0.06 with four (95% confidence intervals just barely overlapping). The three additional structures (PDB codes 1T9S, 1TBF, and 1XOZ) were chosen and aligned based on a recently published pocket similarity computation patterned after the Surflex-Sim approach [30]. Figure 10 shows the primary driver of the improvement: a large positive shift in the scores of the active ligands. The left panel shows a nearly 2 log unit increase in the scores of the 51 known active ligands. The middle panel shows the docked pose of one such active molecule (ZINC04199926 shown in yellow) compared to the bound pose of tadalafil (green). The single original DUD target structure was of PDE5 bound to vardenafil, but the ligand in question has a binding mode much more compatible with the active site rearrangement of PDE5 when bound to tadalafil. The rightmost panel shows the poor predicted poses (shown in red) of the yellow molecule from the middle panel resulting from docking to only the vardenafil-bound PDE5 structure. The poses were clearly wrong, and the scores were much lower than for those making use of the four alternate protein structures, none of which were bound to a ligand sharing the scaffold of the yellow molecule.
Figure 10.

Using multiple target protein structures can be helpful, especially in cases like PDE5, where significant rearrangement can occur. The positive ligand ZINC4199926 (shown in 2D at left) scored 10.1 in the multi-structure docking but just 7.6 in the single-structure protocol. Its predicted pose from the multi-structure protocol (middle, shown in yellow) shows a clear relationship to the related PDE5 inhibitor tadalafil (green). Poses from the single-structure protocol (right, shown in red) were very different and likely incorrect. In this case, ROC area improved from 0.72±0.06 to 0.83±0.06 (95% confidence intervals) using the multi-structure protocol instead of single-structure.
In considering making a broader evaluation of this approach, difficulties with curated structures of known active ligands within the DUD40 set presented a serious obstacle. For example, in the case of progesterone receptor (PR), where we expected to see benefits due to rearrangements of the ligand binding domain on binding agonists compared to antagonists, application of the same approach as just shown for PDE5 yielded no improvement: original ROC area of 0.48 and a multi-structure ROC area of 0.46, both indistinguishable from random performance. Of the 27 active ligands, 8 had steroid cores. Of these, 6 were clearly wrong in terms of the chiral configuration of the steroid core. We re-curated a set of 11 active ligands for PR from the PDB, taking care to regenerate the ligand structures from SMILES to avoid any memory of bound configurations. Using the single original DUD protein target structure (with global decoys), we obtained an ROC area of 0.52 ± 0.19. Using three additional structures (1SQN, 2OVM, and 3G8N) chosen as with PDE5, we obtained 0.87 ± 0.10, a clearly significant improvement. An example of this improvement is shown in Figure 11.
Figure 11.

A non-steroidal progesterone partial agonist (2D shown at left) was docked with a high score in the multi-structure protocol (middle, shown in yellow carbons). The predicted pose was close to correct (PDB code 3KBA, not shown). It was docked with a low-scoring and incorrect pose in the single-structure protocol (right, shown in red carbons). In both panels, a crystallographically determined steroid structure is shown in green to provide binding-site context.
Use of WOMBAT curated active ligands, which were made available for several targets, did not yield significant performance changes using the standard protocol. No attempt was made to assess error rates in structures within that set.
Summary
Virtual screening using molecular docking is clearly still a significant computational challenge, with highly variable performance depending on the target in question. We have shown that a combination of docking, 2D, and 3D molecular similarity is an attractive approach, exhibiting performance close to the best of any individual method and reliably better performance than the poorest. This approach can be applied to any methodology that produces a ranked list of ligands. Preliminary results indicate that use of multiple target structures can produce marked improvements in screening effectiveness.
Construction of quality benchmarks with numerous targets of diverse character is a serious challenge. We believe that the risks of “designed” decoy sets far outweigh the potential benefits of agnostic sets built to mimic lead-like screening libraries. In particular, presence of decoys that are, in fact true ligands, or whose distinction from being true ligands is a subtle difference in binding energy, artificially decreases estimates of early enrichment. Curation of active ligands must also be done with care. While it may be reasonable for docking systems to begin to cope with internal generation of tautomers or protonation states for ligands, it is not reasonable to expect frank structural errors to be corrected in any fashion by a docking algorithm. Such errors can depress overall ROC AUC values, and they can mask the true effects of algorithm modifications, such as we demonstrated with multi-structure docking.
Conclusions
The field of docking is mature enough to move beyond cognate ligand re-docking, which was introduced more than twenty years ago, as a means to test pose prediction accuracy. Certainly, sets such as the Astex85 set form important resources for methods developers, especially in establishing the baseline feasibility of a new technique. However, cognate docking does not replicate the real-world scenario that is relevant to pose prediction: the case where a new ligand is sufficiently different from the structure of one whose bound configuration is known that a skilled modeler has a serious question about potential binding modes. There are well-curated public benchmarks that address this problem in various degrees of difficulty [18; 19; 23], and docking researchers should make an active effort to move away from cognate ligand re-docking.
Data resources to support construction of well-curated benchmarks for measurement of virtual screening performance have evolved to allow for significant improvement over the currently available set of benchmarks. Resources such as BindingDB and PubChem in particular offer well-curated ligand structure and activity data [31; 32]. With the ascendance of sophisticated 3D molecular similarity methods as serious alternatives or adjuncts to docking, both for pose prediction and for virtual screening [26; 27; 28; 33; 34; 35; 36], it is increasingly important to develop such benchmarks. In particular the diversity ligands should be high, and the binding affinities should be typical of verified hits from physical high-throughput screening campaigns.
Acknowledgments
The authors gratefully acknowledge NIH for partial funding of the work (grant GM070481) and Ann Cleves for comments on the manuscript. Dr. Jain has a financial interest in BioPharmics LLC, a biotechnology company whose main focus is in the development of methods for computational modeling in drug discovery. Tripos Inc. has exclusive commercial distribution rights for Surflex-Dock and Surflex-Sim, licensed from BioPharmics LLC.
References
- 1.Kuntz ID, Blaney JM, Oatley SJ, Langridge R, Ferrin TE. J Mol Biol. 1982;161:269. doi: 10.1016/0022-2836(82)90153-x. [DOI] [PubMed] [Google Scholar]
- 2.Goodsell DS, Olson AJ. Proteins. 1990;8:195. doi: 10.1002/prot.340080302. [DOI] [PubMed] [Google Scholar]
- 3.Goodsell DS, Morris GM, Olson AJ. J Mol Recognit. 1996;9:1. doi: 10.1002/(sici)1099-1352(199601)9:1<1::aid-jmr241>3.0.co;2-6. [DOI] [PubMed] [Google Scholar]
- 4.Jones G, Willett P, Glen RC. J Mol Biol. 1995;245:43. doi: 10.1016/s0022-2836(95)80037-9. [DOI] [PubMed] [Google Scholar]
- 5.Jones G, Willett P, Glen RC, Leach AR, Taylor R. J Mol Biol. 1997;267:727. doi: 10.1006/jmbi.1996.0897. [DOI] [PubMed] [Google Scholar]
- 6.Welch W, Ruppert J, Jain AN. Chem Biol. 1996;3:449. doi: 10.1016/s1074-5521(96)90093-9. [DOI] [PubMed] [Google Scholar]
- 7.Jain AN. J Comput Aided Mol Des. 1996;10:427. doi: 10.1007/BF00124474. [DOI] [PubMed] [Google Scholar]
- 8.Ruppert J, Welch W, Jain AN. Protein Sci. 1997;6:524. doi: 10.1002/pro.5560060302. [DOI] [PMC free article] [PubMed] [Google Scholar]
- 9.Rarey M, Kramer B, Lengauer T, Klebe G. J Mol Biol. 1996;261:470. doi: 10.1006/jmbi.1996.0477. [DOI] [PubMed] [Google Scholar]
- 10.Rarey M, Kramer B, Lengauer T. J Comput Aided Mol Des. 1997;11:369. doi: 10.1023/a:1007913026166. [DOI] [PubMed] [Google Scholar]
- 11.Bissantz C, Folkers G, Rognan D. J Med Chem. 2000;43:4759. doi: 10.1021/jm001044l. [DOI] [PubMed] [Google Scholar]
- 12.Jain AN. J Med Chem. 2003;46:499. doi: 10.1021/jm020406h. [DOI] [PubMed] [Google Scholar]
- 13.Perola E, Walters WP, Charifson PS. Proteins. 2004;56:235. doi: 10.1002/prot.20088. [DOI] [PubMed] [Google Scholar]
- 14.Warren GL, Andrews CW, Capelli AM, Clarke B, LaLonde J, Lambert MH, Lindvall M, Nevins N, Semus SF, Senger S, Tedesco G, Wall ID, Woolven JM, Peishoff CE, Head MS. J Med Chem. 2006;49:5912. doi: 10.1021/jm050362n. [DOI] [PubMed] [Google Scholar]
- 15.Pham TA, Jain AN. J Med Chem. 2006;49:5856. doi: 10.1021/jm050040j. [DOI] [PubMed] [Google Scholar]
- 16.Huang N, Shoichet BK, Irwin JJ. J Med Chem. 2006;49:6789. doi: 10.1021/jm0608356. [DOI] [PMC free article] [PubMed] [Google Scholar]
- 17.Hartshorn MJ, Verdonk ML, Chessari G, Brewerton SC, Mooij WT, Mortenson PN, Murray CW. J Med Chem. 2007;50:726. doi: 10.1021/jm061277y. [DOI] [PubMed] [Google Scholar]
- 18.Sutherland JJ, Nandigam RK, Erickson JA, Vieth M. J Chem Inf Model. 2007;47:2293. doi: 10.1021/ci700253h. [DOI] [PubMed] [Google Scholar]
- 19.Verdonk ML, Mortenson PN, Hall RJ, Hartshorn MJ, Murray CW. J Chem Inf Model. 2008;48:2214. doi: 10.1021/ci8002254. [DOI] [PubMed] [Google Scholar]
- 20.Jain AN, Nicholls A. J Comput Aided Mol Des. 2008;22:133. doi: 10.1007/s10822-008-9196-5. [DOI] [PMC free article] [PubMed] [Google Scholar]
- 21.Jain AN. J Comput Aided Mol Des. 2008;22:201. doi: 10.1007/s10822-007-9151-x. [DOI] [PubMed] [Google Scholar]
- 22.Warren G, McGaughey GB, Nevins N. Journal of Computer-Aided Molecular Design. 2011 [Google Scholar]
- 23.Jain AN. J Comput Aided Mol Des. 2009;23:355. doi: 10.1007/s10822-009-9266-3. [DOI] [PMC free article] [PubMed] [Google Scholar]
- 24.Cross JB, Thompson DC, Rai BK, Baber JC, Fan KY, Hu Y, Humblet C. J Chem Inf Model. 2009;49:1455. doi: 10.1021/ci900056c. [DOI] [PubMed] [Google Scholar]
- 25.Jain AN. J Comput Aided Mol Des. 2007;21:281. doi: 10.1007/s10822-007-9114-2. [DOI] [PubMed] [Google Scholar]
- 26.Cleves AE, Jain AN. J Med Chem. 2006;49:2921. doi: 10.1021/jm051139t. [DOI] [PubMed] [Google Scholar]
- 27.Cleves AE, Jain AN. J Comput Aided Mol Des. 2008;22:147. doi: 10.1007/s10822-007-9150-y. [DOI] [PubMed] [Google Scholar]
- 28.Jain AN. J Med Chem. 2004;47:947. doi: 10.1021/jm030520f. [DOI] [PubMed] [Google Scholar]
- 29.Halgren TA, Murphy RB, Friesner RA, Beard HS, Frye LL, Pollard WT, Banks JL. J Med Chem. 2004;47:1750. doi: 10.1021/jm030644s. [DOI] [PubMed] [Google Scholar]
- 30.Spitzer R, Cleves AE, Jain AN. Proteins. 2011;79:2746. doi: 10.1002/prot.23103. [DOI] [PMC free article] [PubMed] [Google Scholar]
- 31.Chen X, Lin Y, Liu M, Gilson MK. Bioinformatics. 2002;18:130. doi: 10.1093/bioinformatics/18.1.130. [DOI] [PubMed] [Google Scholar]
- 32.Wang Y, Xiao J, Suzek TO, Zhang J, Wang J, Bryant SH. Nucleic Acids Res. 2009;37:W623. doi: 10.1093/nar/gkp456. [DOI] [PMC free article] [PubMed] [Google Scholar]
- 33.Perkins E, Sun D, Nguyen A, Tulac S, Francesco M, Tavana H, Nguyen H, Tugendreich S, Barthmaier P, Couto J, Yeh E, Thode S, Jarnagin K, Jain AN, Morgans D, Melese T. Cancer Res. 2001;61:4175. [PubMed] [Google Scholar]
- 34.Jain AN. J Comput Aided Mol Des. 2000;14:199. doi: 10.1023/a:1008100132405. [DOI] [PubMed] [Google Scholar]
- 35.Hawkins PC, Skillman AG, Nicholls A. J Med Chem. 2007;50:74. doi: 10.1021/jm0603365. [DOI] [PubMed] [Google Scholar]
- 36.Nicholls A, McGaughey GB, Sheridan RP, Good AC, Warren G, Mathieu M, Muchmore SW, Brown SP, Grant JA, Haigh JA, Nevins N, Jain AN, Kelley B. J Med Chem. 2010;53:3862. doi: 10.1021/jm900818s. [DOI] [PMC free article] [PubMed] [Google Scholar]