

Abstract
Background
Clinical and experimental studies have traditionally focused on understanding the mechanisms for why a heart fails. We hypothesize that the pathways involved with myocardial recovery are not simply the reverse of those that cause heart failure. However, determining when and how a decompensated heart can recover remains unknown.
Methods
Male C57BL/6 mice underwent minimally invasive aortic banding for 3, 4, or 6 weeks with or without subsequent band removal for one week (debanding). Physiologic and genomic characterization was performed with intracardiac pressure-volume recordings, rt-PCR, and microarray analysis.
Results
Heart weight/body weight ratios and PV loops demonstrated a transition from compensated left ventricular hypertrophy to decompensated heart failure between 3 and 4 weeks. Pressure-relief afforded by debanding allowed functional recovery and normalization of LVH after both 3 and 4, but not 6 weeks of banding. Whole genome microarrays demonstrated 397 genes differentially expressed in recovered hearts, 250 genes differentially expressed in the nonrecoverable (6 week) hearts, and only 10 genes shared by both processes. In particular, altered expression patterns of apoptotic and metalloproteinase genes correlated with the heart's ability to functionally recover.
Conclusions
This clinically-relevant model (1) allows us to temporally and mechanistically characterize the failing heart, (2) demonstrates a unique genomic signature that may predict when a failing heart can recover following pressure relief, and (3) will prove useful as a template for testing therapeutic strategies aimed at recovery of the failing heart.
Keywords: heart failure, hypertrophy, TAC, pressure-overload, physiologic genomics, myocardial remodeling, animal model
Introduction
Heart failure (HF) remains a highly morbid and increasingly prevalent disease. A fundamental weakness in impacting this disease is a translational disconnect. That is, the majority of experimental efforts center on preventing development or halting progression of HF, whereas clinicians are challenged by caring for patients with existing, and often, advanced disease. While many basic studies have examined factors involved with remodeling [1–3], few have focused exclusively on reverse remodeling. Several reversible animal models of left ventricular hypertrophy (LVH) and HF exist including anemia, hyperthyroidism, aortocaval fistulae, and infusion of angiotensin II and isoproterenol [4–7]. Yet, these models do not fully account for the important link between hypertension and HF that is supported epidemiologically and clinically [8]. As such, we and others are particularly interested in the changes that occur with pressure-overload. Although the transverse aortic constriction (TAC) method is routinely used to create LVH, the idea of removing the mechanical burden by removal of the constrictive band, albeit conceptually attractive, has not widely been examined. A murine study demonstrated normalization of atrial natriuretic peptide and collagen I and II after relief of pressure-induced LVH [9]. Distinct genes associated with regression were also identified in a rat model of pressure-relief [10]. Similarly, we have previously reported a technique whereby removal of a previously placed aortic constrictive band can reverse murine left ventricular hypertrophy [11, 12].
Unfortunately, existing models of LVH regression do not account for the variability of physiologic function that we encounter in patients with HF. An emerging area for the study of reverse remodeling in failing human hearts is derived from paired LV samples taken from patients undergoing left ventricular assist device (LVAD) placement and subsequent heart transplantation [13, 14]. Although serial examination of a single patient's LV tissue represents a unique opportunity, its use as a widespread mechanistic tool for reverse remodeling is limited by small numbers, heterogeneity of tissues, and diversity of patient disease. Importantly, LVADs are typically used in the most advanced forms of HF, thus excluding the majority of patients that have treatable HF. Thus, many questions regarding cardiac recovery remain including, what makes some hearts recover when others continue to fail, and is there a point when a failing heart no longer has a chance to recover. Herein, we extend our previous work with regression of murine LVH to provide a unique approach for studying myocardial failure and recovery that allows us to physiologically and genomically characterize cardiac recovery.
Material and Methods
Surgical model and experimental design
In accordance with an institutionally approved IACUC protocol, minimally-invasive transverse arch banding and debanding were performed in 10-week-old C57BL6 male mice (Charles River Laboratories, Wilmington, MA) as previously described [12]. In brief, animals were anesthetized using inhaled isoflurane by facemask. A midline neck incision was used to approach the anterior mediastinum. The transverse arch was identified and a constrictive band was placed and tightened to the approximate diameter of a 27 gauge needle. Appropriate placement of the band was verified by evaluation of carotid artery dopplers both before and after placement of the aortic band. Adequate banding was accepted when the Doppler velocity ratio doubled from right to left carotid arteries.
Animals were randomly assigned to three Banded groups: 3 week Band, 4 week Band, and 6 week Band (n=5 per group). In addition to the 3 Banded groups, animals were randomly assigned to 3 Debanded groups: 3 week Band/1 week Deband, 4 week Band/1 week Deband, and 6 week Band/1 week Deband (n=5 per group). Animals in the Deband groups had initial procedures identical to those for the Band animals. At the designated week, the aortic band was removed, referred to as Debanded. Deband animals were sacrificed one week following the deband procedure for all evaluations (Figure 1). Prior to any experimentation the mice were housed in the same cubicle in a DLAM facility with 12 hour light cycling and ad libitum access to water and chow.
Figure 1.

Experimental design and animal groupings. To determine the physiologic and genomic profiles in compensated, decompensated, and recovered hypertrophic hearts, mice underwent trans-aortic constriction (TAC) at 8 weeks of age for 3, 4, or 6 weeks. A subset of these animals underwent band removal (debanding) for 1 week prior to sacrifice (3, 4, and 6 week debanded groups).
Cardiac function analysis
Immediately prior to sacrifice, animals in all 6 groups (3 week Band, 4 week Band, 6 week Band, 3 week Band/1 week Deband, 4 week Band/1 week Deband, and 6 week Band/1week Deband) underwent pressure-volume loop analysis in a closed-chest method with a 1 Fr Millar Catheter PVR-1045 (Millar Instruments, Houston, TX) as previously described [15]. Pressure-volume loops were recorded using Labview 7.1 Software (National Instruments, Austin, TX) and analyzed with PVAN (Millar Instruments).
RNA extraction and microarray analysis
At time of animal sacrifice, hearts were rapidly excised and the left ventricular apices were sectioned and flash frozen in liquid nitrogen for gene array analysis. Total RNA was extracted from murine cardiac tissue using the Qiagen RNeasy Minikit (Quiagen, Valencia, CA) in accordance with the manufacturer's instructions including the optional DNase step. RNA integrity was verified by assay on an Agilent BioAnalyzer 2100. Five hundred nanograms of total RNA was labeled with Cyanine-5 CTP in a T-7 transcription reaction using the Agilent Low Input Linear RNA Amplification/Labeling System. Labeled cRNA from test samples was hybridized to Agilent G4122F Mouse Whole Genome 4 × 44K microarray slides in the presence of equimolar concentrations of Cyanine-3 CTP labeled Human Universal Reference RNA [16].
Realtime PCR
Extracted RNA was converted to cDNA using a High-Capacity cDNA Archive kit (Applied Biosystems International, Foster City, CA). Expressed genes were amplified using TaqMan polymerase, TaqMan-matched probes and primers (ABI). Expressed genes evaluated included myosin heavy chain (b-MHC), brain natriuretic peptide (BNP), skeletal muscle alpha1-actin (ACTA-1), collagen type 1 alpha 1 (COL1a1), B-cell leukemia/lymphoma 2 (Bcl2), Bcl2-associated X protein (BAX), TNF receptor-associated factor 6 (TRAF6), bacloviral IAP repeat-containing 3 (BIRC3), tissue inhibitor of metalloproteinase 1 (TIMP1), and matrix metalloproteinase 9 (MMP9). 18s rRNA served as an internal control. Real-time PCR was performed using an ABI 7900 instrument (Applied Biosystems). Relative quantification results were obtained using SDS 2.2.2 software (Applied Biosystems).
Statistical methods
All physiologic data are presented as mean +/− standard error (SE) except where noted. Real-time PCR data were log transformed prior to comparison. All comparisons of physiologic data were performed using 2-tailed, type 3 or type 1 t-tests using the statistical software Prism 4 (Graph Pad, San Diego, CA). Statistical significance was accepted within the 95% confidence interval.
Microarray data (n=4/experimental group) were loess normalized [17] and probes were filtered for features having a normalized intensity of < 30 aFU in either channel, then a probe was removed if <70% of the data were present across all samples. Missing data points were imputed using the k nearest-neighbors algorithm (k = 3). Duplicate probes were collapsed to a single datapoint representing the mean expression ratio of each duplicate probe. 30,752 probes passed these filters, and were subsequently used for analysis. Scripts written in the R Statistical Language and Environment (“R”; Version 2.2.1, build r36812, release date 2005-12-20.) and Perl (ActiveState Perl 5.8.1, build 807, release date 2003-11-6) were used to standardize (μ = 0, σ=1) the data set.
Lists of differentially expressed genes were identified using the statistical analysis of microarray algorithm (“SAM”, Version 2.21, release date 2005-8-24) [18–20]. Analysis was performed with a typical false discovery rate of 10%, a combination of heteroscedastic Student's T-test and mean fold change expression criteria (p value < 0.05, absolute mean fold change (MFC) > 1.3), and custom R scripts written in our laboratory. Unsupervised, semi-supervised, and supervised clustering analysis was performed on gene lists essentially as described using Cluster (Version 2.11, http://rana.lbl.gov/EisenSoftware.htm) [21]. Heatmaps of cluster analyses were visualized with JavaTreeView (Version 1.0.12, release date 2005-3-14; http://sourceforge.net/projects/jtreeview/). High-level pathway analysis was performed with the Molecular Signatures Database [22].
Results
Physiologic Characteristics of Progression to Hypertrophic Heart Failure and Recovery
In order to standardize pressure loading and unloading within our model, carotid artery Doppler velocities were used to verify adequate constriction and relief of transverse arch banding and debanding, respectively. As previously observed [11, 12], banding increased the right-to-left carotid velocity ratios. Doppler analysis prior to debanding demonstrated consistent elevation in these gradients (i.e. the band did not slip). Furthermore, after band removal, the right-to-left ratios decreased to normal levels (data not shown). The normalization in gradients suggests enhanced flow through the aortic arch and subsequent relief of pressure-overload on the mouse heart.
We next sought to determine a time-course relating duration of pressure-overload and extent of hypertrophy with the ability to recover myocardial function following pressure-relief. Myocardial mass as measured by HW/BW ratios fell significantly following debanding at 3 weeks and at 4 weeks, but did not decrease significantly after pressure unloading at 6 weeks (Figure 2A). Functionally, as assessed by intraventricular pressure-volume measurements, 3 weeks of banding resulted in cardiac function that was equivalent to the level of an age-matched mouse without prior surgery. More prolonged banding, however, resulted in functional decline that was only reversible after 4 weeks of banding, but not after 6 weeks (Figure 2B). Compared to animals banded for 3 weeks, the ejection fraction of animals banded for 4 weeks dropped by over 20%. This level of dysfunction continued in 6 week banded animals. Importantly, mice banded for 4 weeks that were subsequently debanded were able to normalize their ejection fraction whereas those animals banded for 6 weeks were unable to recover their function following pressure relief. Left ventricular pressure volume loops qualitatively characterized these changes. Mice banded for 4 weeks had an expected shift up and to the right, suggesting both pressure and volume overload. This relationship was reversed with debanding. Furthermore, mice banded for 6 weeks had profound increases in ventricular volume that was not able to be reversed with pressure unloading. Summarily, the physiologic assessments of our experimental groups allow us to designate 3 distinct groups based on when the animals were debanded: compensated (3 weeks), decompensated but recoverable (4 weeks), and decompensated but unrecoverable (6 weeks).
Figure 2.
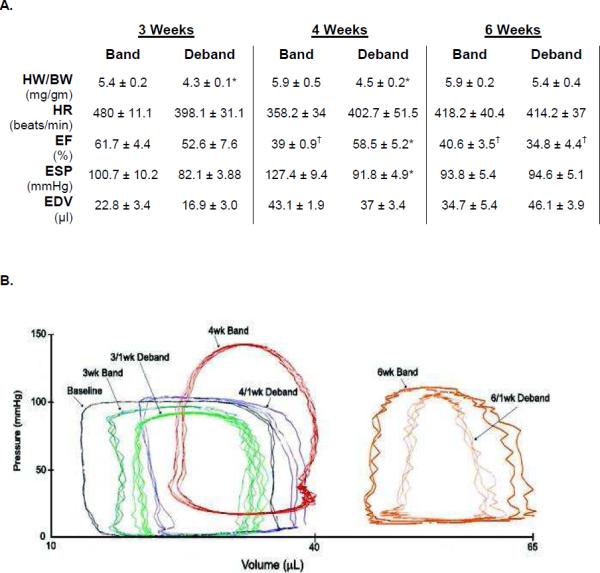
Physiologic Characteristics of Band and Deband Animals. A. Hemodynamic parameters obtained from in-situ left ventricular catheterization (n=4–5 for each Band and Deband group). B. Pressure-volume loops for the respective groups. *p<0.05 compared to the Band group within that time-period. †p<0.05 vs 3 week banded animal. (HW/BW: heart weight:body weight; HR: heart rate; EF: Ejection Fraction; ESP: End-Systolic Pressure; EDV: End-Diastolic Pressure).
To further assess the time-dependent biologic effects of pressure-overload and subsequent relief, real-time PCR was performed in LV apical samples for hypertrophic and fibrotic gene markers (Figure 3). As expected, β-myosin heavy chain expression sequentially increased with prolonged pressure overload and decompensated heart failure and dropped with pressure-relief afforded by debanding. A similar trend was observed with skeletal muscle alpha1-actin. Brain natriuretic peptide expression was elevated after 3 and 4 weeks of banding compared to its respective deband counterparts. But by 6 weeks of banding, levels had fallen significantly. While this latter observation is perhaps not expected, one could speculate that the left ventricle has reached maximal stretch in the dilated and failing 6 week heart, and thus the stimulus for BNP transcription subsequently decreased [23]. Finally, collagen type 1α1 transcription, a marker of the fibrotic process, increased during the progression phase of pressure-overload by 6 weeks, and expectantly decreased after debanding at each respective time point.
Figure 3.

Hypertrophic gene markers. Real-time PCR (relative to 18S expression) from left-ventricular apices at each Band (B) and Deband (DB) timepoint (n=4–5 for each groups). βMHC, beta myosin heavy chain; ACTA-1, skeletal muscle alpha1-actin; Col1, collagen type 1 alpha 1 (COL1a1); BNP – brain natriuretic peptide. *p<0.05 debanded versus respective banded group at same time point; †p<0.05 6 week banded versus 3 week banded animals.
Pressure Relief Results in Distinct Genomic Patterns Dependent Upon Functional Phase Prior to Ventricular Unloading
Our global hypothesis states that pressure-relief results in a gene expression pattern that is not simply the reverse of those factors causing hypertrophy, but rather a unique signature. In order to test this notion, we compared gene expression profiles between the physiologically distinct groups described above. We first examined genomic expression patterns within the individual cohorts. As demonstrated in the Venn diagrams in Figure 4A and 4B, there was little overlap in gene expression between different stages of progression or regression of heart failure. Development of LVH and HF with pressure overload demonstrated distinct genomic profiles between from compensated LVH to decompensated LVH (3 weeks banding to 4 weeks banding), decompensated LVH to terminally failed hearts (4 weeks banding to 6 weeks banding), and compensated LVH to terminally failed hearts (3 weeks banding to 6 weeks banding). While others have demonstrated similar findings [24], we extend this paradigm to identify genomic differences in the process of regression. Indeed, distinct patterns were also noted with individual stages of regression (Figure 4B). For example, the genes expressed during the recovery of compensated LVH (3 week debanded mice) were markedly different than those expressed with recovery from decompensated hearts (4 week debanded mice) or failing hearts after pressure relief (6 week debanded mice). The fact that 52 genes overlapped in the three week versus 4 and 6 week debanded groups suggests some similarities in gene expression in the failing hearts with pressure unloading.
Figure 4.

Genomic stages in the progression and regression of hypertrophic heart failure as depicted by Venn diagrams. A. Microarray analysis reflecting the differences between stages of heart failure progression compared animals banded for either 3 (compensated), 4 (decompensated), or 6 (failed) weeks. B. Microarray analysis reflecting the differences in gene expression following pressure-relief in animals previously banded for either 3, 4, or 6 weeks. C. Microarray analysis comparing differences in gene expression between each physiologic category. All analyses performed with a MFC > 1.5 and p<0.05.
We next sought to link the physiologic process of recovery with genomic patterning. We therefore analyzed differences in gene expression between compensated hearts that regressed their hypertrophy (3 week band and 3 week deband), decompensated hearts that regained their function (4 week band and deband), and decompensated hearts that were terminally failing (6 week band and deband group pairs). Using a p-value <0.05 and mean fold change of > 1.3 strategy for the selection of differentially expressed genes, we identified a total of 1,017 genes (Figure 4C). Of these, only 28 (2.8%) of these genes overlapped between any 2 groups, and no genes were found to be common to all three. These data suggest that the physiologic phenotype of recovery versus persistent failure is associated with an independent genomic pattern that is dependent upon the functional phase of cardiac hypertrophy prior to ventricular unloading.
Cluster analysis was then performed on the 3 banded groups, and separately on the 3 debanded groups. As depicted in Figure 5, the heat maps demonstrate tight clustering within and between the experimental groups. To further delineate the genomic pathways and transcription factors that regulate specific physiologic stages of hypertrophy and recovery, genes specifically upregulated (i.e. 4 wk Up) or downregulated (i.e. 4 wk Down) were run through the Molecular Signatures Database [22]. Results for the banded groups, representative of hypertrophy progression, are listed in Figure 5A. Results for the debanded groups, or stages of hypertrophic recovery, are listed in Figure 5B.
Figure 5.

Cluster analysis, pathways and transcription factors in the progression of heart failure and in the respective stages of recovery. Genes upregulated (up) or downregulated (down) at a specific physiologic point in banded groups (A) or debanded groups (B) were run through the Molecular Signatures Database (MSigDB) to determine the five most significant genomic pathways and transcription factors within a particular physiologic stage. MFC>1.5, p<0.05.
Gross inspection of transcription factor targets reveals a recurrent role for the transcription factor nuclear factor kappa B (NF-κB) in both the remodeling and recovery process. We and others have previously implicated this signaling intermediate as important in hypertrophy and heart failure [15, 25–28]. As such, we examined several NF-κB-dependent factors that could offer mechanistic insight as to the process of pressure overload and relief. We focused on transcription related to 2 processes – apoptosis and matrix turnover (Figure 6). Although we did not observe differences in expression of the pro-apoptotic molecules, TRAF6 and Bax (data not shown), the anti-apoptotic genes Birc3 and Bcl2 (albeit a trend, rather than significant) were underexpressed in failing hearts that were banded for 6 weeks. Although not significantly different, banding – in the early phases – increased Birc3 and Bcl2 expression that subsequently decreased with pressure relief. Expression of remodeling molecules TIMP-1 and MMP-9 appear to see-saw with pressure overload and subsequent relief. Interestingly, the failing and unrecoverable hearts (6 week banded) had markedly less MMP-9 compared to those animals banded for 3 or 4 weeks.
Figure 6.

Apoptotic and fibrotic gene markers. Real-time PCR (relative to 18S expression) from left-ventricular apices at each Band (B) and Deband (DB) timepoint (n=4–5 for each groups). *p<0.05, debanded versus respective banded group at same time point; †p<0.05, 6 week banded versus 4 week banded animals.
Discussion
The current data support our global hypothesis that the mechanisms of myocardial recovery are not simply the reverse of those that cause its failure. This line of investigation was initially charged by a report that demonstrated independent gene expression with reversal of isoproteronol-induced LVH [29]. When we first introduced this murine model of banding and debanding, our focus was likewise on the reversal of left ventricular hypertrophy [12]. Indeed, several other groups have also examined LVH with pressure-relief following aortic banding, both structurally and genomically [9, 10]. In turn, we have subsequently demonstrated that the reversal of LVH with pressure-relief is associated with an independent genomic signature as well as changes in markers of fibrosis [11, 13]. All of our previous studies were performed with mice that were banded for 4 weeks prior to pressure-relief. When we looked closely at our functional data, we noticed that these mice not only had hypertrophy, but that they had decreased their ejection fraction [11]. To date, the literature related to reversal of hypertrophy with pressure unloading has used limited timepoints of loading. Our observation led us to predict that the length of pressure overload (banding) determines the ability of that heart to regress. Although this was a conceptually intuitive hypothesis, the three distinct patterns of reversal had not previously been demonstrated.
Although the individual components of this model system are not novel, we believe that linking the functional groups with their genomic signature provides an innovative method for studying the mechanisms associated with the recovery of the failing heart. We have previously used echocardiography to define our subgroups [11, 12]. Although more labor intensive, we utilized pressure-volume loops in the present study to obtain more sensitive measures of function. These measurements allow us to establish 3 separate phases of recovery (Figure 7): regression from compensated hypertrophy, recovery from decompensated hypertrophy, and the terminally failing heart. Imbedded within this construct is the identification of a point of no return. Our data suggests that after 4 weeks of banding, the hearts enter a period of decompensation that is not, at least within our time interval, recoverable.
Figure 7.

Murine model depicting physiologic phase-dependent myocardial failure and recovery.
In our previous reports, we demonstrated some of the histologic and molecular markers associated with regression of hypertrophy [11, 12]. Although the hearts regain normal structure and function with pressure-relief (3 and 4 week debanded animals), we cannot claim that they are genomically “normal.” As demonstrated simply in the Venn diagram, the genomic patterns of unloading were different between each subgroup. These observations will propel more detailed studies focusing on timing and better understanding of the recovered state. For example, in this study, we detail the effects of debanding for each phase only 1 week beyond each time point. In either direction (progression/regression), we are likely witnessing a continuum of change as the heart both negatively and positively remodels. Quite possibly, a more prolonged period of recovery would provide different structural and genomic patterns. For example, would the 6-week animals show evidence of reversal if we had given them a longer period of debanding? A previous study that banded animals for 8 weeks and followed them after debanding for 6 weeks observed no resolution of LV mass or fractional shortening [9]. We chose to organize the array around the 1 week time point because our preliminary data indicated that the effective physiologic and structural reversal of LVH was nearly complete at this time (and far-enough away from the surgical procedure), despite differences in gene expression. Furthermore, we wished to create a model that was a 3–6 week model rather than a 6–12 week model, allowing a more practical approach for high throughput experiments. Finally, we acknowledge that this is a model that relieves acute pressure overload. Thus, parallels to the insidious pressure-overload that occurs with typical human aortic stenosis or hypertrophic heart failure, and its subsequent reversal with aortic valve replacement or left ventricular assist devices, can only be inferred.
The microarray data provide several pathways and transcription factor targets as well as a long list of candidates of genes involved with reverse remodeling. We have a particular interest in NF-κB biology and were intrigued with the high placement of this transcription factor implicated within of our gene lists. Metalloproteinases and apoptotic-related genes are clearly important in the remodeling process. Thus, we screened several related NF-κB-dependent genes within our model. Interestingly, mice banded for longer than 4 weeks had decreased expression of Birc3, Bcl2, and MMP-9. Myocardial apoptosis has been demonstrated in failing hearts and this was associated with nearly 2-fold elevation in Bcl2 expression with stable Bax expression [30]. Others have not only seen this level of apoptosis but have seen increased levels of Bcl2 expression in failing hearts [31]. Little data exists regarding expression of the anti-apoptotic protein Birc3 and heart failure. Nevertheless one could surmise that changes in the balance between pro- and anti-apoptotic signals could transition a decompensated heart from one that is potentially recoverable to one that is irreversibly failed. Similarly, the literature regarding expression of MMPs with heart failure is conflicting. While many have demonstrated upregulation of MMPs [32], others have more recently demonstrated MMP-9 downregulation (with stable, elevated levels of TIMP-1) in hearts from transplant recipients [33]. More relevant to our model of pressure-overload and relief, patients with worsening levels of systolic function with aortic stenosis receiving aortic valve replacement had more robust expression of both MMP-2 and -9 [34]. As with apoptosis, we could construct a paradigm that MMP expression is upregulated during the progression of heart failure, and that its downregulation may alter the balance between proteins favoring matrix production and breakdown, thus making a heart no longer capable of recovery. While each of these hypotheses remains to be tested, the current data serve to validate our model as a tool to dissect mechanistic points of no return for the failing heart.
Finally, we recognize that we have not identified “the answer” for myocardial recovery. Our genomic screening has identified patterns of expression that validate the functional differences in our respective groups and provide a source for deductive and inductive approaches to manipulating the recovery process. Only one group, to the best of our knowledge, has inductively extended a single gene observation mechanistically [35]. That said, the system of remodeling is quite redundant, and manipulation of a single gene will quite likely not provide clinicians a magic bullet.
Conclusions and clinical implications
Much attention, both experimentally and clinical, has focused on the issues related to the development and progression of LVH and HF. This linear approach suggests that variables can be identified to predict which patients will transition from a compensated to decompensated state. Thus, interventions are aimed at halting the progression of the disease. In allegoric terms, physicians are trying to identify the edge of the cliff that the patient needs to avoid. This report and model system proposes a different paradigm by attempting to identify the factors that transition a decompensated heart to one that is compensated (Figure 7). Preventive therapy is laudable, but hospitalizations for advanced heart failure are related to patients that are decompensated. Extending the metaphor, we must presume that patients will fall off the cliff, even if you know where it is. The question then becomes, how far can that patient fall and still climb up and must the patient take a different path to recover? Although an experimental mouse model, this approach allows the temporal and mechanistic characterization of a practical and potentially high-throughput model to study the “point of no return” for the failing heart. Furthermore, we identify a distinct gene expression profile for the recovery of the failing heart. Finally, in addition to providing mechanistic targets for the study of reverse remodeling, this model establishes a template for testing therapies aimed at myocardial recovery.
Acknowledgments and Grants
This work was funded in part by the National Institute of Health R01HL089592 (CHS) and R01HL65619 (CP), Thoracic Surgery Foundation for Research and Education (CHS), and American College of Surgeons (CHS).
Footnotes
Publisher's Disclaimer: This is a PDF file of an unedited manuscript that has been accepted for publication. As a service to our customers we are providing this early version of the manuscript. The manuscript will undergo copyediting, typesetting, and review of the resulting proof before it is published in its final citable form. Please note that during the production process errors may be discovered which could affect the content, and all legal disclaimers that apply to the journal pertain.
The authors have no disclosures.
References
- 1.Boluyt MO, Robinson KG, Meredith AL, et al. Heart failure after long-term supravalvular aortic constriction in rats. 2005;18:202–12. doi: 10.1016/j.amjhyper.2004.08.034. [DOI] [PubMed] [Google Scholar]
- 2.Norton GR, Woodiwiss AJ, Gaasch WH, et al. Heart failure in pressure overload hypertrophy. The relative roles of ventricular remodeling and myocardial dysfunction. 2002;39:664–71. doi: 10.1016/s0735-1097(01)01792-2. [DOI] [PubMed] [Google Scholar]
- 3.Tagawa H, Koide M, Sato H, et al. Cytoskeletal role in the transition from compensated to decompensated hypertrophy during adult canine left ventricular pressure overloading. 1998;82:751–61. doi: 10.1161/01.res.82.7.751. [DOI] [PubMed] [Google Scholar]
- 4.Olivetti G, Quaini F, Lagrasta C, et al. Myocyte cellular hypertrophy and hyperplasia contribute to ventricular wall remodeling in anemia-induced cardiac hypertrophy in rats. 1992;141:227–39. [PMC free article] [PubMed] [Google Scholar]
- 5.Gerdes AM, Moore JA, Hines JM. Regional changes in myocyte size and number in propranolol-treated hyperthyroid rats. 1987;57:708–13. [PubMed] [Google Scholar]
- 6.Gerdes AM, Clark LC, Capasso JM. Regression of cardiac hypertrophy after closing an aortocaval fistula in rats. 1995;268:H2345–51. doi: 10.1152/ajpheart.1995.268.6.H2345. [DOI] [PubMed] [Google Scholar]
- 7.Soonpaa MH, Field LJ. Assessment of cardiomyocyte DNA synthesis during hypertrophy in adult mice. 1994;266:H1439–45. doi: 10.1152/ajpheart.1994.266.4.H1439. [DOI] [PubMed] [Google Scholar]
- 8.Lloyd-Jones DM, Larson MG, Leip EP, et al. Lifetime risk for developing congestive heart failure: the Framingham Heart Study. 2002;106:3068–72. doi: 10.1161/01.cir.0000039105.49749.6f. [DOI] [PubMed] [Google Scholar]
- 9.Gao XM, Kiriazis H, Moore XL, et al. Regression of pressure overload-induced left ventricular hypertrophy in mice. 2005;288:H2702–7. doi: 10.1152/ajpheart.00836.2004. [DOI] [PubMed] [Google Scholar]
- 10.Yang DK, Choi BY, Lee YH, et al. Gene profiling during regression of pressure overload-induced cardiac hypertrophy. 2007;30:1–7. doi: 10.1152/physiolgenomics.00246.2006. [DOI] [PubMed] [Google Scholar]
- 11.Stansfield WE, Charles PC, Tang RH, et al. Regression of pressure-induced left ventricular hypertrophy is characterized by a distinct gene expression profile. 2009;137:232–8. 8e1–8. doi: 10.1016/j.jtcvs.2008.08.019. [DOI] [PMC free article] [PubMed] [Google Scholar]
- 12.Stansfield WE, Rojas M, Corn D, et al. Characterization of a model to independently study regression of ventricular hypertrophy. 2007;142:387–93. doi: 10.1016/j.jss.2007.01.037. [DOI] [PubMed] [Google Scholar]
- 13.Stansfield WE, Andersen NM, Tang RH, Selzman CH. Periostin is a novel factor in cardiac remodeling after experimental and clinical unloading of the failing heart. 2009;88:1916–21. doi: 10.1016/j.athoracsur.2009.07.038. [DOI] [PMC free article] [PubMed] [Google Scholar]
- 14.Drakos SG, Kfoury AG, Hammond EH, et al. Impact of mechanical unloading on microvasculature and associated central remodeling features of the failing human heart. 2010;56:382–91. doi: 10.1016/j.jacc.2010.04.019. [DOI] [PMC free article] [PubMed] [Google Scholar]
- 15.Moss NC, Stansfield WE, Willis MS, Tang RH, Selzman CH. IKKbeta inhibition attenuates myocardial injury and dysfunction following acute ischemia-reperfusion injury. 2007;293:H2248–53. doi: 10.1152/ajpheart.00776.2007. [DOI] [PubMed] [Google Scholar]
- 16.Novoradovskaya N, Whitfield ML, Basehore LS, et al. Universal Reference RNA as a standard for microarray experiments. 2004;5:20. doi: 10.1186/1471-2164-5-20. [DOI] [PMC free article] [PubMed] [Google Scholar]
- 17.Smyth GK, Speed T. Normalization of cDNA microarray data. 2003;31:265–73. doi: 10.1016/s1046-2023(03)00155-5. [DOI] [PubMed] [Google Scholar]
- 18.Storey JD, Tibshirani R. Statistical methods for identifying differentially expressed genes in DNA microarrays. 2003;224:149–57. doi: 10.1385/1-59259-364-X:149. [DOI] [PubMed] [Google Scholar]
- 19.Storey JD, Tibshirani R. Statistical significance for genomewide studies. 2003;100:9440–5. doi: 10.1073/pnas.1530509100. [DOI] [PMC free article] [PubMed] [Google Scholar]
- 20.Yu H, Gao L, Tu K, Guo Z. Broadly predicting specific gene functions with expression similarity and taxonomy similarity. 2005;352:75–81. doi: 10.1016/j.gene.2005.03.033. [DOI] [PubMed] [Google Scholar]
- 21.Eisen MB, Spellman PT, Brown PO, Botstein D. Cluster analysis and display of genome-wide expression patterns. 1998;95:14863–8. doi: 10.1073/pnas.95.25.14863. [DOI] [PMC free article] [PubMed] [Google Scholar]
- 22.Subramanian A, Tamayo P, Mootha VK, et al. Gene set enrichment analysis: a knowledge-based approach for interpreting genome-wide expression profiles. 2005;102:15545–50. doi: 10.1073/pnas.0506580102. [DOI] [PMC free article] [PubMed] [Google Scholar]
- 23.Magga J, Vuolteenaho O, Tokola H, Marttila M, Ruskoaho H. B-type natriuretic peptide: a myocyte-specific marker for characterizing load-induced alterations in cardiac gene expression. 1998;30(Suppl 1):39–45. [PubMed] [Google Scholar]
- 24.Wagner RA, Tabibiazar R, Powers J, Bernstein D, Quertermous T. Genome-wide expression profiling of a cardiac pressure overload model identifies major metabolic and signaling pathway responses. 2004;37:1159–70. doi: 10.1016/j.yjmcc.2004.09.003. [DOI] [PubMed] [Google Scholar]
- 25.Gupta S, Young D, Maitra RK, et al. Prevention of cardiac hypertrophy and heart failure by silencing of NF-kappaB. 2008;375:637–49. doi: 10.1016/j.jmb.2007.10.006. [DOI] [PMC free article] [PubMed] [Google Scholar]
- 26.Grabellus F, Levkau B, Sokoll A, et al. Reversible activation of nuclear factor-kappaB in human end-stage heart failure after left ventricular mechanical support. 2002;53:124–30. doi: 10.1016/s0008-6363(01)00433-3. [DOI] [PubMed] [Google Scholar]
- 27.Stansfield WE, Tang R, Moss NC, et al. Proteasome inhibition promotes regression of left ventricular hypertrophy. 2008;294:H645–50. doi: 10.1152/ajpheart.00196.2007. [DOI] [PubMed] [Google Scholar]
- 28.Tang RH, Zheng XL, Callis TE, et al. Myocardin inhibits cellular proliferation by inhibiting NF-kappaB(p65)-dependent cell cycle progression. 2008;105:3362–7. doi: 10.1073/pnas.0705842105. [DOI] [PMC free article] [PubMed] [Google Scholar]
- 29.Friddle CJ, Koga T, Rubin EM, Bristow J. Expression profiling reveals distinct sets of genes altered during induction and regression of cardiac hypertrophy. 2000;97:6745–50. doi: 10.1073/pnas.100127897. [DOI] [PMC free article] [PubMed] [Google Scholar]
- 30.Olivetti G, Abbi R, Quaini F, et al. Apoptosis in the failing human heart. 1997;336:1131–41. doi: 10.1056/NEJM199704173361603. [DOI] [PubMed] [Google Scholar]
- 31.Francis GS, Anwar F, Bank AJ, Kubo SH, Jessurun J. Apoptosis, Bcl-2, and proliferating cell nuclear antigen in the failing human heart: observations made after implantation of left ventricular assist device. 1999;5:308–15. doi: 10.1016/s1071-9164(99)91335-0. [DOI] [PubMed] [Google Scholar]
- 32.Thomas CV, Coker ML, Zellner JL, et al. Increased matrix metalloproteinase activity and selective upregulation in LV myocardium from patients with end-stage dilated cardiomyopathy. 1998;97:1708–15. doi: 10.1161/01.cir.97.17.1708. [DOI] [PubMed] [Google Scholar]
- 33.Batlle M, Perez-Villa F, Garcia-Pras E, et al. Down-regulation of matrix metalloproteinase-9 (MMP-9) expression in the myocardium of congestive heart failure patients. 2007;39:2344–6. doi: 10.1016/j.transproceed.2007.06.046. [DOI] [PubMed] [Google Scholar]
- 34.Polyakova V, Hein S, Kostin S, Ziegelhoeffer T, Schaper J. Matrix metalloproteinases and their tissue inhibitors in pressure-overloaded human myocardium during heart failure progression. 2004;44:1609–18. doi: 10.1016/j.jacc.2004.07.023. [DOI] [PubMed] [Google Scholar]
- 35.Lee SH, Yang DK, Choi BY, et al. The transcription factor Eya2 prevents pressure overload-induced adverse cardiac remodeling. 2009;46:596–605. doi: 10.1016/j.yjmcc.2008.12.021. [DOI] [PubMed] [Google Scholar]