

Abstract
The specific brain structures or neural mechanisms underlying dysfunction in individuals with Attention-Deficit/Hyperactivity Disorder (ADHD) are not well established, particularly in regards to white matter (WM). Diffusion tensor imaging (DTI) was used to investigate WM in 12 adolescent males diagnosed with ADHD only and 12 typically developing controls (group matched; mean age=15.64 years, SD=1.15). In addition to fractional anisotropy (FA), we also examined axial and radial diffusivity (AD and RD) in an effort to help elucidate conflicting findings suggesting that both lower and higher FA values are characteristic of ADHD. Tract-based spatial statistics voxel-wide analyses were conducted on the data utilizing a pre-frontal mask to enable focus on fronto-striatal and prefrontal pathways. Adolescents with ADHD had significantly higher FA (p<.04) and AD (p<.004) values in fronto-striatal pathways compared to controls. No differences were observed for RD. These results contribute to the growing literature implicating prefrontal WM variations in neuropsychiatric disorders, and are consistent with findings suggesting a role for fronto-striatal pathways in ADHD pathophysiology.
Keywords: fronto-striatal abnormalities, axial diffusivity
1. Introduction
Attention-Deficit/Hyperactivity Disorder (ADHD) is a behaviorally defined disorder affecting approximately 3–5% of school-aged children (American Psychological Association, 1994). ADHD is characterized by problems with inattention, impulsivity, and hyperactivity causing significant impairment in multiple settings. Although behavioral and cognitive deficits in ADHD are well described, the specific brain structures or neural mechanisms underlying dysfunction in ADHD are not well established, in part because attention is a complex cognitive ability that involves multiple interconnected brain regions. Though the diagnostic construct of ADHD is heterogeneous with respect to genetic and environmental risk factors, these factors may converge at the level of aberrant neurodevelopment and functional neuroanatomy.
Most studies have focused on the contribution of cortical gray matter anatomy to brain function; however, in recent years, it has been recognized that white matter (WM) also makes an important contribution to cognition and emotion. WM comprises nearly half of the average human brain volume and plays a key role in development, aging, and many neurological and psychiatric disorders across the life span. In ADHD, anatomic MRI studies show decreased WM volume throughout the brain and, in particular, the prefrontal cortex e.g., (Krain and Castellanos, 2006). Significant decreases in WM volume have also been observed in children who are not medicated for ADHD (Castellanos et al., 2002). The cortical networks mediating cognitive function establish connectivity through WM pathways. Localized changes in cortical activation within the attentional network (e.g., frontal lobes) may result from anatomical variations of WM at various points in the network. Since higher order cognitive functions depend on intact communication between cortical areas through projection, association and commissural fibers (Skranes et al., 2007), investigating WM may elucidate our understanding of psychopathology.
Diffusion tensor imaging (DTI) is a magnetic resonance imaging (MRI) technique that provides information about WM microstructure in vivo. The myelin sheath and cell membrane restrict the diffusion of water perpendicular to the direction of the axons in WM, whereas water diffuses more readily parallel to the axons. This directional dependence of diffusion is quantified as anisotropy. Fractional anisotropy (FA) is a normalized measure of diffusion anisotropy and varies between 0 (equal diffusion in all directions) to 1 (highly directional diffusion), and is influenced from fiber coherence, myelin, extracellular diffusion, and axonal density (Sen and Basser, 2005). Axial diffusivity (AD, diffusion along the fiber) represents coherence of WM while radial diffusivity (RD, diffusion perpendicular to the fiber) is thought to be related to axonal myelination (Song et al., 2002). Although most ADHD studies report FA values, it has been argued that this may not be sufficient to characterize WM neuropathology (Alexander et al., 2007). For example, WM neuropathology often causes FA to decrease, which may result from either increased RD and/or reduced AD (Alexander et al., 2007).
There is a growing literature investigating ADHD using DTI. The earliest of these studies focused on children with ADHD Combined Type versus normal controls (Ashtari et al., 2005). Results showed that children with ADHD had decreased FA in the right premotor, right striatal, right cerebral peduncle, left middle cerebellar peduncle, left cerebellum, and left parieto-occipital areas. FA values in the cerebellum were negatively correlated with inattentive symptoms. Recently, additional studies investigated children and adolescents with ADHD (ages 6–18). These studies reported lower FA values in the anterior corona radiata, anterior limb of the internal capsule, and superior region of the internal capsule (Pavuluri et al., 2009), corticospinal tract and superior longitudinal fasiculus (Hamilton et al., 2008), frontal and cerebellar WM (Kobel et al., 2010), bilateral frontolimbic and temporo-occipital WM, left cerebellar WM, right frontoparietal WM, right anterior and superior corona radiata, and left posterior corona radiata (Nagel et al., 2011), and forceps minor, the internal capsule, the corona radiata, the splenium of the corpus callosum, and the bilateral basal ganglia (Qiu et al., 2010) for children and adolescents with ADHD compared to controls. Lower FA values have been associated with less fMRI activation in fronto-striatal regions associated with response inhibition in adolescents with ADHD and their parents (Casey et al., 2007). There have also been studies reporting higher FA values in various regions including the anterior corona radiata (Davenport et al., 2010), cingulum, uncinate fasiculus, inferior longitudinal fasiculus, and superior longitudinal fasiculus (Silk et al., 2008), right frontal lobe WM (Li et al., 2010), and right superior frontal gyrus and posterior thalamic radiation, and left dorsal posterior cingulate gyrus, lingual gyrus, and parahippocampal gyrus (Peterson et al., 2011) for children and adolescents with ADHD compared to controls.
Taken together, the DTI studies to date support a hypothesis of diffuse WM abnormalities in ADHD while differing in precise location and direction of differences, likely due to analytic techniques and heterogeneity in sample characteristics (gender, age range, subtype, medication status, comorbidities, etc). There is particularly consistent evidence for FA disruptions in the superior longitudinal fasiculus and anterior corona radiata pathways critical to prefrontal cortical function (Liston et al., 2011). However, the direction of differences (increased FA versus decreased FA) varies by study.
Very few studies have reported on AD and RD in ADHD. Description of complementary scalars could help elucidate the differences in direction reported for FA in studies of ADHD. Abnormalities in WM structure in ADHD have been reported for mean diffusivity (an estimate of the magnitude of diffusion in WM pathways) with lower values in the posterior limb of the internal capsule and superior longitudinal fasiculus and higher values in the left frontolimbic WM, the latter were largely driven by increased RD in ADHD (Nagel et al., 2011). A cross-sectional study of development using diffusional kurtosis imaging, which investigates tissue microstructural integrity, suggested that adolescents with ADHD do not show expected age-related increases in radial or AD in the prefrontal cortex (Helpern et al., 2011). The finding was interpreted as consistent with studies suggesting developmental delays in brain maturation (Shaw et al., 2007).
In this study, we used DTI to investigate WM in adolescents with ADHD compared to typically developing controls. We investigated FA, AD, and RD using tract-based spatial statistics (TBSS). TBSS is a voxel-wise analytic tool implemented in FMRI Software Library (FSL, http://www.fmrib.ox.ac.uk/fsl/) which was specifically developed for the analysis of diffusion-weighted data. As such, it was designed to address shortcomings inherent in other voxel-wise analytic programs used for analyses of DTI data (e.g., Statistical Parametric Mapping, SPM) including the use standard registration algorithms which are not optimal for use with diffusion-weighted data, arbitrary choice of smoothing kernel, partial volume effects, and the use of parametric statistics in data with an unknown distribution (Smith et al., 2007). TBSS addresses these issues by using non-linear registration, projection into alignment-invariant tract representation (the “mean FA skeleton”), avoiding the use of smoothing and permutation statistics which do not require normally distributed data (Smith et al., 2007). Because most imaging studies report abnormalities in the fronto-striatal regions and stimulant medication increases activation in these regions (Paloyelis et al., 2007), we focused on the striatum and adjoining frontal regions. Based on the literature, we hypothesized adolescents with ADHD would have aberrant white matter structure in fronto-striatal regions, and in particular the anterior corona radiata.
Methods
Fourteen adolescent boys diagnosed with ADHD Combined Type and 12 male controls participated. Informed consent and assent were obtained following procedures established by the Stanford Institutional Review Board. Subjects were recruited via mailings to local pediatricians, postings on the Children and Adults with Attention-Deficit/Hyperactivity Disorder (CHADD) and Stanford Psychiatry web sites, flyers, etc. Participants were compensated for their time. ADHD diagnosis was determined via a structured interview conducted with the primary caregiver (Diagnostic Interview Schedule for Children Version 2.3 – DISC) (Lahey et al., 1996). In addition, the Conners’ ADHD/DSM-IV scale - Parent Version (Conners et al., 1998) was completed. Adolescents also completed the Conners’ ADHD/DSM-IV scale, although this was not used to establish diagnosis. Typically developing controls were screened for neurological, developmental, and psychiatric disorders, and a family history negative for psychiatric disorders via interview with the primary caregiver and T-scores < 65 on the Achenbach Child Behavior Checklist (Achenbach, 1991). Data from two participants in the ADHD group were excluded due to excessive movement. Demographic information for participants included in the analyses can be found in Table 1.
Table 1.
Participant Demographic Characteristics
| ADHD (n=12) | Control (n=12) | Statistical Test (2-tailed) | |
|---|---|---|---|
| Age | 15.8 (1.5) | 15.6 (0.8) | t(22) = 0.34, P=.74 |
| Full Scale IQ | 106.1 (10.8) | 111.6 (11.7) | t(22) = −1.19 P =.25 |
| Reading | 104.6 (7.5) | 111.0 (5.7) | t(22) =− 2.37, P =.03 |
| Spelling | 95.7 (12.9) | 106.0 (10.4) | t(22) = −2.15, P =.04 |
| Arithmetic | 100.6 (13.4) | 106.3 (15.5) | t(22) = −0.96, P =.35 |
| Ethnicity | χ2(2) = 0.39, P =.82 | ||
| Caucasian | n = 10 | n = 9 | |
| Hispanic | n = 1 | n = 1 | |
| Other | n = 1 | n = 2 | |
| DSM-IV ADHD T-score | 82.9 (6.2) | 47.4 (9.7) | t(21) = 10.5, P <.001 |
| Alcohol Use Past Month (number of times) | .83 (2.3) | .83 (1.3) | t(22) = 0.00, P =1.0 |
| Illicit Drug Use Past Month (number of times) | .42 (1.0) | .50 (1.7) | t(22) = −.14, P =.89 |
| Comorbid Diagnoses | Not applicable | ||
| Other Disruptive Behavior Disorder | n = 6 | ||
| Mood Disorder | n = 2 | ||
| Anxiety Disorder | n = 3 | ||
| Medication Use | Not applicable | ||
| Adderall | n = 1 | ||
| Ritalin | n = 3 |
Note: Values are mean (standard deviation). ADHD = attention-deficit/hyperactivity disorder; IQ = intelligence quotient; DSM-IV = Diagnostic and Statistical Manual
Participants were right-handed, and ranged in age from 14 to 18 (group matched; mean age=15.64 years, SD=1.15). Groups did not differ on IQ estimated from the Wechsler Abbreviated Scale of Intelligence (Wechsler, 1999) or mathematic achievement screened with the Wide Range Achievement Test, Third Edition (Jastak and Wilkinson, 1993). The groups did differ on reading and spelling, however, with the ADHD groups performing more poorly than the controls. Four subjects in the ADHD group reported current use of stimulant medication; all were subjected to an 18-hour washout before the scan. No other medication use was reported. Subjects did not drink caffeine at least 2 hours before the scan. Of those reporting drug use (two in the ADHD group, one in the comparison group) and alcohol use (three in the ADHD group, six in the comparison group), a 3-week washout period for drugs (typically marijuana) and a 1-week washout period for alcohol were observed.
Images were acquired on a 1.5T GE Signa scanner with Echospeed gradients using a custom-built whole head coil. DTI image acquisition was accomplished with single-shot spin-echo echo-planar imaging sequence with diffusion sensitizing gradients applied on either side of the 180° refocusing pulse. Imaging parameters for the diffusion-weighted sequence were as follows: field of view (FOV)=24 cm, matrix size 128×128, TE/TR = 106/6000ms, 19 axial-oblique slices, slice thickness 5mm/skip 1mm, and fractional k-space acquisition. A spectral-spatial excitation RF-pulse was used to select water protons only and served to avoid ghost artifacts from lipid-bound protons. The scan was prescribed from the top of the brain and included only the most superior part of the cerebellum. Diffusion gradient duration was 32 ms, diffusion weighting was b=900s/mm2. In addition, two reference measurements (b0-scans) were performed and averaged for each slice with the diffusion-encoding gradients turned off. Diffusion was measured along six non-collinear directions: xy, xz, yz, −xy, −xz and −yz. This pattern was repeated four times for each slice with the sign of all diffusion gradients inverted for odd repetitions.
Diffusion-weighted images were corrected for eddy current distortions and head motion using linear image registration (Automated Image Registration algorithm). DtiStudio (https://www.mristudio.org/) was used to generate FA, AD and RD maps. First, all individual images were visually inspected to discard images with artifacts. The remaining images were averaged; the pixel intensities of the multiple diffusion-weighted images were then fitted to obtain the six elements of the symmetric diffusion tensor. The diffusion tensors at each pixel were diagonalized to obtain pixel eigenvalues and eigenvectors. The FA, AD and RD values were calculated in DtiStudio for each voxel to produce FA, AD, and RD maps. These maps were further processed using TBSS 1.2, an automated, observer independent voxelwise whole brain between-group analysis. TBSS was implemented in FSL 4.1 (http://www.fmrib.ox.ac.uk/fsl/). FA maps were analyzed first: FA values from each individual were co-registered using non-linear registration (FNIRT in FSL, Analysis Group FMRIB, Oxford, UK) to align every FA image to every other one. Data from this process was used to identify the “most typical subject,” which was then used as a target image. The target image was affine aligned to MNI152 standard space. Subsequently, all other participants are nonlinearly transformed to the target and then affine transformed to the MNI152 space. After image registration, FA maps were averaged to produce a group mean image. A skeletonization algorithm was applied to the group mean image to define a group template of the lines of maximum FA. This “skeleton” corresponds to centers of WM tracts, thus it ignores voxels at the edges of tracts, which are susceptible to partial volume effects. FA values for each subject were then projected onto the group template skeleton by searching along perpendiculars from the skeleton to find local maxima. The FA skeleton was thresholded to FA≥0.30 to include the major WM pathways but avoid peripheral tracts which are more vulnerable to inter-subject variability and/or partial volume effects with gray matter.
We restricted our between-group comparisons to inferior prefrontal regions, since it was our a-priori prediction that aberrant WM structure in ADHD would be primarily located in fronto-striatal pathways. To create the inferior prefrontal mask we used Talairach Daemon lobar regions generated using the wfu_pickatlas toolbox (v2.4) for SPM (Lancaster et al., 1997; Lancaster et al., 2000). This mask was edited to fully include the striatum and to exclude all slices above the striatum with the posterior edge of the caudate as the posterior border (Figure 1, bottom right). Each subject’s aligned FA data were then projected onto this skeleton and the resulting data, for each between-group analysis), were fed into voxelwise cross-subject statistics (P<0.05) using “randomise” (v.1.2 in FSL4.1), a permutation program used for inference (thresholding) on statistic maps when the null distribution is not known. All analyses were corrected for multiple comparisons, Family-Wise Error and used Threshold-Free Cluster Enhancement (TFCE), which avoids arbitrary initial cluster forming thresholding. TFCE analysis was performed using the default parameters (height=2, extent =1, connectivity=26). Data from FA maps was compared to find differences between participants with ADHD and controls. The same transformations applied to the FA images were then applied to the AD and RD images. All participants were merged and warped into a 4D file and projected onto the mean FA skeleton. Subsequently voxel-wise permutation analyses were conducted using “randomise” (P<0.05) as described above.
Figure 1.
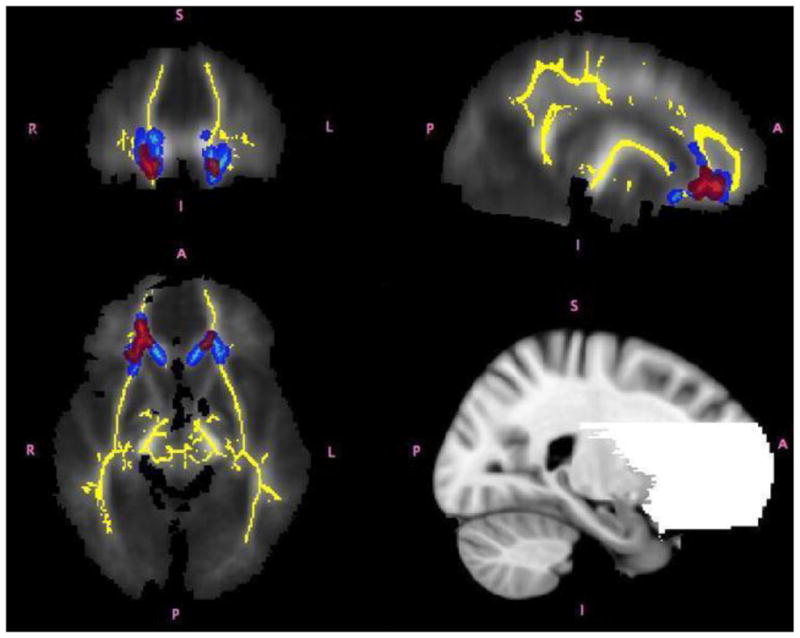
Regions of significant differences between adolescents with ADHD and controls shown in coronal, axial and sagittal views from the TBSS analysis. The white matter skeleton used in this analysis is displayed in yellow. Regions in which children with ADHD had higher FA are shown in red. Regions in which children with ADHD had higher AD values than controls are shown in light blue. Group differences were “thickened” for visualization purposes, shown in red and blue for FA and AD respectively (i.e., lighter colors represent the actual skeleton and the darker colors are the areas that were “thickened”). The bottom right panel of the figure shows the fronto-striatal mask used in the analysis.
2. Results
TBSS analysis revealed significantly higher AD values in the ADHD group relative to controls, bilaterally in pathways including the anterior corona radiata, uncinate fasciculus, inferior fronto-occipital fasciculus, anterior thalamic radiations, the genu of the corpus callosum, and anterior forceps (Figure 1). FA values also were significantly higher in the ADHD group in regions partially overlapping the AD between-group differences including the anterior corona radiata, uncinate fasciculus, inferior fronto-occipital fasciculus, anterior thalamic radiations, and anterior forceps. No significant group differences emerged for RD. FA and AD scalar values, Talaraich locations and effect sizes obtained from these analyses are reported in Table 2.
Table 2.
Diffusion Scalar Imaging Values and Talairach Coordinates
| ADHD (n=12) | Control (n=12) | Post-Hoc Effect size (Cohen’s d) | |
|---|---|---|---|
| Fractional Anisotropy | |||
| (p < .04, TBSS analysis) x=17, y=35, z=−6 |
0.530034 (0.047628) | 0.447538 (0.037069) | 1.933 |
| Axial Diffusivity | |||
| (p < .004, TBSS analysis) x=20, y=29, z=−5 x=9, y=26, z=−6 |
0.001403 (0.00051) | 0.001272 (0.00061) | 0.233 |
Note: Values are mean (standard deviation). ADHD = attention-deficit/hyperactivity disorder
3. Discussion
This study explored DTI metrics including FA, AD, and RD using TBSS in adolescents with ADHD who did not present with any other psychiatric comorbidity or learning disorder. Results revealed differences in WM anatomy in the fronto-striatal circuitry of individuals with ADHD compared to typically developing controls. Specifically, we observed higher FA and AD values for the ADHD group in fronto-striatal regions including the anterior corona radiata, uncinate fasciculus, inferior fronto-occipital fasciculus, anterior thalamic radiations, the genu of the corpus callosum, and anterior forceps.
The regions in which there were significant between group differences are similar to those reported in previous anatomic and functional imaging studies in ADHD (Vaidya and Stollstorff, 2008), and have been implicated in cognitive and attentional control (Durston and Casey, 2006), organization, planning (Ashtari et al., 2005), and inhibition (Szatkowska et al., 2007). For example, a recent review suggested that one of the most common findings from DTI studies in ADHD was abnormalities in the frontal striatal regions (particularly the anterior corona radiata), which have been correlated with deficits in cognitive control (Liston et al., 2011). The genu of the corpus callosum is known to connect prefrontal, caudal/orbital, inferior premotor regions, and it has been suggested that the genu is predominantly made up of fibers arising from the prefrontal cortex (Park et al., 2006). Lesion and correlational studies show a role for the genu in executive functions including memory, comprehension, and cognitive processing speed (Ewing-Cobbs et al., 2006; Narberhaus et al., 2007; Wilde et al., 2006). The uncinate fasciculus connects the anterior temporal lobe with the medial and lateral orbito-frontal cortex and is thought to be involved in emotion and memory (Papagno et al., 2011). The inferior fronto-occipital fasciculus, which connects frontal and occipital lobes, was recently shown to play a role in sensation seeking (Xu et al., 2011).
It was interesting that we observed increased FA and AD in the ADHD group as most DTI studies have reported lower FA values for individuals with ADHD. Higher values of FA are typically interpreted to reflect more highly organized fibers oriented in the same direction (Basser et al., 1994; Basser and Pierpaoli, 1996; Werring et al., 2000); thus, one would expect lower FA values in clinical groups. Further, reduced AD has been related to axonal damage (Budde et al., 2009). However, there are now four studies that have reported higher FA values in frontal-striatal regions in ADHD compared to controls (Davenport et al., 2010; Li et al., 2010; Peterson et al., 2011; Silk et al., 2008). Furthermore, there is a growing literature reporting increased FA and/or AD in other clinical populations; e.g., Williams Syndrome (Hoeft et al., 2007), bipolar disorder (Yurgelun-Todd et al., 2007), amyotrophic lateral sclerosis (Agosta et al., 2010), multiple sclerosis (Fink et al., 2009), and traumatic brain injury (Sidaros et al., 2008).
A possible explanation for increased FA values in brain disorders may be due to the underlying histology represented by these values, which include fiber diameter, fiber density, fiber-tract coherence, the extracellular volume fraction, interaxonal spacing (Sen and Basser, 2005) and crossing of fiber pathways (Kim and Kim, 2005). A different balance of affected diffusion parameters may affect overall diffusivity within a sampled voxel. For example, regions of crossing fibers may appear to have lower AD because of the different directions of diffusivity observed within a voxel. FA values may be relatively lower in areas with significant crossing and branching of neuronal fibers due to diffusion in multiple directions. In contrast, areas with less fiber crossing/branching reduce the magnitude of diffusion in secondary and tertiary directions resulting in relatively greater FA and potentially AD values (Suzuki et al., 2003). Thus, higher FA and AD may be due to a reduction in fiber branching in a regions were there should be branching of fibers. Such was the case in the Silk et al. study which reported greater FA values in the ADHD group resulting from an increase in diffusion along the primary direction and a decrease in diffusion along the secondary and tertiary directions (Silk et al., 2008). It is important to note that one of the areas in which WM abnormalities are most frequently reported in ADHD is the anterior corona radiata (Liston et al., 2011) which is composed of heavily branched fronto-striatal connections (Mori et al., 2005).
Clearly the choice of imaging technique, DTI metrics examined, as well as the utilization of masks and/or selection of specific regions of interest critically influences the direction and location of results in DTI studies. It is interesting that the results of the current study converge with those of another study with a similar sample of males with ADHD that also used TBSS (Silk et al., 2008) in contrast to other studies which utilized different imaging methodologies (Ashtari et al., 2005; Casey et al., 2007; Hamilton et al., 2008; Pavuluri et al., 2009). For example, Pavuluri specifically elected to avoid fiber crossing regions (Pavuluri et al., 2009). It should be noted that we did conduct a post-hoc analysis utilizing SPM voxel-wise analysis to investigate whether methodological differences between TBSS and SPM were driving the findings. Results were remarkably similar, even though SPM is not optimal for DTI analysis. This suggests that variability in the literature is not solely due to methodological variability.
While the data suggest abnormalities in WM for individuals with ADHD, limitations should be noted. Our sample size was relatively small resulting in reduced power to examine other potential contributing effects (e.g., IQ, gender, severity of ADHD symptoms) on the DTI metrics. Another potential confounding factor is history of medication use and substance use. Although participants observed a washout for the scan, several participants with ADHD had a history of prior psychotropic medication use and self-reported drug and alcohol use which may have permanently affected or altered WM. We did not have sufficient power to analyze whether prior medication use or substance use affected the diffusion metrics. Similarly, we relied on adolescent self-report regarding the substance use washout which may not have been reliable. Finally, the DTI data is of low resolution (5mm thickness and 1mm skip) and replication using higher resolution scanning techniques is warranted. It should be noted that number of directions acquired during the diffusion weighted scan should not affect reliable calculation of scalars like FA, AD and RD (Landman et al., 2007).
A histologic examination of post-mortem brain would be helpful to conclusively determine the specific origin of the FA and AD differences. However, our findings suggest WM differences for adolescent males with ADHD, possibly due to decreased crossing fibers and decreased fiber branching. The regions shown to be different in the ADHD group in our sample are consistent with extant structural and functional imaging studies suggesting a role for fronto-striatal pathways in the pathophysiology of ADHD (Paloyelis et al., 2007; Silk et al., 2008). These findings lend credence to the role of WM pathology in the neurobiology of ADHD.
Acknowledgments
Supported by NIH grants (HD-40761, HD-31715, MH-01142, MH-50047, MH-19908, and MH-62430) and a fellowship from the Constance Bultman Wilson Foundation. The authors thank Jessica Ringel for assistance with fMRI scanning, Cindy Johnston for assistance with psychological testing, and Dean Mobbs for assistance with the mock simulator. Thanks also to the adolescents who participated.
Footnotes
Publisher's Disclaimer: This is a PDF file of an unedited manuscript that has been accepted for publication. As a service to our customers we are providing this early version of the manuscript. The manuscript will undergo copyediting, typesetting, and review of the resulting proof before it is published in its final citable form. Please note that during the production process errors may be discovered which could affect the content, and all legal disclaimers that apply to the journal pertain.
References
- Achenbach TM. Manual for the Child Behavior Checklist/4–18 and 1991 Profile. University of Vermont Department of Psychiatry Press; Burlington, VT: 1991. [Google Scholar]
- Agosta F, Pagani E, Petrolini M, Caputo D, Perini M, Prelle A, Salvi F, Filippi M. Assessment of white matter tract damage in patients with Amyotrophic Lateral Sclerosis: A diffusion tensor MR imaging tractography study. American Journal of Neuroradiology. 2010;31:1457–1461. doi: 10.3174/ajnr.A2105. [DOI] [PMC free article] [PubMed] [Google Scholar]
- Alexander AL, Lee JE, Lazar M, Field AS. Diffusion tensor imaging of the brain. Neurotherapeutics. 2007;4:316–329. doi: 10.1016/j.nurt.2007.05.011. [DOI] [PMC free article] [PubMed] [Google Scholar]
- American Psychological Association. Diagnostic and Statistical Manual of Mental Disorders. 4. Author; Washington D.C: 1994. [Google Scholar]
- Ashtari M, Kumra S, Bhaskar SL, Clarke T, Thaden E, Cervellione KL, Rhinewine J, Kane JM, Adesman A, Milanaik R, Maytal J, Diamond A, Szeszko P, Ardekani BA. Attention-deficit/hyperactivity disorder: a preliminary diffusion tensor imaging study. Biological Psychiatry. 2005;57:448–455. doi: 10.1016/j.biopsych.2004.11.047. [DOI] [PubMed] [Google Scholar]
- Basser PJ, Mattiello J, LeBihan D. MR diffusion tensor spectroscopy and imaging. Biophysical Journal. 1994;66:259–267. doi: 10.1016/S0006-3495(94)80775-1. [DOI] [PMC free article] [PubMed] [Google Scholar]
- Basser PJ, Pierpaoli C. Microstructural and physiological features of tissues elucidated by quantitative-diffusion-tensor MRI. Journal of Magnetic Resonance B. 1996;111:209–219. doi: 10.1006/jmrb.1996.0086. [DOI] [PubMed] [Google Scholar]
- Budde MD, Xie M, Cross AH, Song SK. Axial diffusivity is the primary correlate of axonal injury in the experimental autoimmune encephalomyelitis spinal cord: a quantitative pixelwise analysis. Journal of Neuroscience. 2009;29:2805–2813. doi: 10.1523/JNEUROSCI.4605-08.2009. [DOI] [PMC free article] [PubMed] [Google Scholar]
- Casey BJ, Epstein JN, Buhle J, Liston C, Davidson MC, Tonev ST, Spicer J, Niogi S, Millner AJ, Reiss A, Garrett A, Hinshaw SP, Greenhill LL, Shafritz KM, Vitolo A, Kotler LA, Jarrett MA, Glover G. Frontostriatal connectivity and its role in cognitive control in parent-child dyads with ADHD. The American Journal of Psychiatry. 2007;164:1729–1736. doi: 10.1176/appi.ajp.2007.06101754. [DOI] [PubMed] [Google Scholar]
- Castellanos FX, Lee PP, Sharp W, Jeffries NO, Greenstein DK, Clasen LS, Blumenthal JD, James RS, Ebens CL, Walter JM, Zijdenbos A, Evans AC, Giedd JN, Rapoport JL. Developmental trajectories of brain volume abnormalities in children and adolescents with attention-deficit/hyperactivity disorder. Journal of the American Medical Association. 2002;288:1740–1748. doi: 10.1001/jama.288.14.1740. [DOI] [PubMed] [Google Scholar]
- Conners CK, Parker JD, Sitarenios G, et al. The revised Conners’ Parent Rating Scale: Factor, structure, reliability, and criterion validity. Journal of Abnormal Child Psychology. 1998;26:257–268. doi: 10.1023/a:1022602400621. [DOI] [PubMed] [Google Scholar]
- Davenport ND, Karatekin C, White T, Lim KO. Differential fractional anisotropy abnormalities in adolescents with ADHD or schizophrenia. Psychiatry research. 2010;181:193–198. doi: 10.1016/j.pscychresns.2009.10.012. [DOI] [PMC free article] [PubMed] [Google Scholar]
- Durston S, Casey BJ. What have we learned about cognitive development from neuroimaging? Neuropsychologia. 2006;44:2149–2157. doi: 10.1016/j.neuropsychologia.2005.10.010. [DOI] [PubMed] [Google Scholar]
- Ewing-Cobbs L, Hasan KM, Prasad MR, Kramer L, Bachevalier J. Corpus callosum diffusion anisotropy correlates with neuropsychological outcomes in twins disconcordant for traumatic brain injury. American Journal of Neuroradiology. 2006;27:879–881. [PMC free article] [PubMed] [Google Scholar]
- Fink F, Klein J, Lanz M, Mitrovics T, Lentschig M, Hahn HK, Hildebrandt H. Comparison of diffusion tensor-based tractography and quantified brain atrophy for analyzing demyelination and axonal loss in MS. Journal of Neuroimaging. 2009;20:334–344. doi: 10.1111/j.1552-6569.2009.00377.x. [DOI] [PubMed] [Google Scholar]
- Hamilton LS, Levitt JG, O’Neill J, Alger JR, Luders E, Phillips OR, Caplan R, Toga AW, McCracken J, Narr KL. Reduced white matter integrity in attention-deficit hyperactivity disorder. Neuroreport. 2008;19:1705–1708. doi: 10.1097/WNR.0b013e3283174415. [DOI] [PMC free article] [PubMed] [Google Scholar]
- Helpern JA, Adisetiyo V, Falangola MF, Hu C, Di Martino A, Williams K, Castellanos FX, Jensen JH. Preliminary evidence of altered gray and white matter microstructural development in the frontal lobe of adolescents with attention-deficit hyperactivity disorder: a diffusional kurtosis imaging study. Journal of Magnetic Resonance Imaging. 2011;33:17–23. doi: 10.1002/jmri.22397. [DOI] [PMC free article] [PubMed] [Google Scholar]
- Hoeft F, Barnea-Goraly N, Haas BW, Golarai G, Ng D, Mills D, Korenberg J, Bellugi U, Galaburda A, Reiss AL. More is not always better: increased fractional anisotropy of superior longitudinal fasciculus associated with poor visuospatial abilities in Williams syndrome. Journal of Neuroscience. 2007;27:11960–11965. doi: 10.1523/JNEUROSCI.3591-07.2007. [DOI] [PMC free article] [PubMed] [Google Scholar]
- Jastak S, Wilkinson GS. Administration Manual. 3. Jastak Associates; Wilmington, DE: 1993. The Wide Range Achievement Test. [Google Scholar]
- Kim DS, Kim M. Combining functional and diffusion tensor MRI. Annals of the New York Academy of Sciences. 2005;1064:1–15. doi: 10.1196/annals.1340.005. [DOI] [PubMed] [Google Scholar]
- Kobel M, Bechtel N, Specht K, Klarhofer M, Weber P, Scheffler K, Opwis K, Penner IK. Structural and functional imaging approaches in attention deficit/hyperactivity disorder: Does the temporal lobe play a key role? Psychiatry Research. 2010;183:230–236. doi: 10.1016/j.pscychresns.2010.03.010. [DOI] [PubMed] [Google Scholar]
- Krain AL, Castellanos FX. Brain development and ADHD. Clinical Psychology Review. 2006;26:433–444. doi: 10.1016/j.cpr.2006.01.005. [DOI] [PubMed] [Google Scholar]
- Lahey BB, Flagg EW, Bird HR, et al. The NIMH methods for the epidemiology of child and adolescent mental disorders (MECA) study: Background and methodology. Journal of the American academy of Child and Adolescent Psychiatry. 1996;35:855–864. doi: 10.1097/00004583-199607000-00011. [DOI] [PubMed] [Google Scholar]
- Lancaster JL, Rainey LH, Summerlin JL, Freitas CS, Fox PT, Evans AC, Toga AW, Mazziotta JC. Automated labeling of the human brain: a preliminary report on the development and evaluation of a forward-transform method. Human Brain Mapping. 1997;5:238–242. doi: 10.1002/(SICI)1097-0193(1997)5:4<238::AID-HBM6>3.0.CO;2-4. [DOI] [PMC free article] [PubMed] [Google Scholar]
- Lancaster JL, Woldorff MG, Parsons LM, Liotti M, Freitas CS, Rainey L, Kochunov PV, Nickerson D, Mikiten SA, Fox PT. Automated Talairach atlas labels for functional brain mapping. Human Brain Mapping. 2000;10:120–131. doi: 10.1002/1097-0193(200007)10:3<120::AID-HBM30>3.0.CO;2-8. [DOI] [PMC free article] [PubMed] [Google Scholar]
- Landman BA, Farrell JA, Jones CK, Smith SA, Prince JL, Mori S. Effects of diffusion weighting schemes on the reproducibility of DTI-derived fractional anisotropy, mean diffusivity, and principal eigenvector measurements at 1.5T. Neuroimage. 2007;36:1123–1138. doi: 10.1016/j.neuroimage.2007.02.056. [DOI] [PMC free article] [PubMed] [Google Scholar]
- Li Q, Sun J, Guo L, Zang Y, Feng Z, Huang X, Yang H, Lv Y, Huang M, Gong Q. Increased fractional anisotropy in white matter of the right frontal region in children with attention-deficit/hyperactivity disorder: a diffusion tensor imaging study. Neuroendocrinology Letters. 2010;31:747–753. [PubMed] [Google Scholar]
- Liston C, Cohen MM, Teslovich T, Levenson D, Casey BJ. Atypical prefrontal connectivity in attention-deficit/hyperactivity disorder: pathway to disease or pathological end point? Biological Psychiatry. 2011;69:1168–1177. doi: 10.1016/j.biopsych.2011.03.022. [DOI] [PubMed] [Google Scholar]
- Mori S, Wakana S, Nagae-Poetscher LM, van Zijl PCM. MRI Atlas of Human White Matter. Elsevier; Amsterdam: 2005. [Google Scholar]
- Nagel BJ, Bathula D, Herting M, Schmitt C, Kroenke CD, Fair D, Nigg JT. Altered white matter microstructure in children with attention-deficit/hyperactivity disorder. Journal of the American Academy of Child and Adolescent Psychiatry. 2011;50:283–292. doi: 10.1016/j.jaac.2010.12.003. [DOI] [PMC free article] [PubMed] [Google Scholar]
- Narberhaus A, Segarra D, Caldu X, Gimenez M, Pueyo R, Botet F, Junque C. Corpus callosum and prefrontal functions in adolescents with history of very preterm birth. Neuropsychologia. 2007;46:111–116. doi: 10.1016/j.neuropsychologia.2007.08.004. [DOI] [PubMed] [Google Scholar]
- Paloyelis Y, Mehta MA, Kuntsi J, Asherson P. Functional MRI in ADHD: A systematic literature review. Expert Review of Neurotherapeutics. 2007;7:1337–1356. doi: 10.1586/14737175.7.10.1337. [DOI] [PMC free article] [PubMed] [Google Scholar]
- Papagno C, Miracapillo C, Casarotti A, Romero Lauro LJ, Castellano A, Falini A, Casaceli G, Fava E, Bello L. What is the role of the uncinate fasciculus? Surgical removal and proper name retrieval. Brain. 2011;134:405–414. doi: 10.1093/brain/awq283. [DOI] [PubMed] [Google Scholar]
- Park HJ, Kim JJ, Lee SK, Seok JH, Chun J, Kim DI, Lee JD. Corpus callosal connection mapping using cortical gray matter parcellation and DT-MRI. Human Brain Mapping. 2006;29:503–516. doi: 10.1002/hbm.20314. [DOI] [PMC free article] [PubMed] [Google Scholar]
- Pavuluri MN, Yang S, Kamineni K, Passarotti AM, Srinivasan G, Harral EM, Sweeney JA, Zhou XJ. Diffusion tensor imaging study of white matter fiber tracts in pediatric bipolar disorder and attention-deficit/hyperactivity disorder. Biological Psychiatry. 2009;65:586–593. doi: 10.1016/j.biopsych.2008.10.015. [DOI] [PMC free article] [PubMed] [Google Scholar]
- Peterson DJ, Ryan M, Rimrodt SL, Cutting LE, Denckla MB, Kaufmann WE, Mahone EM. Increased regional fractional anisotropy in highly screened Attention-Deficit Hyperactivity Disorder (ADHD) Journal of Child Neurology. 2011;26:1296–1302. doi: 10.1177/0883073811405662. [DOI] [PMC free article] [PubMed] [Google Scholar]
- Poline JB, Worsley KJ, Evans AC, Friston KJ. Combining spatial extent and peak intensity to test for activations in functional imaging. Neuroimage. 1997;5:83–96. doi: 10.1006/nimg.1996.0248. [DOI] [PubMed] [Google Scholar]
- Qiu MG, Ye Z, Li QY, Liu GJ, Xie B, Wang J. Changes of brain structure and function in ADHD children. Brain Topography. 2010;24:243–252. doi: 10.1007/s10548-010-0168-4. [DOI] [PubMed] [Google Scholar]
- Sen PN, Basser PJ. A model for diffusion in white matter in the brain. Biophysical Journal. 2005;89:2927–2938. doi: 10.1529/biophysj.105.063016. [DOI] [PMC free article] [PubMed] [Google Scholar]
- Shaw P, Eckstrand K, Sharp W, Blumenthal J, Lerch JP, Greenstein D, Clasen L, Evans A, Giedd J, Rapoport JL. Attention-deficit/hyperactivity disorder is characterized by a delay in cortical maturation. Proceedings of the National Academy of Sciences, United States of America. 2007;104:19649–19654. doi: 10.1073/pnas.0707741104. [DOI] [PMC free article] [PubMed] [Google Scholar]
- Sidaros A, Engberg AW, Sidaros K, Liptrot MG, Herning M, Petersen P, Paulson OB, Jernigan TL, Rostrup E. Diffusion tensor imaging during recovery from severe traumatic brain injury and relation to clinical outcome: a longitudinal study. Brain. 2008;131:559–572. doi: 10.1093/brain/awm294. [DOI] [PubMed] [Google Scholar]
- Silk TJ, Vance A, Rinehart N, Bradshaw JL, Cunnington R. White-matter abnormalities in attention deficit hyperactivity disorder: A diffusion tensor imaging study. Human Brain Mapping. 2008;30:2757–2765. doi: 10.1002/hbm.20703. [DOI] [PMC free article] [PubMed] [Google Scholar]
- Skranes J, Vangberg TR, Kulseng S, Indredavik MS, Evensen KA, Martinussen M, Dale AM, Haraldseth O, Brubakk AM. Clinical findings and white matter abnormalities seen on diffusion tensor imaging in adolescents with very low birth weight. Brain. 2007;130:654–666. doi: 10.1093/brain/awm001. [DOI] [PubMed] [Google Scholar]
- Smith SM, Johansen-Berg H, Jenkinson M, Rueckert D, Nichols TE, Miller KL, Robson MD, Jones DK, Klein JC, Bartsch AJ, Behrens TE. Acquisition and voxelwise analysis of multi-subject diffusion data with tract-based spatial statistics. Nature Protocols. 2007;2:499–503. doi: 10.1038/nprot.2007.45. [DOI] [PubMed] [Google Scholar]
- Song SK, Sun SW, Ramsbottom MJ, Chang C, Russell J, Cross AH. Dysmyelination revealed through MRI as increased radial (but unchanged axial) diffusion of water. Neuroimage. 2002;17:1429–1436. doi: 10.1006/nimg.2002.1267. [DOI] [PubMed] [Google Scholar]
- Suzuki Y, Matsuzawa H, Kwee IL, Nakada T. Absolute eigenvalue diffusion tensor analysis for human brain maturation. NMR in Biomedicine. 2003;16:257–260. doi: 10.1002/nbm.848. [DOI] [PubMed] [Google Scholar]
- Szatkowska I, Szymanska O, Bojarski P, Grabowska A. Cognitive inhibition in patients with medial orbitofrontal damage. Experimental Brain Research. 2007;181:109–115. doi: 10.1007/s00221-007-0906-3. [DOI] [PubMed] [Google Scholar]
- Vaidya CJ, Stollstorff M. Cognitive neuroscience of Attention Deficit Hyperactivity Disorder: Current status and working hypotheses. Developmental Disabilities Research Reviews. 2008;14:261–267. doi: 10.1002/ddrr.40. [DOI] [PMC free article] [PubMed] [Google Scholar]
- Wechsler D. Wechsler Abbreviated Intelligence Scale: Administration Manual. The Psychological Corporation; San Antonio, TX: 1999. [Google Scholar]
- Werring DJ, Toosy AT, Clark CA, Parker GJ, Barker GJ, Miller DH, Thompson AJ. Diffusion tensor imaging can detect and quantify corticospinal tract degeneration after stroke. Journal of Neurology, Neurosurgery, and Psychiatry. 2000;69:269–272. doi: 10.1136/jnnp.69.2.269. [DOI] [PMC free article] [PubMed] [Google Scholar]
- Wilde EA, Chu Z, Bigler ED, Hunter JV, Fearing MA, Hanten G, Newsome MR, Scheibel RS, Li X, Levin HS. Diffusion tensor imaging in the corpus callosum in children after moderate to severe traumatic brain injury. Journal of Neurotrauma. 2006;23:1412–1426. doi: 10.1089/neu.2006.23.1412. [DOI] [PubMed] [Google Scholar]
- Xu J, Kober H, Carroll KM, Rounsaville BJ, Pearlson GD, Potenza MN. White matter integrity and behavioral activation in healthy subjects. Human Brain Mapping. 2011;33:994–1002. doi: 10.1002/hbm.21275. [DOI] [PMC free article] [PubMed] [Google Scholar]
- Yurgelun-Todd DA, Silveri MM, Gruber SA, Rohan ML, Pimentel PJ. White matter abnormalities observed in bipolar disorder: a diffusion tensor imaging study. Bipolar Disorders. 2007;9:504–512. doi: 10.1111/j.1399-5618.2007.00395.x. [DOI] [PubMed] [Google Scholar]