Abstract
The iNKT cells have emerged as an important regulator for immunity to infection, cancer as well as autoimmune diseases. The iNKT cells can be activated by glycolipids binding CD1d. The most effective iNKT ligand reported to date is α-galactosylceramide (α-GalCer) which stimulates iNKT cells to secrete both Th-1 and Th-2 cytokines. Indiscriminative induction of both types of cytokines may limit the therapeutic potential of iNKT ligands, as Th-1 and Th-2 cytokines play different roles under physiological and pathological conditions. Therefore a ligand with a biased cytokine release profile is highly desirable. Here we report the synthesis and biological activity of α-lactosylceramide (α-LacCer). Our data demonstrates that the α-LacCer can stimulate the iNKT cells to proliferate and release cytokines, both in vitro and in vivo. Interestingly, while α-LacCer is approximately 1,000-fold less efficient in inducing Th-1 cytokine, it is as potent as α-GalCer in the induction of Th-2 cytokine. Thus, α-LacCer is a novel compound that induces a biased cytokine release. The processing by β-glycosidase was critical for α-LacCer activity. Moreover, in experimental therapies, α-LacCer is at least as potent as α-GalCer in the treatment of tumors and experimental autoimmune encephalomyelitis.
Keywords: α-GalCer, α-LacCer, iNKT cell, glycolipids, CD1d
Introduction
Lipids and glycolipid antigens can be presented by MHC-I like CD1 molecules to non-MHC-restricted T lymphocytes [1]. CD1d is the protein which presents glycolipids to a particular cell population called invariant natural killer T cells (iNKT cells). The iNKT cells can co-express both the natural killer marker NK 1.1 and the semi-invariant T cell receptor (TCR) which is formed by Vα14-Jα18, Vβ8.2/Vβ7/Vβ2 chains in mice (Vα14i NKT cells) and Vα24-Jα18, Vβ11 chains in human (Vα24i NKT cells) [2,3,4]. The iNKT cells secrete the proinflammatory T helper 1 (Th-1) and immunoregulatory Th-2 cytokines and other chemokines within 2 to 6 hours of the stimulation. The secretion of cytokines allows the iNKT cells to regulate many in vivo conditions, including malignancy, infection and autoimmune diseases [5,6].
α-Galactosylceramide (α-GalCer) is currently the most active glycolipid antigen. Extracted from the marine sponge, Agelas mauritianus, by Kirin Brewery Company in 1993, α-GalCer was first featured in the prolonging of the life span of B16 cells intraperitoneally inoculated mice [7,8]. KRN-7000, with an 18-carbon sphingosine and 26-carbon acyl chain attached to the sugar moiety, is the most desirable model agonist for research and clinical usage among the α-GalCer analogs [9]. α-GalCer can be readily loaded onto CD1d on the surface of antigen presenting cells (APC) and the CD1d/α-GalCer complex will be recognized by the TCR on the iNKT cells. This interaction transiently triggers a massive iNKT cell response, which is characterized by production of cytokines, including both Th-1 and Th-2. As a result, the functions of other cell types, such as NK cells, dendritic cells (DC) and some subsets of B and/or T cells, are also affected.
α-GalCer has been demonstrated to have anti-tumor activity on a broad range of tumor cell lines in mouse transplant tumor models, including melanomas, lymphomas, colon, prostate, lung, breast and renal cancers [10,11,12]. The activation of NK cells, in response to the IFN-γ secreted by iNKT cells, has been proven to be critical for the anti-tumor activity. Based on the positive results from the animal test, several clinical trials have been conducted, including both phase I and phase II. However, no clear clinical benefits have been observed although the treatment of α-GalCer on humans is generally safe [13]. Mechanistic studies revealed the treatment effects of α-GalCer were highly variable depending on the iNKT cell number in the patients’ blood. Furthermore, α-GalCer caused the iNKT cells to become unresponsive for a period of time, even lasting more than 1 month in a mouse model [14]. Besides the cancer treatments, α-GalCer has also shown efficacy in the treatment of autoimmune diseases in mouse models, including autoimmune diabetes [15,16], and experimental autoimmune encephalomyelitis (EAE) [17,18,19]. Some promising effects of α-GalCer on organ transplants and atherosclerosis have also been proven in animal models [20,21]. However, observations show that α-GalCer plays different roles in these autoimmune diseases. For example, the activation of iNKT cells can suppress diseases like type I diabetes, multiple sclerosis, but, for atherosclerosis, the activation of iNKT cells will promote the disease [2]. The latest results showed that the co-secretion of Th-1/Th-2 cytokines might cause the conflicts. For instance, the IFN-γ from activated iNKT cells can ameliorate the allergic asthma, but IL-4 secreted at the same time will increase the severity [22,23,24]. The success of using α-GalCer-loaded immature or mature DCs for the treatment of cancer in clinical trials further proved that the activation and expansion of iNKT cells represents the critical feature in cancer treatments [25,26]. However, the clinical data obtained so far suggests that the currently available compounds may have severe limitations.
Recent studies demonstrated that α-GalCer could induce anergy of iNKT cells, perhaps due to paralysis associated with the most potent agonist. In addition, since Th-1 and Th-2 cytokines are usually reciprocal inhibitors of each other under physiological and pathological conditions, an agonist that stimulates both equally well may have limited clinical benefit. Based on these considerations, a less active agonist which can avoid anergy but stimulate lopsided Th-1/Th-2 cytokine release would be worth exploring. Here, the biological activities of a newly synthesized glycolipid antigen, α-lactosylceramide (α-LacCer) have been assayed and it is found that this compound has similar iNKT cell activation intensity but with a different cytokine release profile from α-GalCer.
Results and Discussion
α-LacCer can stimulate cytokine release in the in vitro assay
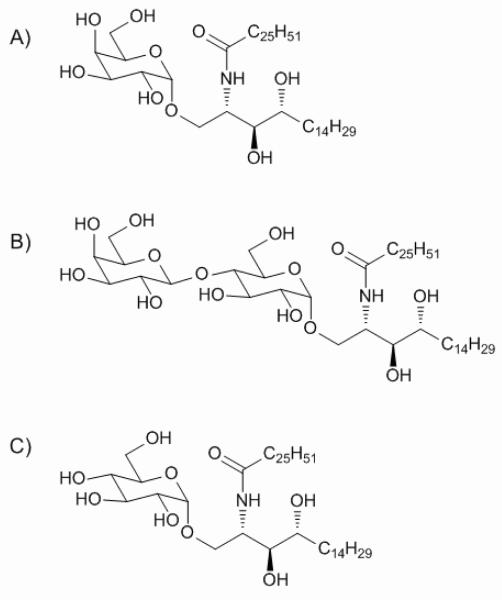
The structures of key glycolipids mentioned here, α-GalCer, α-LacCer and α-GlcCer are shown in Scheme 1.
Scheme 1.
The structure of α-GalCer (A), α-LacCer (B) and α-GlcCer (C).
As the initial test for α-LacCer’s activity for iNKT cells, the iNKT hybridoma assay was first applied here. The glycolipid treated CD1d expressing A/20 cells were used to stimulate the iNKT hybridoma cells. The IL-2 released by stimulated hybridoma cells was quantified. Although not as potent as α-GalCer, the α-LacCer still reached a significant activity level on the in vitro stimulation of iNKT hybridoma cells (Figure 1).
Figure 1.

In vitro hybridoma stimulation by the α-GalCer and the α-LacCer.
In the in vitro cytokine stimulation assay, a mouse spleen cell mixture, which contained both antigen presenting cell (APC) and iNKT cells, was treated with the glycolipids. IFN-γ and IL-4, taken as the representations of Th-1 and Th-2 cytokines released by the splenocytes, respectively, were quantified. α-GalCer and α-LacCer showed different cytokine release profiles in this in vitro stimulation experiment (Figure 2). For IFN-γ, Th-1 type cytokine, α-GalCer induced a significant iNKT cell cytokine release at the concentration of 0.01 ng/mL. Meantime, α-LacCer was 1,000 to 10,000 times less efficient. In contrast, for IL-4, which represents the Th-2 cytokine, α-GalCer and α-LacCer have similar stimulating capabilities. Therefore, α-LacCer is more prone to induce Th-2 cytokine in comparison to α-GalCer.
Figure 2.
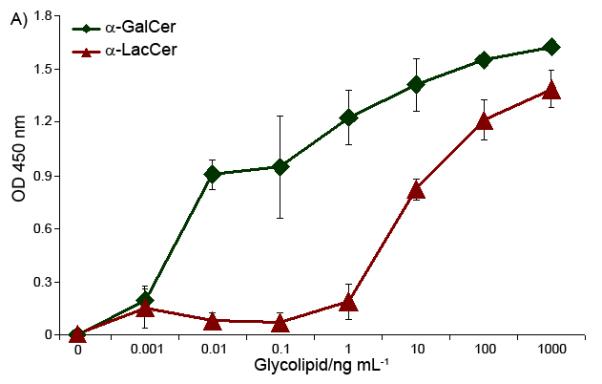
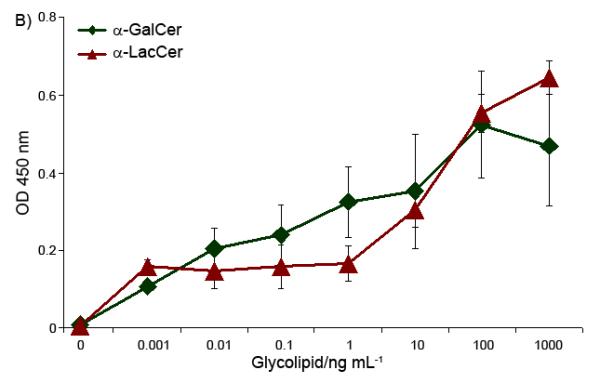
In vitro stimulation of Th-1 (IFN-γ, Part A) and Th-2 (IL-4, Part B) cytokines by glycolipids.
β-Galactosidase is critical to α-LacCer’s activity
α-LacCer has a disaccharide ‘head’, instead of the monosaccharide as with α-GalCer. To find out whether the disaccharide is processed before binding to CD1d, α-LacCer’s iNKT cell stimulation activity was tested with a β-galactosidase inhibitor presenting in the culture. PETG (2-Phenylethyl β-D-Thiogalactoside, Sigma-Aldrich) was used here as the β-galactosidase inhibitor, and, an α-galactosidase inhibitor, DGJ (Deoxygalactonojirimycin hydrochloride, Sigma-Aldrich) was used as a control. After being pre-treated with 2 mM β-galactosidase inhibitor, the splenocytes were cultured with glycolipid antigens. Once the β-galactosidase inhibitor was added, the α-LacCer lost its ability to activate the iNKT cells, for both Th-1 and Th-2 cytokines (Figure 3).
Figure 3.
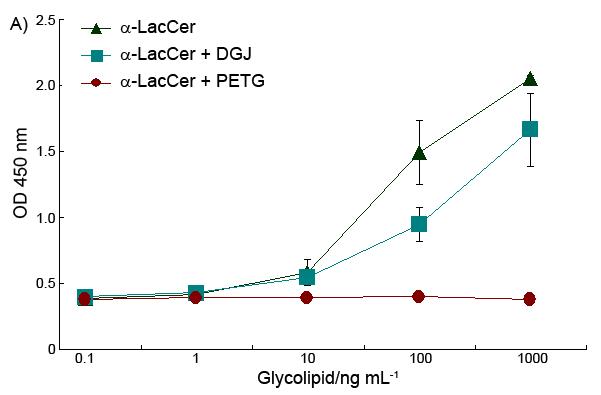
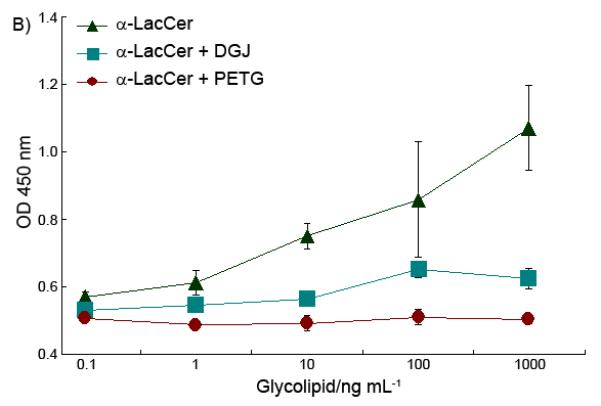
Effect of β-galactosidase inhibitor on α-LacCer’s ability to stimulate cytokine release of both IFN-γ (A) and IL-4 (B).
This data demonstrated that the removal of the outside sugar is critical to α-LacCer activity. The processing of α-LacCer, which hydrolyzed α-LacCer into α-GlcCer, played a critical role to finish the final modification of the glycolipid antigens. This extra modification process may cause the time delay of the glycolipid antigen presentation, which affects the final cytokine profile of α-LacCer, which is different to that obtained when applying α-GlcCer directly, as shown in Figure 4.
Figure 4.

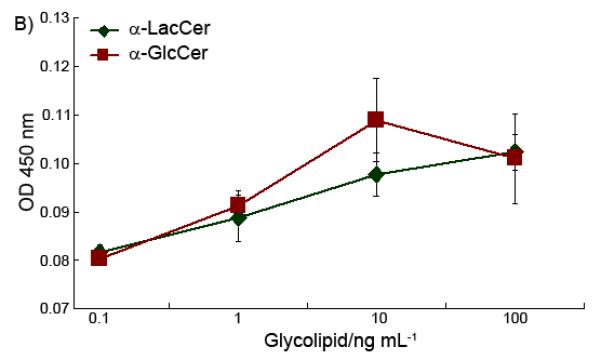
Stimulation of IFN-γ (A) and IL-4 (B) cytokine release by α-GlcCer and α-LacCer.
α-LacCer has to be hydrolyzed to α-GlcCer to become an active antigen. However, recent work has shown that the 4′-OH of α-GlcCer does not form hydrogen bonds with CD1d. Thus, modification on this position won’t affect the binding with CD1d [27]. Accordingly, besides the time delay, another possible reason for decreasing activity may be that, part of the α-LacCer that has not been hydrolyzed to α-GlcCer competes with α-GlcCer to bind with the CD1d and cause a subdued activity compared to α-GlcCer itself.
Compared to the previous work on α-GlcCer [28] and according to our own results, α-LacCer and α-GlcCer showed distinguishable cytokine stimulation properties. For monosaccharide glycolipids, the differences in cytokine stimulation activities mostly come from differences in the CD1d/glycolipid/TCR complex stability [28]. However, for the activity difference between α-LacCer and α-GlcCer, the complex stability is not an issue. The extra processing procedure should be the main reason. This is evidence proving that, the stimulatory ability and overall immunological output of the glycolipid antigens are not only related to the binding between CD1d/glycolipid/TCR, but are also affected by the in vivo antigen processing procedure.
T cells are in vivo activated by α-LacCer
Glycolipids were injected into mice to determine whether the sugar cap changed the glycolipid’s in vivo T cell stimulation profile. Different T cell populations from the glycolipid treated mice spleens were analyzed by flow cytometry. For the iNKT cells (β-TCR+/CD1d-Tetramer+), both α-GalCer and α-LacCer can stimulate and retain a significant iNKT cell population even 10 days after compound injection (Figure 5A). α-LacCer can reach stimulation strength close to that of α-GalCer. After being activated, both CD4+ and CD8+ T cells will acquire a memory cell phenotype, which is characterized by CD62Llow/CD44hi. The memory T cells in the mice spleen also showed the proliferation effects after glycolipid injection compared to the vehicle control (Figure 5B and 5C). However, no statistic difference between α-GalCer and α-LacCer can be recognized.
Figure 5.
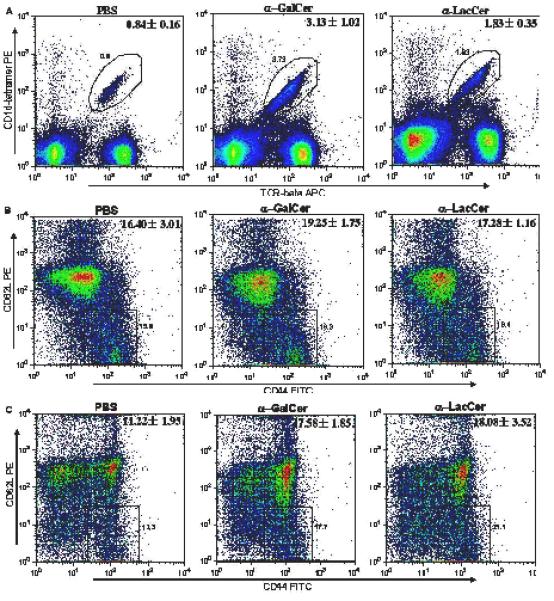
In vivo T cell stimulation of iNKT cells (β-TCR+/CD1d-Tetramer+, Part A) and memory cells (CD62Llow/CD44hi, Part B for CD4+, Part C for CD8+ T cells) by glycolipids.
α-LacCer stimulates iNKT cell proliferation with similar kinetics in both the spleen and liver
It has been characterized that when α-GalCer activates the iNKT cell, the TCR, NK1.1 and other iNKT cell surface markers will be initially suppressed but then return to normal after 12 to 24 hours. The iNKT cells rapidly proliferate and expand extensively then, reaching the maximal cell number 3 days after injection [1,29,30,31]. The time course experiment showed that α-LacCer had exactly same iNKT cell stimulation time pattern as α-GalCer, which also reached the apex 72 hours after injection, both in the spleen and liver (Figure 6). However, while α-LacCer and α-GalCer have comparable optimal activity, α-LacCer is less effective than α-GalCer in terms of maximal expansion of iNKT cell population in the spleen.
Figure 6.
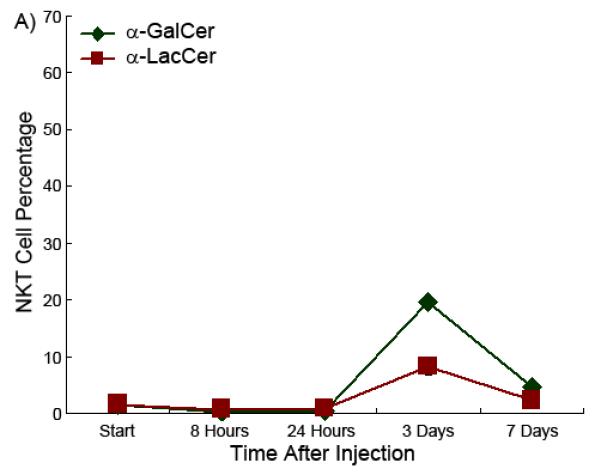
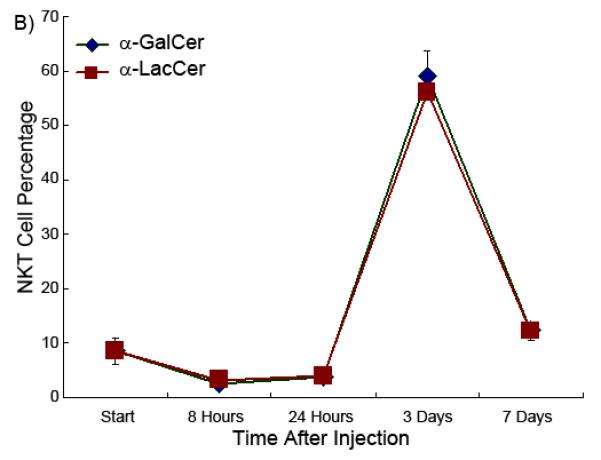
iNKT cell percentage as a function of time in the spleen (Part A) and liver (Part B) in the presence of glycolipids.
α-LacCer has similar anti-tumor effects as α-GalCer in the mouse model
Transplantable MC38 tumor was used as a model to test the glycolipid antigens’ anti-tumor activity. Most of the tumors reached the 0.5-1.0 cm diameter around 10 days after inoculation. At this point, the tumor bearing mice were treated by i.p. injection of drugs or vehicles. The tumors treated with the glycolipid antigens shrank in size on the day after injection. This shrinkage, however, was transient as tumors reassumed growth on day 3. However, both glycolipid antigens inhibited the tumor growth rate (Figure 7A).
Figure 7.
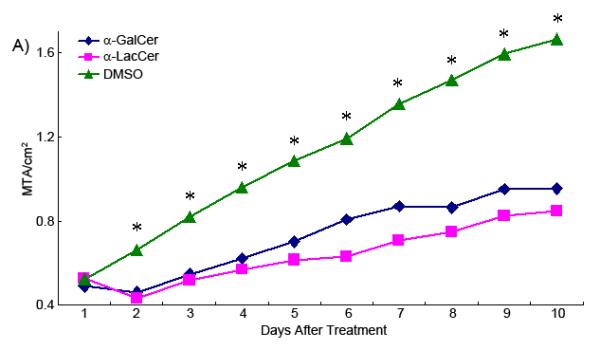
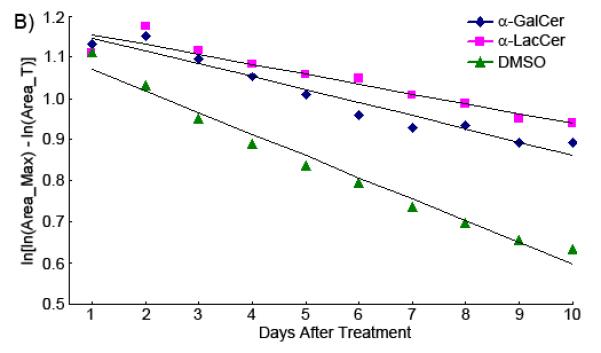
(A)Growth curve of glycolipid treated transplanted tumor. Statistical comparisons (Dunnet Multiple Comparison) were made between the DMSO group and glycolipid treated groups. Asterisks mean the tumor size of the DMSO group is significantly larger than the two glycolipid treated groups. *p<0.05. (MTA, Mean Tumor Area) (B) The specific growth rate curve of differently treated tumor groups.
Figure 7B shows the comparison of the best fit regression lines of the transformed Gompertz growth curve for tumors treated with α-GalCer, α-LacCer, and only DMSO. The slope (ζ) of the regression line is the specific growth rate of each tumor. It shows clearly in the figure that the growth rates for the tumors treated with α-GalCer and α-LacCer are very similar (ζ_α-GalCer = −0.0317; ζ_α-LacCer = −0.0241), both of which are much slower than the tumor treated with vehicle only (ζ_DMSO = −0.0527). Thus, the growth rate reduced 40 to 50 percent when the tumor was treated with glycolipids. The injection of α-GalCer or α-LacCer can suppress the growth rate of transplanted tumors, compared to the non-treatment control.
α-LacCer also has anti-autoimmune disease effect in the mouse model
Previous studies have demonstrated that α-GalCer has preventive effects on EAE if administrated either before or shortly after induction of EAE. To determine potential therapeutic effects of the drugs, we treated mice at seven days after immunization with the MOG peptide, which is generally used to induce EAE in C57BL/6 mice. At this point, the inflammation to the CNS has been initiated and most of immunized mice started to show some symptoms from the 12th day after immunization. Mice treated with either drug showed reduction of EAE score, especially for the peak stage and the healing stage (Figure 8). The α-LacCer-treated group showed a better healing curve compared to the α-GalCer treated group. Thus in the therapeutic model, α-LacCer appears slightly more efficient than α-GalCer. Since EAE can be ameliorated by an enhanced Th-2 response, the increased efficiency in inducing Th-2 cytokine may explain the superior activity of the α-LacCer.
Figure 8.
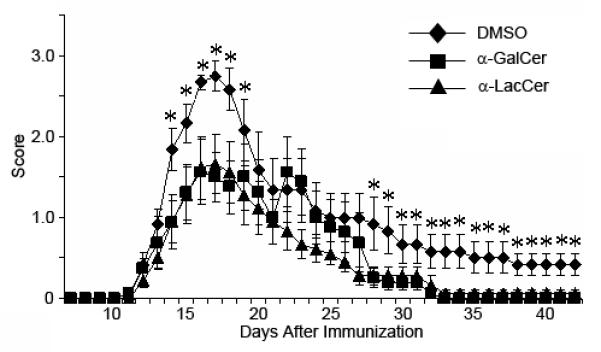
Effect of glycolipid on EAE development in the mouse model. Asterisks mean the disease score of the DMSO treated group is significantly higher than the glycolipid treated groups (Dunnet Multiple Comparison). *P<0.1.
Conclusion
Taken together, we demonstrated that α-LacCer, a novel chemical, is capable of stimulating iNKT cells. Compared to α-GalCer, α-LacCer showed a biased cytokine profile and showed a slightly enhanced therapeutic effect in tumor rejection and inhibition of autoimmune encephalomyelitis. Therefore, α-LacCer may have better potential in clinical treatments.
Experimental Section
Mice and animal care
All the mice were purchased from Jackson Lab and housed in the Ohio State University and OncoImmune animal facilities. All the experiments are carried out according to the approved protocols.
Cell line and cell culture
A20/CD1 cells and DN3A4-1.2 cells were kindly provided by Dr. Mitchell Kronenberg (La Jolla Institute for Allergy and Immunology, La Jolla, CA). Both of the cells were cultured in RPMI1640 with FBS (10%), L-Glutamine (2.05 mM) and penicillin (1%), at 37 ° with CO2 (5%). The MC38 cells were cultured and maintained in DMEM with FBS (10%), L-Glutamine (2.05 mM) and penicillin (1%), at 37 ° with CO2 (5%).
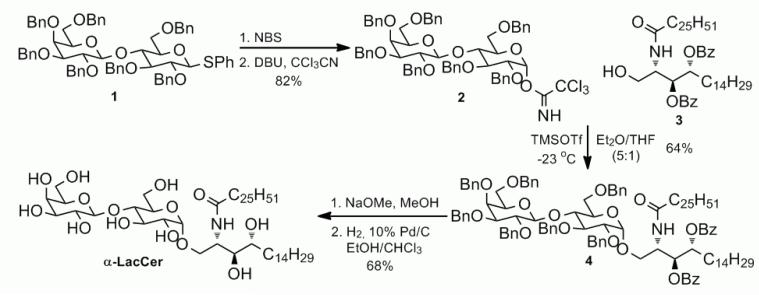
Synthesis of α-lactosylceramide
The synthesis is followed the protocol of preparation of α-GalCer as shown in Scheme 2.32
Scheme 2.
Synthesis of α-LacCer via the trichloroacetimidate method.
2,3,6,2′,3′,4′,6′-Hepta-O-benzyl-1-α-D-lactosyl trichloroacetimidate (2)
N-Bromo-succinimide (374 mg, 2.1 mmol) was added to a solution of phenyl-hepta-benzyl-1-thio-D-lactose 1 [33] (1.03 g, 1.0 mmol) in acetone (9 mL) and water (1 mL) at 0 ° and was stirred for 30 min. The reaction was quenched by addition of saturated aqueous sodium bicarbonate. The organic solvent was removed in vacuo, and the remaining aqueous solution was extracted with ethyl acetate. After it was drying over anhydrous sodium sulfate, the extract was concentrated, after which the residue was dissolved in dry dichloromethane (10 mL). Trichloroacetonitrile (1 mL, 10.0 mmol) and 1,8-diazabicyclo[5.4.0]undec-7-ene (70 μL, 0.5 mmol) were added. The reaction mixture was stirred for 2h. The solvent was evaporated and the residue was purified by chromatography to give 0.92 g of the product in 82% yield. 1H NMR (500 MHz, CDCl3) δ 8.62 (s, 1H, CCl3C=NH), 7.39-7.15 (m, 35H, 7 × Ph), 6.48 (d, J = 3.6 Hz, 1H, H-1), 5.08 (d, J = 10.7 Hz, 1H, PhCH2), 5.04 (d, J = 11.5 Hz, 1H, PhCH2), 4.87 (d, J = 11.1 Hz, 1H, PhCH2), 4.81-4.73 (m, 6H, PhCH2), 4.61 (d, J = 11.5 Hz, 1H, PhCH2), 4.57 (d, J = 12.1 Hz, 1H, PhCH2), 4.43 (d, J = 11.4 Hz, 1H, PhCH2), 4.40 (d, J = 7.0 Hz, 1H, H-1′), 4.36 (d, J = 12.0 Hz, 1H, PhCH2), 4.31 (d, J = 11.9 Hz, 1H, PhCH2), 4.13 (t, J = 9.6 Hz, 1H, H-1′), 4.01-3.96 (m, 3H), 3.93 (dd, J = 11.1, 2.9 Hz, 1H), 3.81 (dd, J = 9.7, 7.8 Hz, 1H), 3.74 (dd, J = 9.6, 3.6 Hz, 1H), 3.62 (t, J = 8.6 Hz, 1H), 3.54 (dd, J = 11.1, 1.5 Hz, 1H), 3.45-3.39 (m, 3H); 13C NMR (125 MHz, CDCl3) δ 161.22, 139.19, 139.13, 138.80, 138.60, 138.32, 138.19, 138.05, 128.63, 128.43, 128.35, 128.24, 128.22, 128.05, 127.98, 127.92, 127.87, 127.81, 127.75, 127.74, 127.63, 127.60, 127.50, 127.45, 127.39, 127.13, 102.86, 94.58, 91.46, 82.51, 79.86, 79.69, 78.40, 78.04, 75.81, 75.48, 75.25, 74.75, 73.96, 73.69, 73.47, 73.20, 73.14, 73.10, 72.59, 68.15, 67.51; HRMS calcd. for C63H64Cl3NO11Na ([M + Na]+) 1138.3443, found 1138.3459.
(2S,3S,4R)-2-(Hexacosanoylamino)-3,4-dibenzoyl-1-O-(2,3,6,2′,3′,4′,6′-hepta-O-benzyl-α-D-lacto syl)-1,3,4-octadecanetriol (4)
A suspension of acceptor 3 [32] (48 mg, 0.053 mmol), donor 2 (120 mg, 0.11 mmol) and 4Å molecular sieves (0.3 g) in diethyl ether and tetrahydrofuran (5:1, 2 mL) was stirred at room temperature for 0.5h. After cooling to −23 °C, trimethylsilyl trifluoromethanesulfonate (5 μL, 0.027 mmol) was added. The resulting mixture was stirred for additional 2h. Triethyl amine was added to quench the reaction, and the mixture was filtered through a Celite pad. The filtrate was concentrated and purified by chromatography using hexane and ethyl acetate (4:1) to afford 63 mg of white solid in 64% yield. The newly formed glycosidic linkage between the saccharide and ceramide was characterized by 1H NMR (δ 4.79 ppm, 13 JH1′-H2′ = 3.7 Hz) and 13C-1H coupling NMR (δ 98.5 ppm, JC1′-H1′= 170.3 Hz) as the α configuration 34. 1H NMR (500 MHz, CDCl3) δ 8.08 (dd, J = 8.4, 1.3 Hz, 2H, PhCO), 7.97 (dd, J = 8.5, 1.3 Hz, 2H, PhCO), 7.61 (tt, J = 7.5, 1.0 Hz, 1H, PhCO), 7.53 (tt, J = 7.5, 1.2 Hz, 1H, PhCO), 7.49 (t, J = 7.9 Hz, 2H, PhCO), 7.38 (t, J = 8.0 Hz, 2H, PhCO), 7.37-7.13 (m, 35H, 7 × PhCH2), 6.76 (d, J = 9.3 Hz, 1H, CONH), 5.77 (dd, J = 9.0, 2.9 Hz, 1H, H-3), 5.43 (dt, J = 9.0, 3.3 Hz, 1H, H-4), 5.04 (d, J = 10.7 Hz, 1H, PhCH2), 4.99 (d, J = 11.4 Hz, 1H, PhCH2), 4.83 (d, J = 11.3 Hz, 1H, PhCH2), 4.79 (d, J = 3.7 Hz, 1H, H-1′), 4.78 (d, J = 11.0 Hz, 1H, PhCH2), 4.73 (d, J = 11.9 Hz, 1H, PhCH2), 4.72 (d, J = 11.4 Hz, 1H, PhCH2), 4.71 (d, J = 11.9 Hz, 1H, PhCH2), 4.67 (d, J = 11.0 Hz, 1H, PhCH2), 4.65 (m, 1H, H-2), 4.64 (d, J = 11.5 Hz, 1H, PhCH2), 4.57 (d, J = 11.4 Hz, 1H, PhCH2), 4.53 (d, J = 12.1 Hz, 1H, PhCH2), 4.38 (d, J = 11.9 Hz, 1H, PhCH2), 4.34 (d, J = 7.7 Hz, 1H, H-1”), 4.32 (d, J = 12.1 Hz, 1H, PhCH2), 4.25 (d, J = 11.9 Hz, 1H, PhCH2), 3.92-3.89 (m, 2H), 3.85 (dd, J = 10.9, 3.5 Hz, 1H), 3.80-3.71 (m, 5H), 3.56-3.53 (m, 2H), 3.49 (dd, J = 9.6, 3.7 Hz, 1H, H-2′), 3.39-3.32 (m, 2H), 2.19(t, J = 7.5 Hz, 2H, RCH2CONH), 1.94 (m, 2H, H-5), 1.64 (m, 2H), 1.43-1.22 (m, 68H), 0.93 (t, J = 6.8 Hz, 3H, CH3), 0.92 (t, J = 6.9 Hz, 3H, CH ); 133 C NMR (125 MHz, CDCl3) δ 173.1, 166.2, 165.3, 139.4, 139.1, 138.8, 138.6, 138.3, 138.1, 138.0, 133.3, 132.9, 130.1, 129.9, 129.8, 129.77, 128.6, 128.4, 128.34, 128.31, 128.27, 128.2, 128.16, 128.1, 128.0, 127.9, 127.8, 127.7, 127.66, 127.6, 127.54, 127.5, 127.4, 127.39, 127.3, 127.0, 103.0, 98.5, 82.6, 80.0, 79.8, 79.3, 76.6, 75.3, 75.2, 74.7, 74.0, 73.7, 73.4, 73.3, 73.2, 73.1, 72.6, 72.5, 70.9, 68.2, 68.0, 67.5, 48.6, 36.7, 32.0, 29.8, 29.7, 29.68, 29.66, 29.61, 29.6, 29.5, 29.4, 29.38, 28.6, 25.73, 25.71, 25.7, 22.7, 14.1;HRMS calcd. for C119H159NO16Na ([M + Na]+) 1882.1590, found 1882.1578.
(2S,3S,4R)-2-(Hexacosanoylamino)-1-O-(α-D-lactosyl)-1,3,4-octadecanetriol (α-LacCer)
A solution of protected lactosylceramide 4 (60 mg, 0.032 mmol) in dry methanol (2 mL) was treated with NaOMe (5 mg) for 30 min. The reaction mixture was neutralized with Amberlyst resin and filtered. The filtrate was concentrated and the residue was dissolved in a mixture of CHCl3/EtOH (4:1, 2 mL) followed by addition of 10% Pd/C (4 mg). The resulting suspension was stirred under 1 atm H2 for 4 h. The catalyst was filtered and the filtrate was concentrated. The residue was purified by chromatography (CHCl3/MeOH, 4:1) to give 22 mg of product in 68% yield. 1H NMR (500 MHz, pyridine-d5) δ 8.44 (d, J = 8.4 Hz, CONH), 6.45 (br, 9H, 9 × OH), 5.46 (d, J = 3.6 Hz, 1H, H-1′), 5.17 (m, 1H, H-2), 5.02 (d, J = 7.8 Hz, 1H, H-1”), 4.55 (dd, J = 10.9 Hz, 1H), 4.49-4.39 (m, 5H), 4.38-4.25 (m, 5H), 4.17 (t, J = 9.0 Hz, 1H), 4.11 (dd, J = 6.1, 3.3 Hz, 1H), 4.09 (t, J = 6.7 Hz, 1H), 4.05 (dd, J = 9.4, 3.7 Hz, 1H), 2.41 (t, J = 7.5 Hz, 2H, RCH2CO), 2.23 (m, 1H), 1.87 (m, 2H), 1.78 (m, 2H), 1.64 (M, 1H), 1.43-1.17 (m, 68H), 0.85 (t, J = 6.4 Hz, 6H, 2 × CH ); 13C NMR (125 MHz, pyridine-d5) δ 173.0, 105.4, 100.2, 82.2, 77.0, 76.3, 75.0, 73.2, 72.8, 72.2, 72.1, 69.8, 68.0, 61.9, 61.8, 51.1, 36.5, 34.1, 31.9, 30.2, 29.9, 29.8, 29.77, 29.7, 29.68, 29.6, 29.59, 29.5, 29.4, 29.37, 29.2, 26.1, 22.7, 14.0; HRMS calcd. for C56H109NO14Na ([M + Na]+) 1042.7746, found 1042.7759.
In vitro hybridoma stimulation assay
Glycolipids were dissolved in DMSO at 1000× the indicated concentration and were then added into A20/CD1 cells (1×10⁶ cells, 1 mL) to reach the indicated concentration. After 16 hours of culturing, the A20/CD1 cells were washed with media. Then, pre-treated A20/CD1 cells (0.1×10⁶ cells) were mixed with DN3A4-1.2 hybridoma cells in media (0.5×10⁵ cells, 200 μL). The mixture was cultured for another 16 hours and the IL-2 in the supernatant was measured by ELISA. The ELISA was carried out according to the previously published procedure [35]. The supernatant was first incubated in a purified anti-IL-2 coated 96-well plate and then the biotin conjugated anti-IL-2 (both from EBioscience) second antibody was used. The HRP-streptavidin conjugate was applied to detect the second antibody with TMB substrate. The plate was read at 450 nm.
In vitro cytokine stimulation assay
To do the in vitro stimulation, the single cell suspension from the mice spleens was cultured with glycolipid antigens, α-GalCer or α-LacCer, at different concentrations for 72 hours. The supernatant of the culture was taken out for ELISA to measure the IFN-γ and IL-4 which were released. To do the cytokine ELISA, the supernatant of the culture was first overnight cultured in the anti-IFN-γ or anti-IL-4 capture antibody (BD Biosciences) coated wells. Biotin labeled rat-anti-mice IFN-γ or IL-4 antibodies (BD Biosciences) were then used as second antibodies followed by culturing with the Streptavidan-HRP (BD Biosciences). The OPD kit (Sigma-Aldrich) was used to develop the color and HCl (2 M) was added to each well to stop the reaction. The plates were read on a plate reader at a wavelength of 492 nm.
The in vivo T-cell stimulation
Six week old C57BL/6 mice were used here. Taking three mice as a group, α-GalCer or α-LacCer in vehicle solvent (1:25 DMSO in pH 7.0 PBS solution) (8 μg, 200 μL) was intravenously injected through the mice tail vein. Vehicle solvent without any compound was used as the control. 10 days after injection, the mice were sacrificed and the splenocytes were stained by fluorescence conjugated mAb against CD4, NK1.1, β-TCR (BD Biosciences) and PBS57-loaded-CD1d-tetramer (NIH Tetramer Facility). All the stained samples were analyzed by flow cytometry.
Time course of iNKT cell in vivo stimulation in mice spleen and liver
Two compounds, α-GalCer and α-LacCer were i.v. injected into C57BL/6 mice in vehicle solvent (1:25 DMSO in pH 7.0 PBS solution) (8 μg, 200 μL). At different time points (starting point, 8 hours, 24 hours, 3 days and 7 days), mice were sacrificed and iNKT cells in both the spleen and liver were stained and analyzed as in the previous experiment.
Anti-tumor growth activity of glycolipid antigens
The mice transplant tumor was applied as in vivo model to test the anti-tumor activity of glycolipid antigens. To induce the tumor growth, MC38 cells (1 × 10⁶ cells) were injected into the rear flank of 6 week old male C57BL/6 mice. When the tumor grew up to 0.5-1.0 cm diameter, α-GalCer or α-LacCer in vehicle solvent (2 μg, 50 μL) was directly injected into the tumor. After the first injection, the mice were injected every other day, 5 times in total. For each treatment group, 6 mice with tumors were injected and another group of mice received only vehicle solvent as a negative control. The tumor size was measured every day until the tumor diameter was over 2 cm or other early removal criteria were reached.
The results were analyzed by the quantitation method. Since depicting tumor size vs. time results in non-linear growth curves are complicated to describe and compare, the Gompertz equation S(T) = S(0) exp[(1- exp(-ζT)) C/ζ] [36] was utilized for further analysis of the growth rate of the tumor. The Gompertz equation can be transformed to ln[ln(Area_Max) – ln(Area_T)] = ln(C) –ζT to depict the growth rate of the tumor as a straight line when the size ln[ln(Area_Max) – ln(Area_T)] is plotted against time T. In this equation, Area_Max means a theoretical maximal area that the tumor can reach, while Area_T means the tumor area T days after transplantation. The Gompertz constant ζ is termed the specific growth rate of the tumor and k is the constant unrelated to this rate.
EAE model
Myelin-oligodendrocyte-glycoprotein (MOG, peptide p35-55, Sigma Genosys) was used to induce EAE. Female C57BL/6 mice were used at age 8 weeks. Equal volumes of MOG in complete Freund’s adjuvant (CFA, Difco Laboratories) (4 mg/mL) and mycobacterium tuberculosis H37Ra (Difco Laboratories) in CFA (8 mg/mL) were thoroughly mixed. The mixture (100 μL)was injected over 3 sites on the back of each mouse around the bottom of the tail (subcutaneously). Immediately after the immunization, pertussis toxin (PT, List Biological Laboratories, Inc) in PBS (200 μg, 200 μL) was intravenously injected into each mouse. Another injection followed 48 hours later.
The EAE developed after 8 to 9 days. The mice were observed every day and scored on a scale of 0 – 5 with gradations of 0.5 for intermediate scores. The criteria for scoring are listed as follows: 0, no clinical signs; 1, loss of tail tone; 2, wobbly gait; 3, hind limb paralysis; 4, moribund; and 5, death. The treatments, α-GalCer or α-LacCer in vehicle solvent (1:25 DMSO in pH 7.0 PBS solution) (8 μg, 200 μL), were given on the same day as immunization. Vehicle solvent without the glycolipid antigen was used as the negative control. For each treatment, 10 mice were used as a group.
Acknowledgements
The authors would like to thank Dr. Mitchell Kronenberg (LIAI, La Jolla, Ca) for providing us the A20/CD1 cells and hybridoma cells and NIH Tetramer Facility for providing the PBS57-loaded-CD1d-tetramer. The research work was supported by The Ohio State University (support to Peng George Wang) and NIH (CA123195 to Peng George Wang and Yang Liu).
Reference
- [1].Van Kaer L. Nat. Rev. Immunol. 2005;5:31–42. doi: 10.1038/nri1531. [DOI] [PubMed] [Google Scholar]
- [2].Parekh VV, Wilson MT, Van Kaer L. Crit. Rev. Immunol. 2005;25:183–213. doi: 10.1615/critrevimmunol.v25.i3.20. [DOI] [PubMed] [Google Scholar]
- [3].Bendelac A, Rivera MN, Park S-H, Roark JH. Annu. Rev. Immunol. 1997;15:535–562. doi: 10.1146/annurev.immunol.15.1.535. [DOI] [PubMed] [Google Scholar]
- [4].Kronenberg M, L., Gapin Nat. Rev. Immunol. 2002;2:557–568. doi: 10.1038/nri854. [DOI] [PubMed] [Google Scholar]
- [5].Serizawa I, Koezuka Y, Amao H, Saito TR, Takahashi KW. Exp. Anim. 2000;49:171–180. doi: 10.1538/expanim.49.171. [DOI] [PubMed] [Google Scholar]
- [6].Smyth MJ, Crowe NY, Hayakawa Y, Takeda K, Yagita H, Godfrey DI. Curr. Opin. Immunol. 2002;14:165–171. doi: 10.1016/s0952-7915(02)00316-3. [DOI] [PubMed] [Google Scholar]
- [7].Natori T, Koezuka Y, Higa T. Tetrahedron Lett. 1993;34:5591–5592. [Google Scholar]
- [8].Natori T, Morita M, Akimoto K, Koezuka Y. Tetrahedron. 1994;50:2771–2784. [Google Scholar]
- [9].Morita M, Motoki K, Akimoto K, Natori T, Sakai T, Sawa E, Yamaji K, Koezuka Y, Kobayashi E, Fukushima H. J. Med. Chem. 1995;38:2176–2187. doi: 10.1021/jm00012a018. [DOI] [PubMed] [Google Scholar]
- [10].Hayakawa Y, Rovero S, Forni G, Smyth MJ. Proc. Natl. Acad. Sci. U.S.A. 2003;100:9464–9469. doi: 10.1073/pnas.1630663100. [DOI] [PMC free article] [PubMed] [Google Scholar]
- [11].Wilson MT, Singh AK, Van Kaer L. Trends Mol. Med. 2002;8:225–231. doi: 10.1016/s1471-4914(02)02325-0. [DOI] [PubMed] [Google Scholar]
- [12].Swann J, Crowe NY, Hayakawa Y, Godfrey DI, Smyth MJ. Immunol.Cell Biol. 2004;82:323–331. doi: 10.1111/j.0818-9641.2004.01254.x. [DOI] [PubMed] [Google Scholar]
- [13].Kawano T, Cui J, Koezuka Y, Toura I, Kaneko Y, Sato H, Kondo E, Harada M, Koseki H, Nakayama T, Tanaka Y, Taniguchi M. Proc. Natl. Acad. Sci. U.S.A. 1998;95:5690–5693. doi: 10.1073/pnas.95.10.5690. [DOI] [PMC free article] [PubMed] [Google Scholar]
- [14].Parekh VV, Wilson MT, Olivares-Villagomez D, Singh AK, Wu L, Wang CR, Joyce S, Van Kaer L. J. Clin. Invest. 2005;115:2572–2583. doi: 10.1172/JCI24762. [DOI] [PMC free article] [PubMed] [Google Scholar]
- [15].Naumov YN, Bahjat KS, Gausling R, Abraham R, Exley MA, Koezuka Y, Balk SB, Strominger JL, Clare-Salzer M, Wilson SB. Proc. Natl. Acad. Sci. U.S.A. 2001;98:13838–13843. doi: 10.1073/pnas.251531798. [DOI] [PMC free article] [PubMed] [Google Scholar]
- [16].Sharif S, Arreaza GA, Zucker P, Mi Q-S, Sondhi J, Naidenko OV, Kronenberg M, Koezuka Y, DeLovitch TL, Gombert J-M, Leite-de-Moraes M, Gouarin C, Zhu B, Hameg A, Nakayama T, Taniguchi M, LePault F, Lehuen A, Bach J-F, Herbelin A. Nat. Med. 2001;7:1057–1062. doi: 10.1038/nm0901-1057. [DOI] [PubMed] [Google Scholar]
- [17].Illes Z, Kondo T, Newcombe J, Oka N, Tabira T, Yamamura T. J. Immunol. 2000;164:4375–4381. doi: 10.4049/jimmunol.164.8.4375. [DOI] [PubMed] [Google Scholar]
- [18].Jahng AW, Maricic I, Pedersen B, Burdin N, Naidenko O, Kronenberg M, Koezuka Y, Kumar V. J. Exp. Med. 2001;194:1789–1799. doi: 10.1084/jem.194.12.1789. [DOI] [PMC free article] [PubMed] [Google Scholar]
- [19].Miyamoto K, Miyake S, Yamamura T. Nature. 2001;413:531–534. doi: 10.1038/35097097. [DOI] [PubMed] [Google Scholar]
- [20].Seino K, Yanagisawa K, Taniguchi H, Takada Y, Yuzawa K, Otsuka M, Fukao K. Transplant. Proc. 2001;33:437–438. doi: 10.1016/s0041-1345(00)02082-0. [DOI] [PubMed] [Google Scholar]
- [21].Ostos MA, Recalde D, Zakin MM, Scott-Algara D. FEBS Lett. 2002;519:23–29. doi: 10.1016/s0014-5793(02)02692-3. [DOI] [PubMed] [Google Scholar]
- [22].Hachem P, Lisbonne M, Michel M-L, Diem S, Roongapinun S, Lefort J, Marchal G, Herbelin A, Askenase PW, Dy M, Leite-de-Moraes MC. Eur. J. Immunol. 2005;35:2793–2802. doi: 10.1002/eji.200535268. [DOI] [PubMed] [Google Scholar]
- [23].Lack G, Bradley KL, Hamelmann E, Renz H, Loader J, Leung DYM, Larsen G, Gelfand EW. J. Immunol. 1996;157:1432–1439. [PubMed] [Google Scholar]
- [24].Walter DM, Wong CP, DeKruyff RH, Berry GJ, Levy S, Umetsu DT. J. Immunol. 2001;166:6392–6398. doi: 10.4049/jimmunol.166.10.6392. [DOI] [PubMed] [Google Scholar]
- [25].Nieda M, Okai M, Tazbirkova A, Lin H, Yamaura A, Ide K, Abraham R, Juji T, David J. Macfarlane, Andrew J. Nicol. Blood. 2004;103:383–389. doi: 10.1182/blood-2003-04-1155. [DOI] [PubMed] [Google Scholar]
- [26].Ishikawa A, Motohashi S, Ishikawa E, Fuchida H, Higashino K, Otsuji M, Iizasa T, Nakayama T, Taniguchi M, Fujisawa T. Clin. Cancer Res. 2005;11:1910–1917. doi: 10.1158/1078-0432.CCR-04-1453. [DOI] [PubMed] [Google Scholar]
- [27].Wu D, Zajonc DM, Fujio M, Sullivan BA, Kinjo Y, Kronenberg M, Wilson IA, Wong CH. Proc. Natl. Acad. Sci. U.S.A. 2006;103:3972–3977. doi: 10.1073/pnas.0600285103. [DOI] [PMC free article] [PubMed] [Google Scholar]
- [28].Sidobre S, Hammond KJL, Benazet-Sidobre L, Maltsev SD, Richardson SK, Ndonye RM, Howell AR, Sakai T, Besra GS, Porcelli SA, Kronenberg M. Proc. Natl. Acad. Sci.U.S.A. 2004;101:12254–12259. doi: 10.1073/pnas.0404632101. [DOI] [PMC free article] [PubMed] [Google Scholar]
- [29].Wilson MT, Johansson C, Olivares-Villagomez D, Singh AK, Stanic AK, Wang C-R, Joyce S, Wick MJ, Van Kaer L. Proc. Natl. Acad. Sci. U.S.A. 2003;100:10913–10918. doi: 10.1073/pnas.1833166100. [DOI] [PMC free article] [PubMed] [Google Scholar]
- [30].Crowe NY, Uldrich AP, Kyparissoudis K, Hammond KJ, Hayakawa Y, Sidobre S, Keating R, Kronenberg M, Smyth MJ, Godfrey DI. J. Immunol. 2003;171:4020–4027. doi: 10.4049/jimmunol.171.8.4020. [DOI] [PubMed] [Google Scholar]
- [31].Harada M, Seino K, Wakao H, Sakata S, Ishizuka Y, Ito T, Kojo S, Nakayama T, Taniguchi M. Int. Immunol. 2004;16:241–247. doi: 10.1093/intimm/dxh023. [DOI] [PubMed] [Google Scholar]
- [32].Xia C, Yao Q, Schuemann J, Rossy E, Chen W, Zhu L, Zhang W, De Libero G, Wang PG. Bioorg. Med. Chem. Lett. 2006;16:2195–2199. doi: 10.1016/j.bmcl.2006.01.040. [DOI] [PubMed] [Google Scholar]
- [33].Motawia MS, Olsen CE, Denyer K, Smith AM, Moller BL. Carbohydr. Res. 2001;330:309–318. doi: 10.1016/s0008-6215(00)00306-2. [DOI] [PubMed] [Google Scholar]
- [34].Bock K, Pedersen C. J. Chem. Soc., Perkin Trans. 2. 1974:293–297. [Google Scholar]
- [35].Prigozy TI, Naidenko O, Qasba P, Elewaut D, Brossay L, Khurana A, Natori T, Koezuka Y, Kulkarni A, Kronenberg M. Science. 2001;291:664–667. doi: 10.1126/science.291.5504.664. [DOI] [PubMed] [Google Scholar]
- [36].Rygaard K, Spang-Thomsen M. Breast Cancer Res. Treat. 1997;46:303–312. doi: 10.1023/a:1005906900231. [DOI] [PubMed] [Google Scholar]


