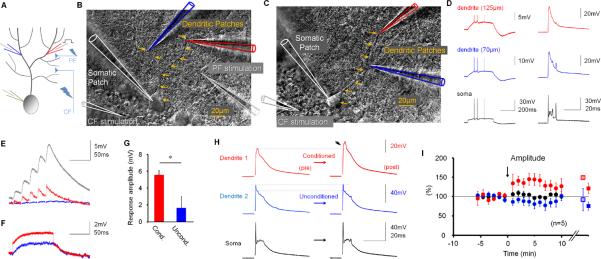
Figure 7.
Triple-patch recordings reveal location-specific dendritic plasticity. (A) Recording configuration. CF responses were recorded in two dendritic locations and the soma before and after either weak PF activation or repeated current injection at one of the dendritic recording sites. (B) DIC image showing how simultaneous recordings are obtained from two different branches (blue and red patch pipettes), and the soma (white). (C) DIC image showing the second configuration, in which recordings were obtained from two sites on the same branch. In (B) and (C), arrows indicate the course of the primary dendrite. (D) Responses to somatic depolarization (left) and CF stimulation (right). These recordings were obtained at two sites on the same branch (70 and 125μm). (E) Example of responses to weak 50Hz PF activation at the conditioned (red trace) and the unconditioned site (blue trace). For comparison, the grey trace on top shows a typical response resulting from strong 50Hz PF activation as used for global excitability changes. (F) Example responses to current injection (+80pA) at one recording site (red trace), but not the other (blue trace). (G) Bar graphs showing response amplitudes monitored at the conditioned and the unconditioned dendritic recording site (n=5). (H) The increase in CF response amplitudes was restricted to the locally conditioned (here: PF tetanization protocol) recording site (red traces), while CF responses recorded at the unconditioned site (blue traces) remained unchanged. (I) Time graph showing changes in CF response amplitudes at the conditioned dendritic site (red dots), the unconditioned site (blue dots) and the soma (black dots; n=5). On the right, the amplitude changes are separately shown for the two stimulus protocols (average: last 5 min; 50Hz PF bursts: closed squares; n=3; depolarization: open squares; n=2). The arrow indicates tetanization. Error bars indicate SEM.

