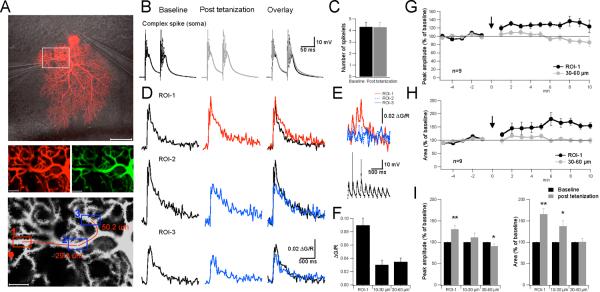
Figure 8.
Confocal calcium imaging shows location-specific dendritic plasticity. (A) Top: Purkinje cell filled with Alexa 633. The lines indicate the location of the somatic patch electrode as well as the glass pipettes that were used for PF (left) and CF stimulation (right). Scale bar: 50μm. Middle: Enlarged view of the area indicated by the white box in the top picture. Left: Red fluorescence of Alexa 633 (30μM). Right: Green fluorescence of Oregon Green BAPTA-2 (200μM). Scale bars: 10μm. Bottom: Image illustrating the location of the stimulus pipette (red dot), and of ROIs 1–3. The red line indicates the dendritic axis along which the distance of ROI-2 and -3 (center of the ROI box) from ROI-1 was determined. Scale bar: 10μm. (B) Complex spikes recorded during the baseline (left) and after tetanization (middle). Right: Overlay of the traces. (C) Weak PF activation did not change the number of spikelets in the complex spike waveform (n=9). (D) CF-evoked calcium transients at ROI-1 (top), ROI-2 (middle) and ROI-3 (bottom) before (left) and after tetanization (middle). Right: Overlay of the traces. (E) Top: Calcium transients monitored during the PF tetanization protocol (first two seconds) at ROIs 1–3. Bottom: Somatic response to PF tetanization. Stimulus artifacts and antidromic spikes were suppressed. (F) Bar graphs indicate calcium transients evoked during PF tetanization at ROI-1 (≤ 10μm distance from stimulus pipette), ROI 2 (10–30μm distance from ROI-1) and ROI-3 (30–60μm distance from ROI-1). Calcium transients were recorded during tetanization in 3/9 cells. (G) Time graph showing changes in the peak amplitude of CF-evoked calcium transients after PF tetanization at ROI-1 and at ROIs located at a distance of 30–60μm from ROI-1 (n=9). (H) Time graph showing corresponding changes in the area under the curve of CF-evoked calcium transients (n=9). (I) Left: Bar graphs summarizing peak amplitude changes at ROI-1 as well as ROIs located at 10–30μm and 30–60μm distance from ROI-1, respectively (n=9). Right: Corresponding changes in the area under the curve (n=9). Error bars indicate SEM. Asterisks indicate significant difference from baseline (paired Student's t-test). * p<0.05 and ** p<0.01.

