

Abstract
Mantle cell lymphoma (MCL) is a subtype of B-cell Non-Hodgkin's Lymphoma (NHL) and accounts for approximately 6% of all lymphomas. Unlike small lymphocytic lymphoma and chronic lymphocytic lymphoma, which are relatively sensitive to chemotherapy, MCL is highly refractory to most chemotherapy, and has the worst survival rate among NHL patients. Stem-like cells in MCL, which we have termed mantle cell lymphoma-initiating cells (MCL-ICs), enriched in the population that are lack of prototypic B-cell marker CD19. These cells were able to self-renew upon serial transplantation and are highly tumorigenic. Importantly, these stem-like cells confer chemotherapeutic resistance to MCL. In this report, we show that stem-like MCL-ICs are resistant to bortezomib, as well as chemotherapeutic regimens containing bortezomib, despite constitutive nuclear factor-κB (NF-κB) expression. Interestingly, bortezomib treatment induced MCL-IC differentiation in plasma-like cells with upregulated expression of CD38 and CD138. This process was accompanied by expression of plasma cell differentiation transcriptional factors, BLIMP-1 and IRF4. This article is the first to show that stem-like MCL cells utilize constitutive NF-κB expression for survival. Given that the NF-κB expression in MCL-ICs is resistant to bortezomib, it will be important to find alternative therapeutic strategies to inhibit NF-κB expression.
Mantle cell lymphoma (MCL) is a subtype of Non-Hodgkin's Lymphoma (NHL), the sixth most common type of human cancer in the United States [1,2]. MCLs display widespread cellular heterogeneity and are extremely resistant to standard radiation and chemotherapeutic interventions. As a result, the median survival time for patients with malignant MCL is less than 3 years, and these patients display the worst survival rate among NHLs [2,3].
We have prospectively isolated stem-like cells in human MCL patients [4]. We found that CD45+CD3−CD34−CD19− MCL cells, which we have termed MCL-initiating cells (MCL-ICs), are highly tumorigenic and display self-renewal capacities in vivo. In contrast, the majority of the tumor population, CD45+CD19+ MCL cells, demonstrate reduced tumorigenicity with no self-renewal activities in vivo [4].
Moreover, CD45+CD19− MCL-ICs confer drug-resistant properties to MCL; CD45+CD19− MCL-ICs were highly resistant in vitro to various chemotherapeutic agents that are currently used in the clinic [5]. The IC50 of chemotherapeutic drugs that effectively suppresses the growth of CD45+CD19− MCL-ICs was 2 to 3.5 times higher than that of CD45+CD19+ MCL cells [5].
Nuclear factor κB (NF-κB) is a well-known transcriptional factor involved in various cellular responses, including immune and inflammatory reaction, apoptosis, cell cycle, and oncogenesis [6–8]. Various studies have identified a link between NF-κB and malignancies, and inhibition of NF-κB activation has been proposed as a potent therapeutic target [6,9–11]. Expression of NF-κB components was reported in MCL cell lines and primary MCL cells; however, therapies targeting NF-κB, such as bortezomib, showed only minimal effects on refractory MCL [12–14]. Bortezomib (Velcade; Millennium Pharmaceuticals Inc, Boston, MA, USA) is a drug that targets the 26S proteasome and supposedly inhibits proteasomal degradation of ubiquitinated NF-κB inhibitor. Given that CD45+CD19− MCL-ICs are highly resistant to several chemotherapeutic drugs, it is important to investigate the therapeutic effects of bortezomib in MCL-ICs.
In the present study, we demonstrate that CD45+CD19− MCL-ICs are highly resistant to bortezomib, and bortezomib resistance in MCL is determined by MCL-ICs. CD45+CD19− MCL-ICs also express high levels of NF-κB, but this NF-κB expression was bortezomib-resistant. The combination of bortezomib and conventional combined chemotherapeutic regimens were less effective at targeting CD45+CD19− MCL-ICs, but were effective in suppressing the growth of CD45+CD19+ bulk MCL cells. When CD45+CD19− MCL-ICs were treated in vitro with bortezomib, cells started to differentiate to plasma-like cells with upregulated expression of CD138 and CD38. This process is accompanied by expression of BLIMP-1 and IRF4.
Collectively, our study demonstrates that the degree of bortezomib resistance in MCL is determined by CD45+CD19− MCL-ICs, which are expressing bortezomib-resistant NF-κB. These stem-like MCL-ICs differentiate into plasma-like cells upon bortezomib treatment, indicating that these plasma-like cells can arise from stem-like cells. Understanding how these processes are molecularly coordinated will be the key to resolving the bortezomib resistance of MCL.
Materials and methods
Patient samples and cell lines
Blood specimens from MCL patients were obtained after informed consent, as approved by MD Anderson Cancer Center and the University of Texas-Health Science Center Institutional Review Boards. All primary patient peripheral blood mononuclear cells were isolated from apheresis blood by standard Ficoll gradient methods. All patient samples were diagnosed with MCL at the time of collection based on t(11;14) translocation, cyclin D1 reactivity, and were in the leukemic phase at the time of apheresis. The patients were previously treated, although the course of therapy differed somewhat between patients. Two well-characterized Epstein-Barr virus–negative human MCL cell lines, Jeko-1 and REC-1, were obtained from American Type Culture Collection (Manassas, VA, USA).
Cell preparation and culture
CD34+ hematopoietic stem cells and CD3+ T cells were removed from peripheral blood mononuclear cell samples prior to all analyses using lineage-specific purified antibodies (CD3, 1:500 dilutions; and CD34, 1:1000 dilutions) and magnetic beads, according to manufacturer's protocol (Dynal beads methods). These CD3- and CD34-depleted cells were separated using CD19 lineage-specific antibodies (Biolegend, San Diego, CA, USA) and Dynabeads (Invitrogen, Oslo, Norway). Purity of separated tumor cells (CD45+CD3−CD34−CD19+ and CD45+CD3−CD34−CD19− cells) was confirmed to be >95% by flow cytometric analysis. The primary MCL cells were cultured in complete RPMI 1640 (Cellgro, Manassas, VA, USA) media, which contained 10% heat-inactivated fetal bovine serum, 2 mM glutamine, 100 μg/mL streptomycin, and 100 μg/mL penicillin. Jeko-1 was cultured in the same RPMI 1640 medium as stated here, and RPMI 1640 (American Type Culture Collection) medium, which contained 10% heat-inactivated fetal bovine serum, 100 μg/mL streptomycin, and 100 μg/mL penicillin, was used for REC-1.
Reagents
The following commercially available antibodies were used: anti-CD45 (HI30, IgG1, κ), anti-CD19 (HIB19, IgG1, κ), anti-CD3 (HIT3a, IgG2a, κ), anti-CD34 (581, IgG1, κ), anti-CD138 (MI15, IgG1, κ), anti-CD38 (HIT2, IgG1, κ), anti-p50 (H-119), anti-p65 (C-20), etc. All antibodies were purified or conjugated with appropriate fluorochromes based on the combinations of antibodies used in each experiment. Antibodies were purchased from BD, BioLegend, or eBioscience (San Diego, CA, USA). All chemotherapeutic drugs were obtained from the pharmacy at MD Anderson Cancer Center. We used the drug concentrations that were determined in our previous article [5], which was based on our preliminary data using MCL tumor samples as well as the concentrations reported in various studies on human hematological malignancies.
Enzyme-linked immunosorbent assay
To prepare nuclear extracts, 1 × 10⁶ cells were washed with cold phosphate-buffered saline/phosphatase inhibitors, and harvested with 100 μL 1× hypotonic buffer on ice. Nuclei were separated by centrifugation and resuspended in 10 μL Complete Lysis Buffer. After 30 minutes of incubation on ice, nuclear lysates were collected by high-speed centrifugation. The buffers were purchased from Active Motif (Carlsbad, CA, USA), and all steps were performed according to manufacturer's instructions. Five micrograms of nuclear extracts were used to assay for the NF-κB p50, p65, p52, c-Rel, and RelB DNA-binding activity using enzyme-linked immunosorbent assay (ELISA), according to the protocol of Active Motif TransAM NFκB Family Kit. Briefly, NF-κB oligonucleotide (5′-GGGACTTTCC-3′)-coated 96-well plate was incubated with nuclear extracts as indicated here. Horseradish peroxidase–conjugated secondary antibodies provide a colorimetric readout that is quantified by spectrophotometry equipped with SoftMax Pro software (Molecular Devices, Sunnyvale, CA, USA).
Immunoblot analysis
Nuclear extracts, which were obtained as described here, were solubilized with 25 mM Tris, 192 mM glycerine, and 0.1% sodium dodecyl sulfate buffer (Bio-Rad, Hercules, CA, USA) and electro-phoresed on a 10% Tris-Glycine gel (NuSep, Bogart, GA, USA). Proteins were transferred onto nitrocellulose membrane and probed with various specific primary antibodies and then the appropriate enhanced chemiluminescence-labeled secondary antibodies. Proteins were visualized by enhanced chemiluminescence (Thermo, Rockford, IL, USA).
Rhodamine 123 staining
CD3+ (T cells) and CD34+ (hematopoietic stem cells) were removed from primary patient samples. These cells were suspended at 10 cells/50 μL Hank's balanced salt solution containing 5% fetal bovine serum. Rhodamine 123 dye (Invitrogen) was added to a final concentration of 0.1 μg/mL. Cells were incubated for 20 minutes at 37°C, followed by washing cells twice with Hank's balanced salt solution. Cells were resuspended to allow efflux at 37°C for 2 hours. Cells were washed once with Hank's balanced salt solution and stained with antibodies before fluorescence-activated cell sorting analyses.
Fluorimetric cytotoxicity assay
Cytotoxicity was assessed with fluorimetric cell viability assay using CellTiter-Blue (Promega, Madison, WI, USA). Briefly, cells were incubated for the incubated times at 37°C with determined doses of drugs. After washing treated cells, CellTiter-Blue reagents (20 μL) were added to suspended cells with new complete RPMI 1640 media (80 μL) and these were incubated in 96-well plates for 4 hours at 37°C. The fluorescent signal was measured at 560Ex/590Em using a fluorescence plate reader equipped with SoftMax Pro software (Molecular Devices), and the level of fluorescent resorufin was calculated. Dose-response curves were calculated based on the cell viability assay of cells treated with each chemotherapeutic drug. Cell viability was assessed based on the value of the fluorescent signal of live cells with no drug treatments. Viabilities of drug-treated cells were calculated based on a ratio of the fluorescent signal using the following equation:
In this equation, Vmax is the full range of cell viability, i.e., 100%; Sα is the value of the fluorescent signal of live cells at α of drug concentration; and S0 represents the value of fluorescent signal of live cells with no treatments. All assays were performed in triplicate, and data are expressed as mean values ± standard deviation.
IC50
IC50 value (the concentration of a drug that is required for 50% inhibition in vitro) was used to indicate the quantitative measure of the different cell-killing effects of drugs. The Hill-Slope logistic model is used to calculate IC50 using CompuSyn software (ComboSyn, Paramus, NJ, USA).
Drug combination assay
The synergic cytotoxic effects of bortezomib and conventional combination chemotherapeutic regimens were determined by combination index (CI) method based on Chou and Talalay equation [15], and analyzed by the CompuSyn software (ComboSyn). Briefly, the CI equation is a quantitative measure of the degree of drug interaction in terms of synergism and antagonism of a given endpoint of the effect measurement [16], and the following median-effect equation [fa/fu = (D/Dm)m; a general equation for dose-effect relationship that takes into account both the potency (Dm) and shape (m) of dose-effect curve, where fa and fu are the fractions affected and unaffected, respectively [17], is the basis of the following CI equation:
In this equation, n is the number of combined drugs; (Dx)i is the dose of drug i alone that inhibits x%; and (D)i is the portion of drug i in drug combination that also inhibits x%. Synergy is present when the CI is <1.0, additive effect is when CI = 1.0, and antagonism is when CI >1.0.
Flow cytometry
CD3+, CD34+, and CD19+ cells were deleted using magnetic beads selection method as mentioned here. After culture with or without bortezomib, CD3−CD34−CD19− MCL-ICs were stained by fluorescein isothiocyanate-labeled anti-CD138 (BD Pharmingen, San Diego, CA, USA) and phycoerythrin-Cy7–labeled anti-CD38 (eBioscience), and then analyzed using fluorescence-activated cell sorting LSRII flow cytometer(BDBiosciences,NJ, USA). All assays were performed in duplicate.
Quantitative reverse transcription polymerase chain reaction (RT-PCR)
Messenger RNA samples were subjected to RNase-free DNase treatment performed according to RNeasy Mini Kit (QIAGEN, German-town, MD, USA) and reverse-transcribed to complementary DNA using SuperScript III First-Strand Synthesis System (Invitrogen, Carlsbad, CA, USA), as per manufacturer's instructions. The following primers were designed using PrimerExpress software (Applied Biosystems, Carlsbad, CA, USA): interleukin (IL)-6 sense 5′ CCCAGGGAGAAGGCAACT 3′, IL-6 antisense 5′ CCAGG AGCCCAGCTATGAAC 3′, IL-8 sense 5′ AGAGCCACGGCCA GCTT 3′, IL-8 antisense 5′ GGAAGAAACCACCGGAAGGA 3′, cellular inhibitor of apoptosis protein 2 (c-IAP2) sense 5′ GCTTCTGTTGTGGCCTG 3′, c-IAP2 antisense 5′ CACCTTGG AAACCAC 3′, BLIMP-1 sense 5′ GGCATTCATGTGGCTTTTCT 3′, BLIMP-1 antisense 5′ AGATGACCGGCTACAAGACC 3′, IRF4 sense 5′ GGGTCTGGAAACTCCTCTCC 3′, IRF4 antisense 5′ GCCAGAGCAGGATCTACTGG 3′. Quantitative RT-PCRs were performed using RT SYBR Green/ROX qPCR Master Mix (SABiosciences, Foster City, CA, USA) according to manufacturer's instructions. Human β-actin or glyceraldehyde-3-phosphate dehydrogenase genes were used as internal controls. All samples were run in duplicate using ABI 7900HT Fast Real-Time PCR System equipped with SDS Software v2.3 software (Applied Biosystems), and data were analyzed using the comparative Ct method (ΔΔCt).
Statistical analysis
All assays were performed in duplicate ortriplicate, and data are expressed as mean values ± standard deviation. Statistical analyses were performed using IBM SPSS for Windows software, version 12.0 (IBM Corp., Armonk, NY, USA). Statistical significance of differences between the cell groups was evaluated by Student's t-test. p Values < 0.05 were considered statistically significant.
Results
NF-κB is constitutively expressed in MCL-ICs
NF-κB is a family of transcription factors that plays a central role in activation and survival of normal immune cells [18]. NF-κB also plays a role in malignant cell development and differentiation by regulating the cell cycle and protecting cells from apoptosis [6–8].
Because MCL-ICs do not express CD19, which is a coreceptor for B-cell proliferation and differentiation, we hypothesized that MCL-ICs must have alternative survival mechanisms. Hodgkin's Lymphoma cells, which do not express the B-cell receptor, use constitutive NF-κB activation for maintenance of survival [19]. Therefore, we investigated whether NF-κB components are present in MCL-ICs. We first isolated CD45+CD19− MCL-ICs from several MCL patient samples after depletion of hematopoietic stem cells and T cells as described previously [4].
CD45+CD19− MCL-ICs showed high expression of two NF-κB components, p50 and p65, which were detected by immunoblot analyses (Fig. 1A). We further analyzed the DNA-binding activities of NF-κB transcription factors using nuclear extracts of each cell type by an ELISA-based assay. This ELISA-based assay is an alternative way to measure NF-κB binding instead of a radioactivity-based assay, such as electrophoretic mobility shift assay [20]. In CD45+CD19− MCL-ICs, NF-κB p50 and p65 DNA-binding activities were consistently higher compared to the normal B cells, and the activity levels also are comparable to positive control (Fig. 1B). However, the other components of NF-κB, p52, c-Rel, and RelB were not readily detected by Western blots or ELISA assays (data not shown). Together these results demonstrate that NF-κB activity is constitutively upregulated in CD45+CD19− MCL-ICs.
Figure 1.
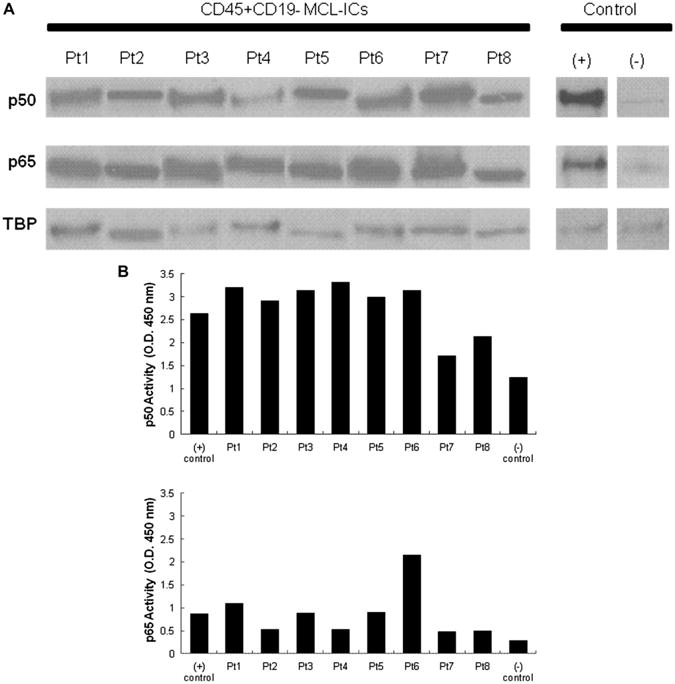
Constitutive upregulation of NF-κB transcription factor components in CD45+CD19− MCL-ICs. (A) Nuclear extracts of CD45+CD19− MCL-ICs from eight different patients without any stimulation were analyzed for p50 and p65 expression by immunoblots. TATA-binding protein (TBP) was used as control. The Jeko-1 cell line was used as positive control, and normal B cells were used as negative control. MCL-ICs have upregulated NF-κB p50 and p65 expression. (B) Nuclear lysates of CD45+CD19− MCL-ICs from eight different patients were subjected to ELISA assay with p50 and p65 DNA-binding activities. Raji cells with no drug treatments were used as positive controls, and normal blood cells were used as negative control. High levels of p50 and p65 DNA-binding activities are noted in MCL-ICs in all patient samples compared to normal blood cells.
CD45+ CD19− MCL-ICs are resistant to bortezomib compared to CD45+ CD19+ bulk MCL cells
Because CD45+CD19− MCL-ICs express NF-κB, we treated CD45+CD19− MCL-ICs with bortezomib and investigated whether bortezomib can be used as an effective therapy that can target MCL-ICs in vitro. CD45+CD19− MCL-ICs that express NF-κB showed much higher IC50 than that of bortezomib-resistant cell line, REC-1 [21]; however, most CD45+CD19+ bulkMCL cells showed lower IC50 than that of bortezomib-sensitive cell line, Jeko-1 [21] (Fig. 2A). In addition, the IC50 of bortezomib that effectively suppresses the growth of CD45+CD19− MCL-ICs was ∼ 10 times higher than doses that kill CD45+CD19+ MCL cells, and the differences between two cell types were statistically significant (Fig. 2B, Table 1).
Figure 2.
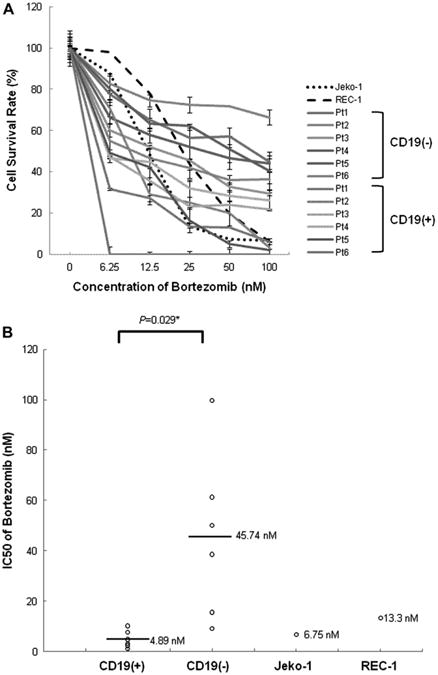
CD45+CD19− MCL-ICs isolated from patient samples are bortezomib-resistant. (A) The bortezomib sensitivities of CD45+CD19− MCL-ICs and CD45+CD19+MCL cells isolated from different six MCL patients were compared with those of REC-1 and Jeko-1 cells. Cells (1.5–2.5 × 10⁵ cells per well) were cultured in 24-well plates for 16 hours after the addition of bortezomib. Cell viability was determined by CellTiter-Blue fluorometric assay (Promega) and was indicated as a ratio compared to cell viability without treatment. Drugs were serially diluted as indicated from maximum drug doses of 100 nM. Results show the mean ± standard deviation of triplicate. CD45+CD19− MCL-ICs showed more survival rates on all tested drug concentrations compared to CD45+CD19+ MCL cells. CD19(−), CD45+CD19− cells; CD19(+), CD45+CD19+ cells. (B) The mean IC50 value of bortezomib for CD45+CD19− MCL-ICs was much higher than those of the CD45+CD19+ MCL cells, Jeko-1, or even REC-1, which was reported as a bortezomib-resistant cell line. CD19(−) = CD45+CD19− cells; CD19(+) = CD45+CD19+ cells. Bars represent averages; *p < 0.05 by unpaired t-test.
Table 1. IC50 values of bortezomib between MCL-ICs and other MCL bulk cells.
| nM | Pt1 | Pt2 | Pt3 | Pt4 | Pt5 | Pt6 | Average |
|---|---|---|---|---|---|---|---|
| CD19(+) | 2.41 | 10.22 | 3.1 | 4.86 | 7.61 | 1.17 | 4.895 |
| CD19(−) | 61.27 | 99.794 | 15.58 | 38.58 | 50.08 | 9.11 | 45.73567 |
CD19(+), CD45+CD19+ MCL cells; CD19(−), CD45+CD19− MCL-ICs. Separated MCL cells were incubated for 15 hours after adding bortezomib. CD45+CD19− MCL-ICs require much higher doses of bortezomib to suppress cell growth compared to CD45+CD19+ MCL cells.
We then tested bortezomib resistance using xenograft tumors from nonobese diabetic/severe combined immune-deficient mice (Supplementary Figure E1A; online only, available at www.exphem.org). Tumors were isolated after injecting bulk MCL cells as shown previously [4]. CD45+CD19− MCL-ICs and CD45+CD19+ cells were isolated and the same concentration of bortezomib was used as shown in Figure 2. Similar to patient samples, CD19− cells from xenograft tumors were bortezomib-resistant compared to CD19+ xenograft tumors. IC50 values of xenograft tumors were also much higher than CD19+ xenograft cells (Supplementary Figure E1B; online only, available at www.exphem.org). Because MCL-ICs were maintained in a quiescent status measured by drug efflux activities using Rhodamine 123 [4], we further tested whether bortezomib treatment affects Rhodamine staining profiles in MCL. CD34+ hematopoietic stem cells and CD3+ T cells were removed from patient samples before Rhodamine 123 staining. After bortezomib treatments, Rhodamine 123 low cells were increased, which indicate that quiescent populations are resistant to bortezomib (Supplementary Figure E2; online only, available at www.exphem.org). As reported for stem-like cells in other cancers, the quiescent properties of MCL-ICs may render them difficult to kill with conventional therapies that target cells with increased mitotic properties. The quiescent cellular properties may also be due to elevated expression of different multidrug-resistant gene products, which likely contribute to the drug-resistant features of stem-like cancer cells [22]. Therefore, this result could also indicate that the population (Rhodamine 123 low) that is enriched for drug transporters is more resistant to bortezomib treatment. Previously, we reported that CD45+CD19+ MCL cells do not have self-renewal properties with decreased tumor-forming activities [4]. Moreover, CD45+CD19+ MCL cells were susceptible to various chemotherapeutic agents compared to CD45+CD19− MCL-ICs [5]. Together, our data demonstrate that CD45+CD19− MCL-ICs are resistant not only to R-CHOP, R-CVAD, R-DHAP, and fludarabine-based regimens, as shown in our previous report, but also to bortezomib.
Levels of NF-κB and its downstream gene expression are unchangeable upon bortezomib treatment
Because CD45+CD19− MCL-ICs are resistant to bortezomib, we investigated NF-κB signaling upon bortezomib treatment. For the ELISA assay, CD45+CD19− MCL-ICs isolated from patient samples were treated with 100 nM bortezomib for 16 hours. Non-treated Raji cells were used as a positive control for the ELISA assay. The levels of p50 expression were not consistently changed between bortezomib-treated and untreated samples; moreover, the levels of p65 expression were increased after bortezomib treatment (Fig. 3A).
Figure 3.
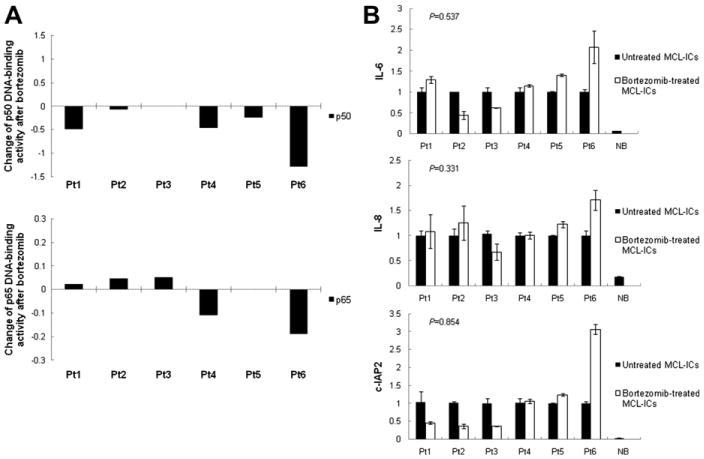
Bortezomib does not suppress constitutive NF-κB activities of CD45+CD19− MCL-ICs. (A) CD45+CD19− MCL-ICs isolated from different six patients were cultured with or without 100 nM bortezomib for 16 hours, and nuclear extracts were subjected to ELISA assay for p50 and p65 DNA-binding activity. Raji cells with no drug treatments were used as positive controls, and normal blood cells were used as negative control. The changes of NF-κB DNA-binding activities in MCL-ICs by bortezomib were inconsistent through all tested samples. No = untreated CD45+CD19− cells; BTZ = bortezomib-treated CD45+CD19− cells. (B) CD45+CD19− primary MCL-ICs were cultured with or without 100 nM bortezomib for 16 hours. mRNA was then isolated and complementary DNA (cDNA) was prepared for real-time-PCR. The cDNA were analyzed for the genes involved in NF-κB-linked transcriptional targets. β-actin was used as controls. Bortezomib induced no generalized suppression of the expression of NF-κB target genes, IL-6, IL-8, and c-IAP2, in MCL-ICs. BTZ = bortezomib-treated CD45+CD19− cells; NB = normal blood cells; No = untreated CD45+CD19− cells. Columns are mean of duplicates, and bars represent standard deviation. p Values were calculated using unpaired t-test.
To further verify the effects of bortezomib on NF-κB activity and signaling cascades, we performed RT-PCR analysis of IL-6, IL-8, and c-IAP2, which are well-known NF-κB–linked transcriptional targets. NF-κB suppresses tumor necrosis factor-α-mediated apoptosis in addition to tumor necrosis factor receptor–associated factors and inhibitor of apoptosis proteins, such as c-IAP1 and c-IAP2 [23]. In addition, NF-κB complexes regulate the gene expression of IL-6 and IL-8, which are representative inflammatory cytokines [24,25]. Figure 3B demonstrates RT-PCR analysis for these NF-κB–regulated genes in CD45+CD19− MCL-ICs treated with bortezomib. β-actin gene expression was monitored as a loading control. The NF-κB–downstream target genes were readily detectable in untreated CD45+CD19− MCL-ICs. However, no significant downregulation of target genes was detected in the presence of the bortezomib (Fig. 3B).
CD45+CD19− MCL-ICs are resistant to bortezomib-combined chemotherapeutic regimens in vitro
Because bortezomib is approved by the US Food and Drug Administration as the only treatment for patients with relapsed or refractory MCL, and various clinical studies investigating the combination of bortezomib with other agents are ongoing [26], we investigated whether CD45+CD19− MCL-ICs are also resistant to bortezomib-contained chemotherapeutic regimens.
CD45+CD19− MCL-ICs and CD45+CD19+ MCL cells isolated from three different patient samples were treated for 6 hours with the combined regimens of bortezomib with CVAD or fludarabine + cyclophosphamide (FC). Drugs were serially diluted with the following maximal drug doses: B+CVAD (bortezomib, 100 nM; cyclophosphamide monohydrate, 320 μg/mL; vincristine, 2 μg/mL; doxorubicin, 2 μg/mL; dexamethasone, 10 μg/mL), B+FC (bortezomib, 100 nM; fludarabine, 320 μg/mL; cyclophosphamide monohydrate, 320 μg/mL). Cell viability was then measured using a fluorometric assay, and the percentage of cell survival was calculated by the ratio between cells treated with drugs and untreated cells.
Compared to CD45+CD19+ MCL cells, CD45+CD19− MCL-ICs from all tested patients demonstrated resistance not only to conventional chemotherapies, such as CVAD or fludarabine-based regimens, but also the bortezomib-combined regimens (p < 0.05) (Fig. 4A).
Figure 4.
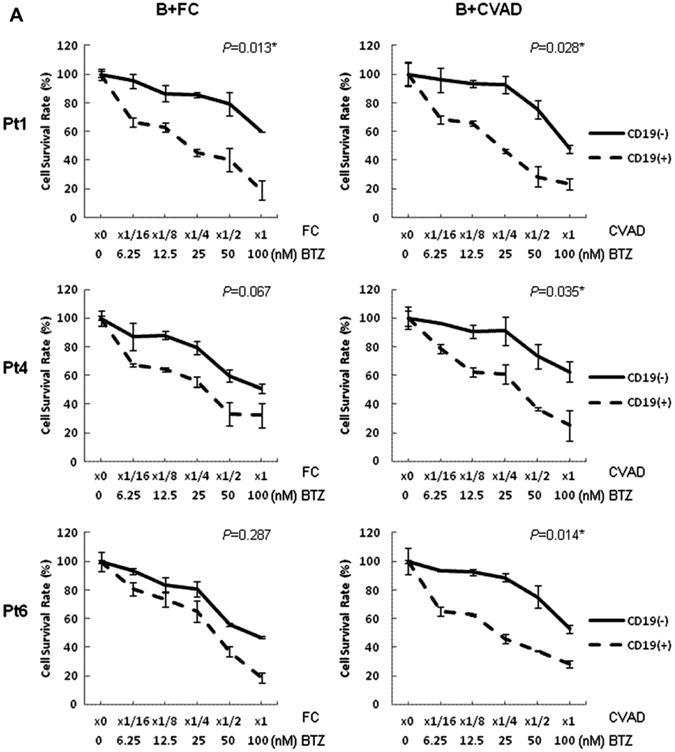
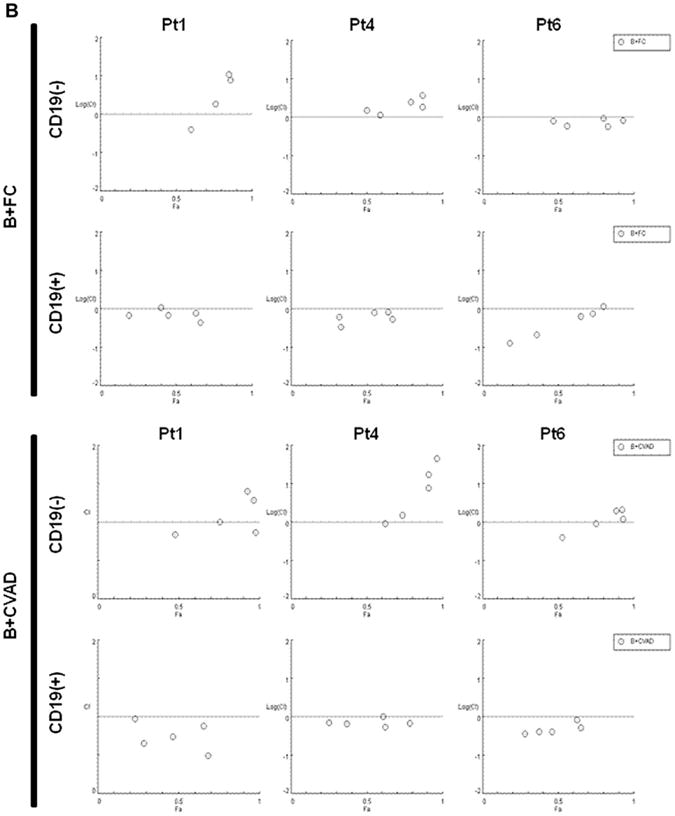
CD45+CD19− MCL-ICs are more resistant to different bortezomib-contained chemotherapeutic regimens than CD45+CD19+ bulk MCL cells. CD45+CD19− cells and CD45+CD19+ cells isolated from three different MCL patient samples were cultured in 24-well plates for 6 hours after the addition of each drug. Cell viability was determined by CellTiter-Blue fluorometric assay (Promega) and was indicated as a ratio compared to cell viability without treatment. Drugs were serially diluted as indicated from maximum drug doses: B+CVAD (BTZ, 100 nM; CTX, 320 μg/mL; VCR, 2 μg/mL; DOX, 2 μg/mL; Dexa, 10 μg/mL), B+FC (BTZ, 100 nM; Flu, 320 μg/mL; CTX, 320 μg/mL). CD19(−), CD45+CD19− cells; CD19(+), CD45+CD19+ cells. BTZ = bortezomib; CTX = cyclophosphamide monohydrate; Dexa = dexamethasone; DOX = doxorubicin; Flu = Fludarabine; VCR = vincristine. (A) CD45+CD19− MCL-ICs showed higher survival rates than CD45+CD19+ bulk MCL cells in all tested bortezomib-containing combination chemotherapeutic regimens. The results show the mean ± standard deviation of triplicate. *p < 0.05; p values were calculated using Student's t-test. (B) Bortezomib synergized with conventional combined chemotherapeutic regimens in inducing cytotoxicity in CD45+CD19+ bulk MCL cells, but not CD45+CD19− MCL-ICs. CI plots generated by the CompuSyn software (ComboSyn, NJ, USA) according to the Chou-Talalay method. Synergy is present when CI < 1.0 or log (CI) <0.
The synergistic cytotoxic effects of bortezomib and conventional combined anti-MCL regimens were analyzed by CI plots, based on the Chou and Talalay method. When CD45+19− MCL cells were treated with bortezomib-containing regimens, i.e., B+FC and B+CVAD, the CI values were mainly > 1.0, suggesting not only a lack of synergy, but even antagonism (Fig. 4B). In contrast, the CI values in CD45+CD19+MCL cells were mainly < 1.0, indicating synergistic cytotoxicity of the combination of bortezomib and conventional chemotherapeutic regimens (Fig. 4B).
These findings indicate that CD45+CD19− MCL-ICs are not susceptible to bortezomib-combined chemotherapeutic regimens or bortezomib itself.
MCL-ICs express plasma cell markers upon bortezomib treatment
A recent study reported that bortezomib-resistant MCL cells differentiate into plasma-like cells [27]. These plasma-like cells have upregulated expression of CD138 and CD38 and concomitantly downregulated CD19. Because these cells share phenotypic similarity with MCL-ICs in terms of CD19 expression, we investigated whether CD45+CD19− MCL-ICs upregulate these markers upon bortezomib treatment. CD45+CD19− MCL-ICs were treated with bortezomib (100 nM) for 4 hours or overnight (16 hours), followed by flow cytometric analysis.
A distinct population that expresses CD38 and CD138 appeared upon bortezomib treatment (Fig. 5A). Only live cells were gated for flow cytometric analysis. However, most primary MCL cells started to die spontaneously after 24 hours culture in vitro, and we could not test the effects of bortezomib beyond 17 to 24 hours. These populations upregulate transcription factors that determine plasmacytic differentiation, such as IRF4 and BLIMP-1, by RT-PCR (Fig. 5B).
Figure 5.
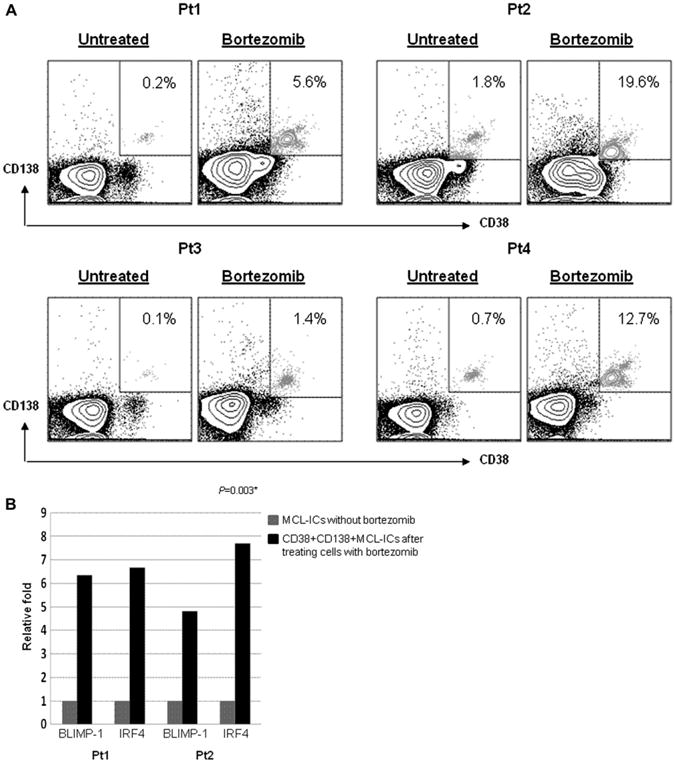
Plasmacytic differentiation is associated with bortezomib resistance in CD45+CD19− MCL-ICs. (A) Representative flow cytometric profiles show CD138− and CD38− stained CD45+CD19− primary MCL-ICs after incubation with or without 100 nM bortezomib. The relative percentages of CD138- and CD38-positive fractions are indicated as boxes. The proportion of CD138- and CD38-positive cells was increased more than 10 times after 16-hour bortezomib treatment. (B) CD45+CD19− MCL-ICs isolated from MCL patient samples were incubated with or without 100 nM bortezomib for 16 hours. Messenger RNA was then isolated and complementary DNA (cDNA) was prepared for real-time PCR. The cDNA were analyzed for the genes to determine plasmacytic differentiation by real-time PCR. Glyceraldehyde-3-phosphate dehydrogenase was used as controls. Treatment with bortezomib induced expression of BLIMP-1 and IRF4, which were representative transcription factors of plasmacytic differentiation. *p < 0.05; p values were calculated using Student's t-test.
Discussion
Basic cancer research has focused on identifying the genetic changes that lead to cancer initiation and progression, which has led to major advances in the understanding of the pathways involved in malignant transformation. Most tumors are heterogeneous mixtures of cells with varying degrees of tumorigenicity. In an attempt to identify specific cancer cells that initiate and sustain cancer growth, the principles of stem cell biology were applied to better understand how tumors develop. In fact, leukemia [28,29], as well as solid tumors such as brain, breast, and colon, harbor subpopulations of tumor cells that are highly proliferative and can contribute to tumor progression and malignancy [30–33].
These multipotent cancer-initiating cells, or “cancer stem cells,” contribute to tumorigenesis. These cells have the unique ability to proliferate and self-renew extensively. In addition, cancer stem cells have been shown to be resistant to conventional chemotherapy and radiotherapy, indicating that these resistant cells may be responsible for relapse of the diseases [34–36].
In this report, we show that stem-like MCL cells express constitutively upregulated NF-κB signaling. Constitutive activation of NF-κB has been demonstrated in a variety of hematological malignancies, including T-cell leukemia [37], multiple myeloma [38], and MCL [9]. However, all of these studies utilized cell lines that had been maintained in culture for many years, complicating the interpretation of these results and their relevance to stem-like cells. The NF-κB expression in stem-like MCL cells was highly resistant to bortezomib when it was compared to bulk CD19+ populations and bortezomib-resistant cell lines such as REC-1. The stem-like MCL cells were also resistant to bortezomib-combined chemotherapeutic regimens in vitro.
A recent study reported that bortezomib-resistant MCL cells differentiate into plasma-like cells with upregulated expression of CD138 and CD38 [27]. These populations concomitantly downregulated CD19 expression. Here, we show that a CD138+CD38+CD45+CD19− bortezomib-resistant population can arise from stem-like cells in MCL upon bortezomib treatment. However, the plasma-like cells still represent relatively minor populations (∼20%), even after bortezomib treatment. It would be important to demonstrate in the future the molecular and cellular differences between CD45+CD19−CD138+ and CD45+CD19−CD138− populations in response to bortezomib. It will also be interesting to test whether these populations can reconstitute the MCL population in immune-compromised mice models.
Supplementary Material
Supplementary Figure E1. CD45+CD19−MCL-ICs isolated from xenograft tumors are bortezomib-resistant. (A) Bortezomib sensitivities of CD45+CD19− MCL-ICs and CD45+ CD19+MCL cells isolated from xenograft tumors were compared. The xenograft tumors were generated as described previously (passage 1) after injecting MCL cells [4].The xenograft tumor cells were first positively isolated using human CD45+ Miltenyi beads followed by separation of CD19+ and CD19− cells. Cells (1.5–2.5 × 10⁵ cells per well) were cultured in 24-well plates for 16 hours after the addition of bortezomib. Cell viability was determined by Cell Titer-Blue fluorometric assay and was indicated as a ratio compared to cell viability without treatment. Drugs were serially diluted as indicated from maximum drug doses of 100 nM. The results show the mean ± standard deviation of triplicate. CD45+CD19−MCL-ICs showed higher survival rates on tested drug concentrations compared to CD45+CD19+ MCL cells. CD19(−), CD45+CD19− cells; CD19(+), CD45+CD19+ cells. (B) The mean IC50 value of bortezomib for CD45+CD19− MCL-ICs that were isolated from xenograft tumors was much higher than those of the CD45+CD19+ MCL cells. CD19(−),CD45+CD19− cells; CD19(+),CD45+CD19+ cells. Bars represent averages. *p < 0.05 by unpaired t-test.
Supplementary Figure E2. Increased amounts of Rhodamine 123 low cells in MCL-ICs upon bortezomib treatment. CD45+CD19−MCL-ICs were isolated from three different patients and were treated with 100 nM bortezomib for 24 hours. CD34+ and CD3+ cells were depleted from the patient samples before isolation. Rhodamine 123 staining was then performed as indicated in Materials and Methods.
Acknowledgments
The tissue samples were provided by the University of Texas MD Anderson Cancer Center Satellite Lymphoma Tissue Bank, which was supported by Institutional Core Grant # NCI/NIH - CA16672. This work is funded by CONquer canCER Now award (CONCERN Foundation) and National Cancer Institute/National Institutes of Health grant given to N.M.
Footnotes
Supplementary data related to this article can be found online at doi: 10.1016/j.exphem.2011.10.004.
Conflict of interest disclosure: No financial interest/relationships with financial interest relating to the topic of this article have been declared.
References
- 1.Mounter PJ, Lennard AL. Management of non-Hodgkin's lymphomas. Postgrad Med J. 1999;75:2–6. doi: 10.1136/pgmj.75.879.2. [DOI] [PMC free article] [PubMed] [Google Scholar]
- 2.Salaverria I, Perez-Galan P, Colomer D, Campo E. Mantle cell lymphoma: from pathology and molecular pathogenesis to new therapeutic perspectives. Haematologica. 2006;91:11–16. [PubMed] [Google Scholar]
- 3.Pileri SA, Falini B. Mantle cell lymphoma. Haematologica. 2009;94:1488–1492. doi: 10.3324/haematol.2009.013359. [DOI] [PMC free article] [PubMed] [Google Scholar]
- 4.Chen Z, Ayala P, Wang M, et al. Prospective isolation of clonogenic mantle cell lymphoma-initiating cells. Stem Cell Res. 2010;5:212–225. doi: 10.1016/j.scr.2010.07.003. [DOI] [PMC free article] [PubMed] [Google Scholar]
- 5.Jung HJ, Chen Z, McCarty N. Stem-like tumor cells confer drug resistant properties to mantle cell lymphoma. Leuk Lymphoma. 2011;52:1066–1079. doi: 10.3109/10428194.2011.562570. [DOI] [PubMed] [Google Scholar]
- 6.Baldwin AS. Control of oncogenesis and cancer therapy resistance by the transcription factor NF-kappaB. J Clin Invest. 2001;107:241–246. doi: 10.1172/JCI11991. [DOI] [PMC free article] [PubMed] [Google Scholar]
- 7.Murray RZ, Norbury C. Proteasome inhibitors as anti-cancer agents. Anticancer Drugs. 2000;11:407–417. doi: 10.1097/00001813-200007000-00001. [DOI] [PubMed] [Google Scholar]
- 8.Packham G. The role of NF-kappaB in lymphoid malignancies. Br J Haematol. 2008;143:3–15. doi: 10.1111/j.1365-2141.2008.07284.x. [DOI] [PubMed] [Google Scholar]
- 9.Pham LV, Tamayo AT, Yoshimura LC, Lo P, Ford RJ. Inhibition of constitutive NF-kappa B activation in mantle cell lymphoma B cells leads to induction of cell cycle arrest and apoptosis. J Immunol. 2003;171:88–95. doi: 10.4049/jimmunol.171.1.88. [DOI] [PubMed] [Google Scholar]
- 10.Naugler WE, Karin M. NF-kappaB and cancer-identifying targets and mechanisms. Curr Opin Genet Dev. 2008;18:19–26. doi: 10.1016/j.gde.2008.01.020. [DOI] [PMC free article] [PubMed] [Google Scholar]
- 11.Guzman ML, Neering SJ, Upchurch D, et al. Nuclear factor-kappaB is constitutively activated in primitive human acute myelogenous leukemia cells. Blood. 2001;98:2301–2307. doi: 10.1182/blood.v98.8.2301. [DOI] [PubMed] [Google Scholar]
- 12.Yang DT, Young KH, Kahl BS, Markovina S, Miyamoto S. Prevalence of bortezomib-resistant constitutive NF-kappaB activity in mantle cell lymphoma. Mol Cancer. 2008;7:40. doi: 10.1186/1476-4598-7-40. [DOI] [PMC free article] [PubMed] [Google Scholar]
- 13.O'Connor OA, Wright J, Moskowitz C, et al. Phase II clinical experience with the novel proteasome inhibitor bortezomib in patients with indolent non-Hodgkin's lymphoma and mantle cell lymphoma. J Clin Oncol. 2005;23:676–684. doi: 10.1200/JCO.2005.02.050. [DOI] [PubMed] [Google Scholar]
- 14.Goy A, Younes A, McLaughlin P, et al. Phase II study of proteasome inhibitor bortezomib in relapsed or refractory B-cell non-Hodgkin's lymphoma. J Clin Oncol. 2005;23:667–675. doi: 10.1200/JCO.2005.03.108. [DOI] [PubMed] [Google Scholar]
- 15.Chou TC, Talalay P. Quantitative analysis of dose-effect relationships: the combined effects of multiple drugs or enzyme inhibitors. Adv Enzyme Regul. 1984;22:27–55. doi: 10.1016/0065-2571(84)90007-4. [DOI] [PubMed] [Google Scholar]
- 16.Chou TC, Talalay P. Generalized equations for the analysis of inhibitions of Michaelis-Menten and higher-order kinetic systems with two or more mutually exclusive and nonexclusive inhibitors. Eur J Biochem. 1981;115:207–216. doi: 10.1111/j.1432-1033.1981.tb06218.x. [DOI] [PubMed] [Google Scholar]
- 17.Chou TC. Derivation and properties of Michaelis-Menten type and Hill type equations for reference ligands. J Theor Biol. 1976;59:253–276. doi: 10.1016/0022-5193(76)90169-7. [DOI] [PubMed] [Google Scholar]
- 18.Joyce D, Albanese C, Steer J, Fu M, Bouzahzah B, Pestell RG. NF-kappaB and cell-cycle regulation: the cyclin connection. Cytokine Growth Factor Rev. 2001;12:73–90. doi: 10.1016/s1359-6101(00)00018-6. [DOI] [PubMed] [Google Scholar]
- 19.Bargou RC, Emmerich F, Krappmann D, et al. Constitutive nuclear factor-kappaB-RelA activation is required for proliferation and survival of Hodgkin's disease tumor cells. J Clin Invest. 1997;100:2961–2969. doi: 10.1172/JCI119849. [DOI] [PMC free article] [PubMed] [Google Scholar]
- 20.Renard P, Ernest I, Houbion A, et al. Development of a sensitive multi-well colorimetric assay for active NFkappaB. Nucleic Acids Res. 2001;29:E21. doi: 10.1093/nar/29.4.e21. [DOI] [PMC free article] [PubMed] [Google Scholar]
- 21.Rizzatti EG, Mora-Jensen H, Weniger MA, et al. Noxa mediates bortezomib induced apoptosis in both sensitive and intrinsically resistant mantle cell lymphoma cells and this effect is independent of constitutive activity of the AKT and NF-kappaB pathways. Leuk Lymphoma. 2008;49:798–808. doi: 10.1080/10428190801910912. [DOI] [PubMed] [Google Scholar]
- 22.Dean M, Rzhetsky A, Allikmets R. The human ATP-binding cassette (ABC) transporter superfamily. Genome Res. 2001;11:1156–1166. doi: 10.1101/gr.184901. [DOI] [PubMed] [Google Scholar]
- 23.Wang CY, Mayo MW, Korneluk RG, Goeddel DV, Baldwin AS., Jr NF-kappaB antiapoptosis: induction of TRAF1 and TRAF2 and c-IAP1 and c-IAP2 to suppress caspase-8 activation. Science. 1998;281:1680–1683. doi: 10.1126/science.281.5383.1680. [DOI] [PubMed] [Google Scholar]
- 24.Libermann TA, Baltimore D. Activation of interleukin-6 gene expression through the NF-kappa B transcription factor. Mol Cell Biol. 1990;10:2327–2334. doi: 10.1128/mcb.10.5.2327. [DOI] [PMC free article] [PubMed] [Google Scholar]
- 25.Kunsch C, Rosen CA. NF-kappa B subunit-specific regulation of the interleukin-8 promoter. Mol Cell Biol. 1993;13:6137–6146. doi: 10.1128/mcb.13.10.6137. [DOI] [PMC free article] [PubMed] [Google Scholar]
- 26.Goy A, Kahl B. Mantle cell lymphoma: the promise of new treatment options. Crit Rev Oncol Hematol. 2011;80:69–86. doi: 10.1016/j.critrevonc.2010.09.003. Epub 2010 Dec 17. [DOI] [PubMed] [Google Scholar]
- 27.Perez-Galan P, Mora-Jensen H, Weniger MA, et al. Bortezomib resistance in mantle cell lymphoma is associated with plasmacytic differentiation. Blood. 2011;117:542–552. doi: 10.1182/blood-2010-02-269514. [DOI] [PMC free article] [PubMed] [Google Scholar]
- 28.Lapidot T, Sirard C, Vormoor J, et al. A cell initiating human acute myeloid leukaemia after transplantation into SCID mice. Nature. 1994;367:645–648. doi: 10.1038/367645a0. [DOI] [PubMed] [Google Scholar]
- 29.Bhatia R, Holtz M, Niu N, et al. Persistence of malignant hematopoietic progenitors in chronic myelogenous leukemia patients in complete cytogenetic remission following imatinib mesylate treatment. Blood. 2003;101:4701–4707. doi: 10.1182/blood-2002-09-2780. [DOI] [PubMed] [Google Scholar]
- 30.Enguita-German M, Schiapparelli P, Rey JA, Castresana JS. CD133+ cells from medulloblastoma and PNET cell lines are more resistant to cyclopamine inhibition of the sonic hedgehog signaling pathway than CD133- cells. Tumour Biol. 2010;31:381–390. doi: 10.1007/s13277-010-0046-4. [DOI] [PubMed] [Google Scholar]
- 31.Al-Hajj M, Wicha MS, Benito-Hernandez A, Morrison SJ, Clarke MF. Prospective identification of tumorigenic breast cancer cells. Proc Natl Acad Sci U S A. 2003;100:3983–3988. doi: 10.1073/pnas.0530291100. [DOI] [PMC free article] [PubMed] [Google Scholar]
- 32.O'Brien CA, Pollett A, Gallinger S, Dick JE. A human colon cancer cell capable of initiating tumour growth in immunodeficient mice. Nature. 2007;445:106–110. doi: 10.1038/nature05372. [DOI] [PubMed] [Google Scholar]
- 33.Jordan CT. Cancer stem cell biology: from leukemia to solid tumors. Curr Opin Cell Biol. 2004;16:708–712. doi: 10.1016/j.ceb.2004.09.002. [DOI] [PubMed] [Google Scholar]
- 34.Dean M, Fojo T, Bates S. Tumour stem cells and drug resistance. Nat Rev Cancer. 2005;5:275–284. doi: 10.1038/nrc1590. [DOI] [PubMed] [Google Scholar]
- 35.Ishii H, Iwatsuki M, Ieta K, et al. Cancer stem cells and chemoradiation resistance. Cancer Sci. 2008;99:1871–1877. doi: 10.1111/j.1349-7006.2008.00914.x. [DOI] [PMC free article] [PubMed] [Google Scholar]
- 36.Kobune M, Takimoto R, Murase K, et al. Drug resistance is dramatically restored by hedgehog inhibitors in CD34+ leukemic cells. Cancer Sci. 2009;100:948–955. doi: 10.1111/j.1349-7006.2009.01111.x. [DOI] [PMC free article] [PubMed] [Google Scholar]
- 37.Mori N, Fujii M, Ikeda S, et al. Constitutive activation of NF-κB in primary adult T-cell leukemia cells. Blood. 1999;93:2360–2365. [PubMed] [Google Scholar]
- 38.Annuziata C, Davis RE, Demchenko Y, et al. Frequent engagement of the classical and alternative NF-κB pathways by diverse genetic abnormalities in multiple myeloma. Cancer Cell. 2007;12:115–130. doi: 10.1016/j.ccr.2007.07.004. [DOI] [PMC free article] [PubMed] [Google Scholar]
Associated Data
This section collects any data citations, data availability statements, or supplementary materials included in this article.
Supplementary Materials
Supplementary Figure E1. CD45+CD19−MCL-ICs isolated from xenograft tumors are bortezomib-resistant. (A) Bortezomib sensitivities of CD45+CD19− MCL-ICs and CD45+ CD19+MCL cells isolated from xenograft tumors were compared. The xenograft tumors were generated as described previously (passage 1) after injecting MCL cells [4].The xenograft tumor cells were first positively isolated using human CD45+ Miltenyi beads followed by separation of CD19+ and CD19− cells. Cells (1.5–2.5 × 10⁵ cells per well) were cultured in 24-well plates for 16 hours after the addition of bortezomib. Cell viability was determined by Cell Titer-Blue fluorometric assay and was indicated as a ratio compared to cell viability without treatment. Drugs were serially diluted as indicated from maximum drug doses of 100 nM. The results show the mean ± standard deviation of triplicate. CD45+CD19−MCL-ICs showed higher survival rates on tested drug concentrations compared to CD45+CD19+ MCL cells. CD19(−), CD45+CD19− cells; CD19(+), CD45+CD19+ cells. (B) The mean IC50 value of bortezomib for CD45+CD19− MCL-ICs that were isolated from xenograft tumors was much higher than those of the CD45+CD19+ MCL cells. CD19(−),CD45+CD19− cells; CD19(+),CD45+CD19+ cells. Bars represent averages. *p < 0.05 by unpaired t-test.
Supplementary Figure E2. Increased amounts of Rhodamine 123 low cells in MCL-ICs upon bortezomib treatment. CD45+CD19−MCL-ICs were isolated from three different patients and were treated with 100 nM bortezomib for 24 hours. CD34+ and CD3+ cells were depleted from the patient samples before isolation. Rhodamine 123 staining was then performed as indicated in Materials and Methods.