Abstract
Antifreeze proteins (AFPs) bind to ice crystal surfaces and thus inhibit the ice growth. The mechanism for how AFPs suppress freezing is commonly modeled as an adsorption-inhibition process by the Gibbs-Thomson effect. Here we develop an improved adsorption-inhibition model for AFP action based on the thermodynamics of impurity adsorption on the crystal surfaces. We demonstrate the derivation of a realistic relationship between surface protein coverage and the protein concentration. We show that the improved model provides a quantitatively better fit to the experimental antifreeze activities of AFPs from distinct structural classes, including fish and insect AFPs, in a wide range of concentrations. Our theoretical results yielded the adsorption coefficients of the AFPs on ice, suggesting that, despite the distinct difference in their antifreeze activities and structures, the affinities of the AFPs to ice are very close and the mechanism of AFP action is a kinetically controlled, reversible process. The applications of the model to more complex systems along with its potential limitations are also discussed.
Keywords: adsorption, crystal growth inhibition, ice, freezing point depression, antifreeze proteins
1. Introduction
Antifreeze proteins (AFPs), perhaps the most extensively studied biological antifreezes, are a structurally diverse group of proteins that allow certain organisms, such as fish, insects, and plants, to survive subzero temperatures [1–4]. In contrast to common antifreeze compounds, such as sodium chloride and glycerol, AFPs can inhibit ice growth by binding (adsorption) to the surfaces of ice crystals and depress the freezing point through a non-colligative effect. This inhibition process has been generally considered as one of the many cases of crystal-growth inhibition by impurity adsorptions. The resulting difference between the melting and freezing points termed thermal hysteresis (TH) is usually a measure of antifreeze activity by AFPs. Adsorption-inhibition mechanism was first proposed by Raymond and DeVries to explain the freezing resistance in the case of antifreeze glycoproteins (AFGPs) from polar fishes [5]. In this model, the adsorption of AFPs was assumed to be irreversibly onto the surfaces in the paths of growing steps of ice crystals, which obstructs the step growth at these sites and increases the curvature of the growth steps. According to the Gibbs-Thomson or Kelvin effect, the growth front will experience a freezing temperature depression as a consequence of the effects of surface tension [5,6]. In their original analysis, surface antifreeze coverage was assumed to be proportional to the concentration of the antifreeze and the freezing point depression can be described as a function of antifreeze concentration by the given relationship [5]:
| (1) |
where γ is the surface tension, M is the molecular weight of water, T0 is the normal freezing point, L is the molar latent heat, ρi is the density of ice, α is the distribution coefficient, r is the radius of the protein, C is the concentration of the protein in mg/mL, 2rαC is the surface antifreeze coverage, N is Avogadro's number and MW is the molecular weight of the protein.
Eq. 1 provides a reasonable fit to the experimental observations in the low antifreeze concentration range, but is biased toward fitting the data in the high antifreeze concentration range, especially in the cases that the TH activities of the antifreezes appear to approach maximum values at high concentrations [5]. The assumption that surface antifreeze coverage is proportional to the antifreeze concentration overestimates the adsorption coverage [7–10] and has been shown to be unrealistic by modern experiments with solid-fluid systems [11]. In order to overcome the large deviation of the fitting, especially at high antifreeze concentrations, kinetic descriptions of TH activity were proposed [7,12,13]. These kinetic models are able to describe the experimental observations at high antifreeze concentrations, but inadequate to account for the observed TH activities at low antifreeze concentrations. Langmuir isotherm has been used in the kinetic models by Burcham et al. and Can et al. to relate the fractional ice surface coverage to the protein concentration, however, a questionable assumption that the fractional ice surface coverage is proportional to the observed TH activity of specific AFP was used in the derivation of the relationship between TH activity and the protein concentration [7,12]. It has been recently suggested that different AFPs may have different structures and TH activities, but have very similar ice surface coverage [13].
In this study, we provide an improved model for the adsorption inhibition mechanism of action of antifreeze proteins. We make a thermodynamic argument for the depressed freezing point by these biological antifreezes (i.e., the TH activity of AFPs) by combining the Langmuir isotherm that is to describe the adsorption of AFPs onto the ice crystal surface, and the extreme limit in the step-pinning model of Cabrera and Vermilyea (C-V model) that the growth of step is inhibited when step length are shorter than the critical length. A more realistic relationship of the fractional ice surface coverage of AFPs and the AFP concentration is derived in this work. The theoretical TH values obtained by using the improved model fit the experimental results of different types of AFPs very well. The apparent maximum freezing point depression and the free energy change of the adsorption of an AFP can also be estimated using the theoretical model, which are comparable to the previously reported values. New insights into the mechanism of action of biological antifreezes are provided.
2. Theoretical methods
According to the adsorption-inhibition mechanism, the adsorption of AFPs onto the ice surfaces will inhibit the ice further growth. Assuming that the adsorption of antifreezes on the ice crystal surface obeys the Langmuir isotherm (no interaction between the proteins adsorbed onto the ice crystal surface), the fractional ice crystal surface coverage of the adsorbates (i.e., AFPs) can be described as [15]
| (2) |
K is the Langmuir adsorption coefficient and is defined by the expression K = exp (−ΔGa / RT), where ΔGa is the Gibbs free energy change of adsorption, R is the gas constant, and T is the temperature in Kelvin; and c is the concentration of the adsorbate (or the antifreeze).
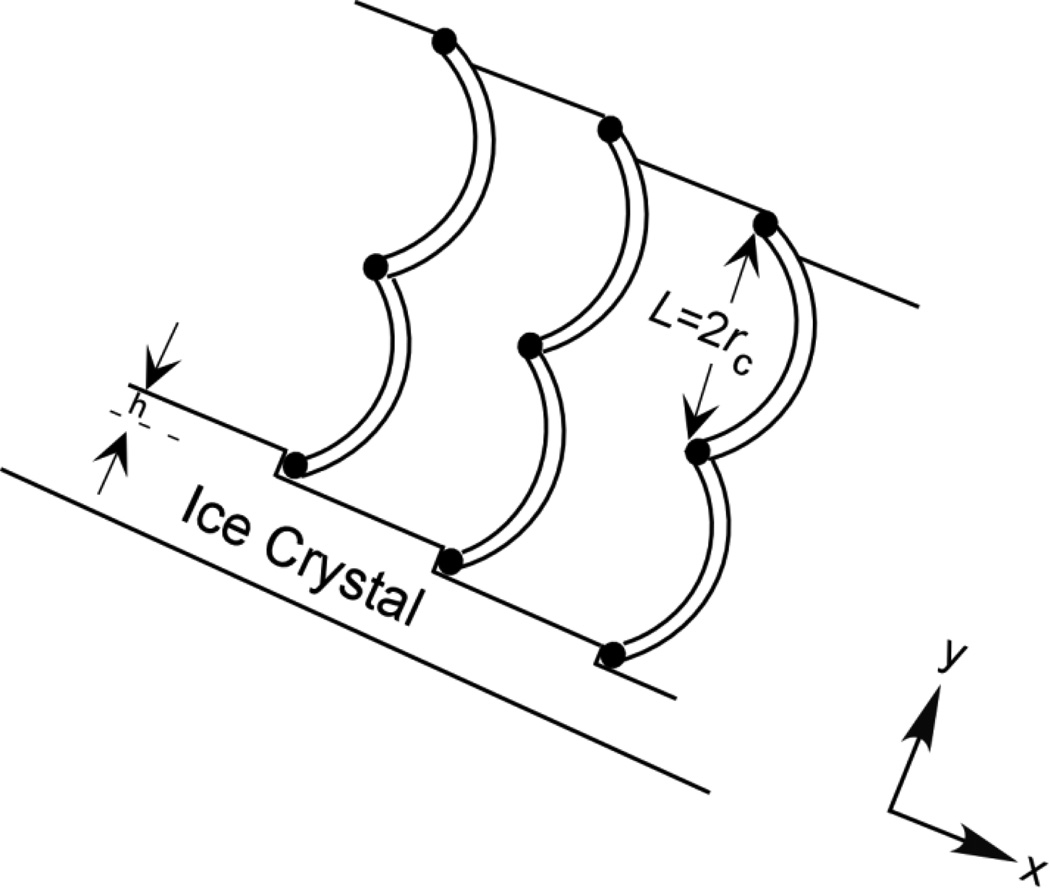
The inhibitory effect of impurity particles on crystal growth has been successfully described using the step-pinning model of Cabrera and Vermilyea (C-V model) [16,17]. As the molar amount of AFPs is much less than that of ice, we can consider AFPs as impurity particles in the C-V model. We assume that AFPs adsorb evenly onto the surfaces of ice crystals and every two adsorbed AFPs are separated by a distance, L, along the y axis (Fig. 1). Here we appeal to thermodynamic reasoning by considering an extreme condition in the C-V model that the ice growths of step segments between AFPs are inhibited when twice the critical radius of the curved step, rc, is equal to L (i.e., L= 2rc) (Fig. 1). Half-cylindrical ice with the radius rc and the terrace height h is thus resulted by the adsorption of AFPs (Fig. 1). With the consideration that the number of sites available for adsorption per unit area of the growth front is n and the number of sites adsorbed by an AFP is m, the ice surface coverage by AFPs can be defined as:
| (3) |
where d = h / L. Thus,
| (4) |
where , a constant related to the specific AFP and θmax is the maximum surface coverage of the ice by the AFP, a constant.
FIGURE 1.
Illustration of even adsorption of AFPs on an ice crystal surface described by the Cabreca-Vermiliyea (C-V) model. The ice binding sites of AFPs shown in black dots are considered as impurity particles on the ice crystal surface and every two adsorbed AFPs are separated by a distance, L, along the y axis. The black curves are the arrested growth segments. h is the terrace height and rc is the critical radius of the curved step. The growths of step segments between AFPs are inhibited when 2rc is equal to L. Here, h does not necessarily to be as big as a whole AFP molecule since only a few amino acids on the so-called ice-binding motif are generally involved in the ice affinity of an AFP [34]. According to X-ray crystallographic studies, the distance between two adjacent oxygen atoms in ice can be 4.48 Å [67] and h can be n × 4.48 Å (n = 1, 2, 3 …).
When the radius of half-cylindrical ice resulted by the adsorption of AFPs is very close to rc, the ice continues to grow until 2rc = L. The Gibbs free energy change of the AFP solution is:
| (5) |
where μi and μw are the chemical potentials of the growing tiny ice after AFPs adsorb onto the bulk ice and the tiny amount of water that will become ice, respectively, and ΔN is the change of number of water molecules from liquid phase to ice (the bulk ice remains no change). If the contact portions of the bulk ice and the newly formed ice are in the same phase (i.e., the single-crystal or the ice-water interface), there is no surface tension. The surface tension can be neglected even though the contact portions of the bulk ice and the newly formed ice are in different phases (e.g., the tiny ice is still in the ice-water interface) since the portion in the ice-water interface will become ice crystal very quickly and the total amount of the ice (both the bulk and the newly formed tiny ice) in the solution is very small. μi and μw can be expressed as functions of temperature and pressure,
| (6) |
and
| (7) |
where Tm is the melting temperature of pure water, p0 is the equilibrium water vapor pressure at the melting temperature of pure water, Si and Sw are the entropies of water and ice, vi is the specific molecular volume of ice, ΔT is the freezing point depression by AFPs (i.e., the TH activity of AFPs), and Δp (= pi − pw) is the vapor pressure difference between the ice-water interface and the ice phase.
At equilibrium, ΔG = 0, thus
| (8) |
| (9) |
Substituting (Sw − Si) = ΔHf / Tm, where ΔHf is the latent heat of fusion of ice, and pw − pi = γ / rc, where γ is surface tension into Eq. (9), and rearranging the equation, we get
| (10) |
Then, substituting Eq. (4) into Eq. (10), we get
| (11) |
where , a constant representing the maximum freezing point depression (i.e., the maximum TH activity) by AFPs. It is implied from Eq. (11) that the maximum freezing point depression is reached until the surface coverage of the ice by the specific AFPs reaches its maximum value.
After substitute Eq. (2) into Eq. (11) and rearrange, we obtain
| (12) |
where , a coefficient related to the apparent maximum TH activity of a specific AFP (i.e., the TH activity at the maximum surface coverage of the ice by the specific AFPs).
3. Experimental methods
3.1. Materials
Type III AFP from ocean pout (6,500 Da) was purchased from A/F Protein Inc. (Waltham, MA) and used as received. Fresh Milli-Q water from a Millipore Synergy Ultrapure water system (Billerica, MA) with a minimum resistivity of 18 MΩ·cm was used in all the experiments. All the weight measurements were carried out with an Ohaus Voyager Pro analytical and precision balance (Parsippany, NJ). The stock type III AFP solution was prepared by weighing the solute and dissolving the solute in a known volume of water. Dilutions were made, when necessary, to achieve desirable concentrations of sample solutions.
3.2. Thermal Hysteresis Measurements
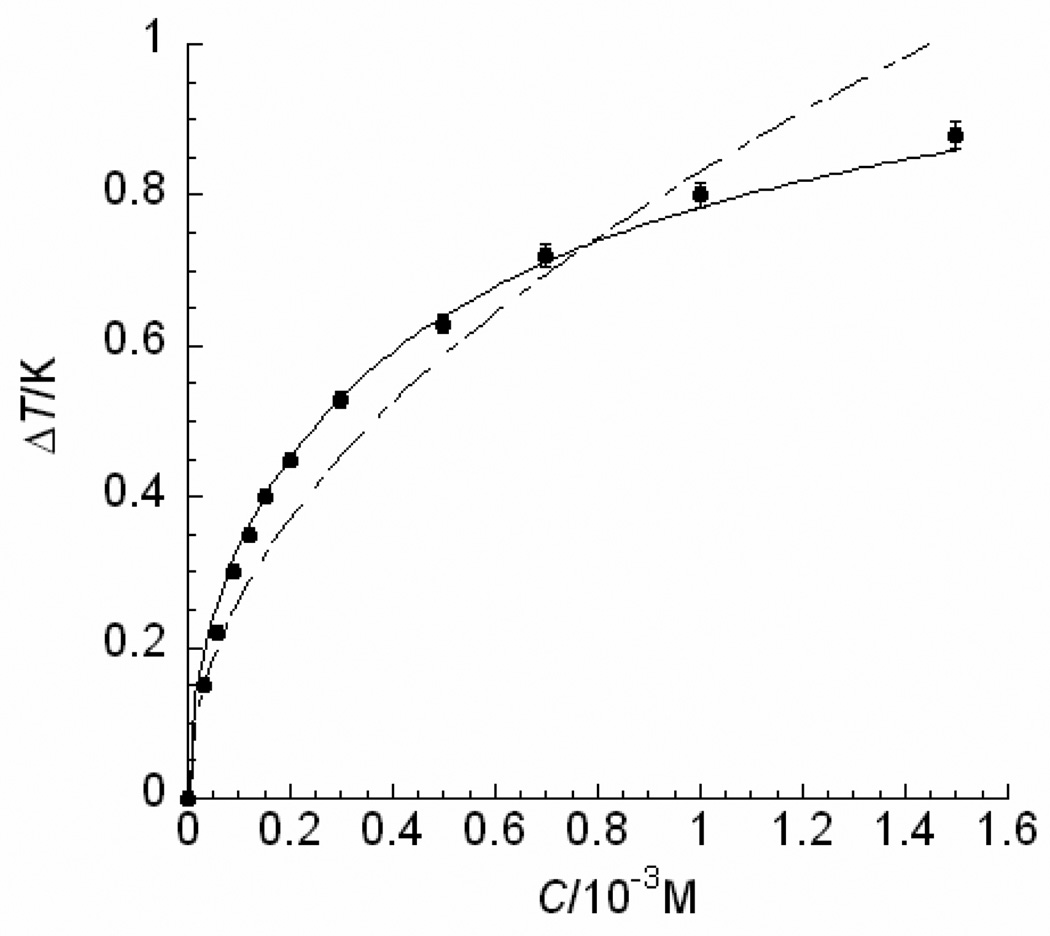
The measurements of thermal hysteresis (TH) activities of type III AFP solutions were performed using a DSC 823e (Mettler Toledo, OH) with an HSS7 high sensitivity sensor and a Julabo FT900 intracooler chiller (Julabo Company, PA). The method was as described previously [18–20]. The concentrations of the protein solutions were varied from 0.0 to 1.5 mM. Each sample solution was prepared at least twice and measured three times. The averages of the TH values were plotted in Fig. 5, and the standard deviations were within 2% of the mean values.
FIGURE 5.
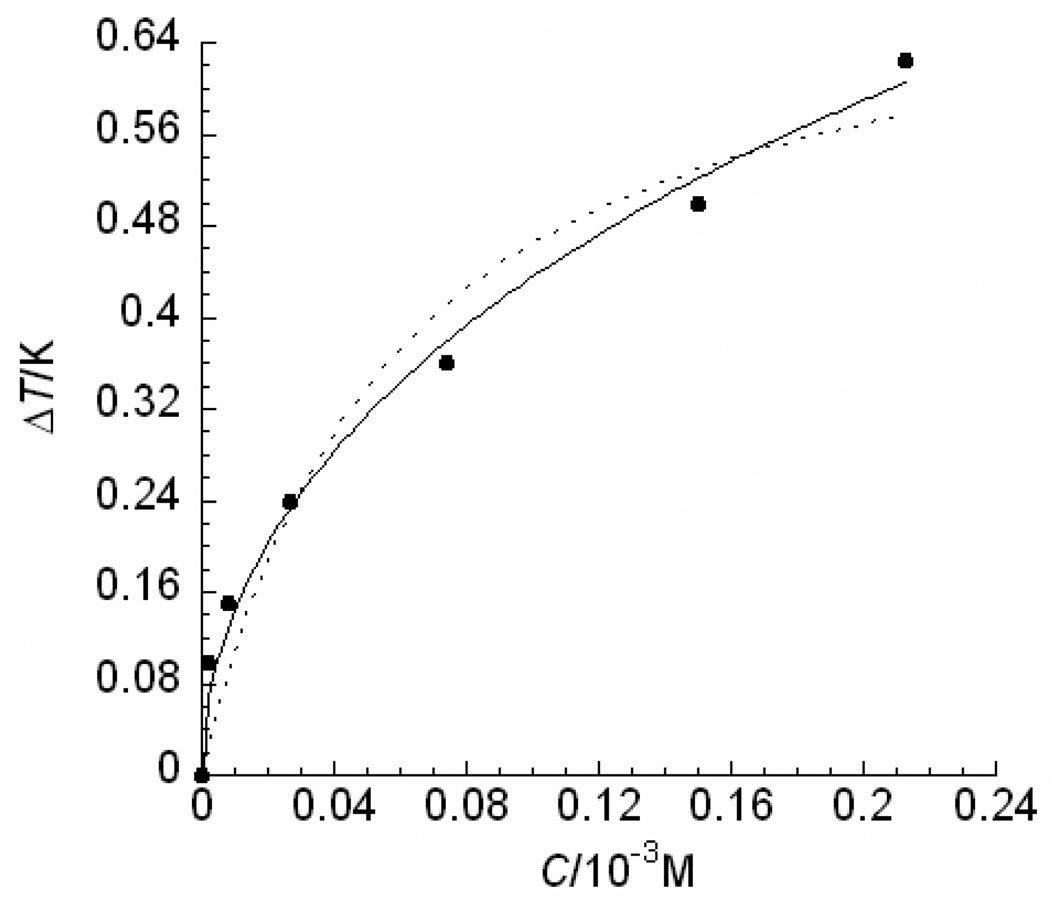
Thermal hysteresis (TH) activities of a globular Type III fish AFP at various concentrations. The experimental data reported here were measured in this laboratory and standard deviations were within 2% of the mean values. The theoretical values obtained by Eq. (12) (as shown in a solid line) demonstrate a better fit for the high concentration data than those obtained through the best possible fit using Eq. (1) [5] (as shown in a dashed line).
4. Results and discussion
As shown is Eq. (12), the theoretical TH activity is a function of the AFP concentration. If the concentration of the AFP is very low, ΔT increases proportionally to the square root of the concentration of the AFP (i.e., c → 0, ΔT → 0), which is the case in Eq. (1); if the concentration of the AFP reaches a high critical point, then θ → θmax and ΔT → ΔTmax. The theoretical saturation coverage of AFPs agrees well with the one estimated by ellipsometry [21]. Furthermore, the TH activity is dependent on the adsorption area of the AFP. Therefore, Eq. (12) can generally be used to fit the experimental data on various AFPs regardless of the structures of the specific AFPs.
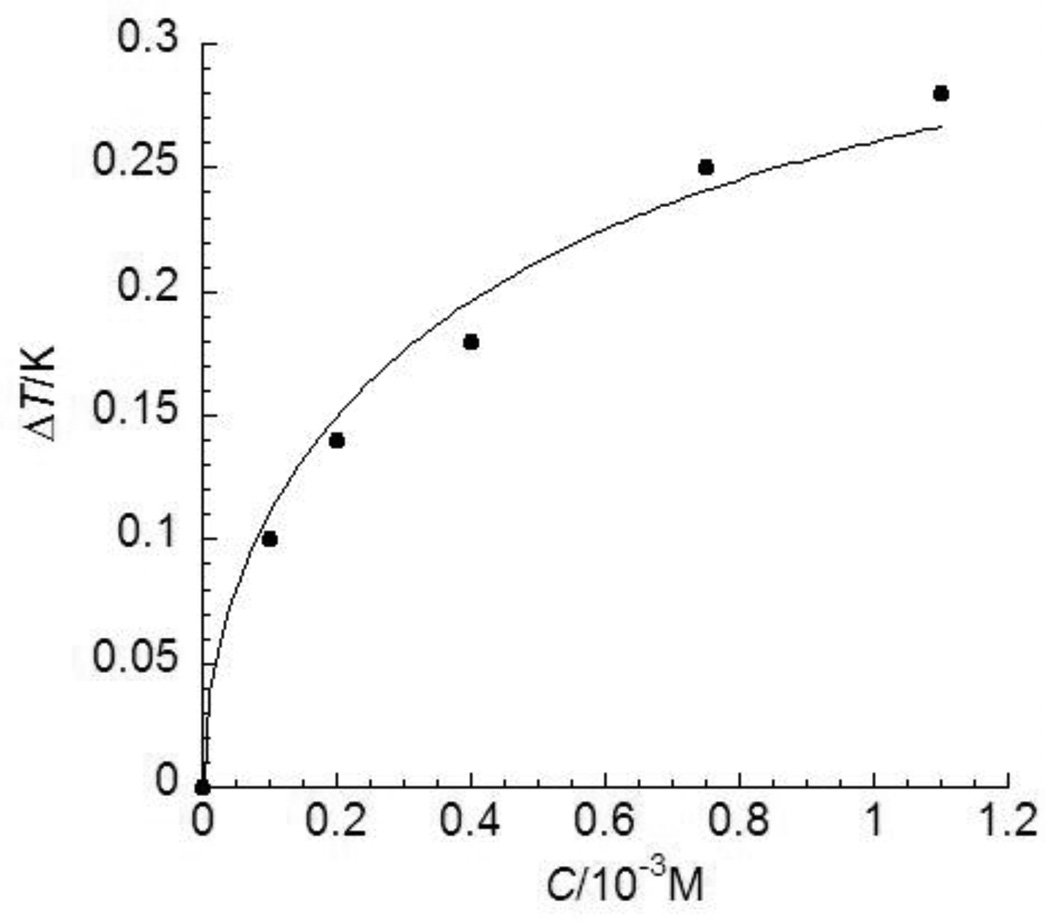
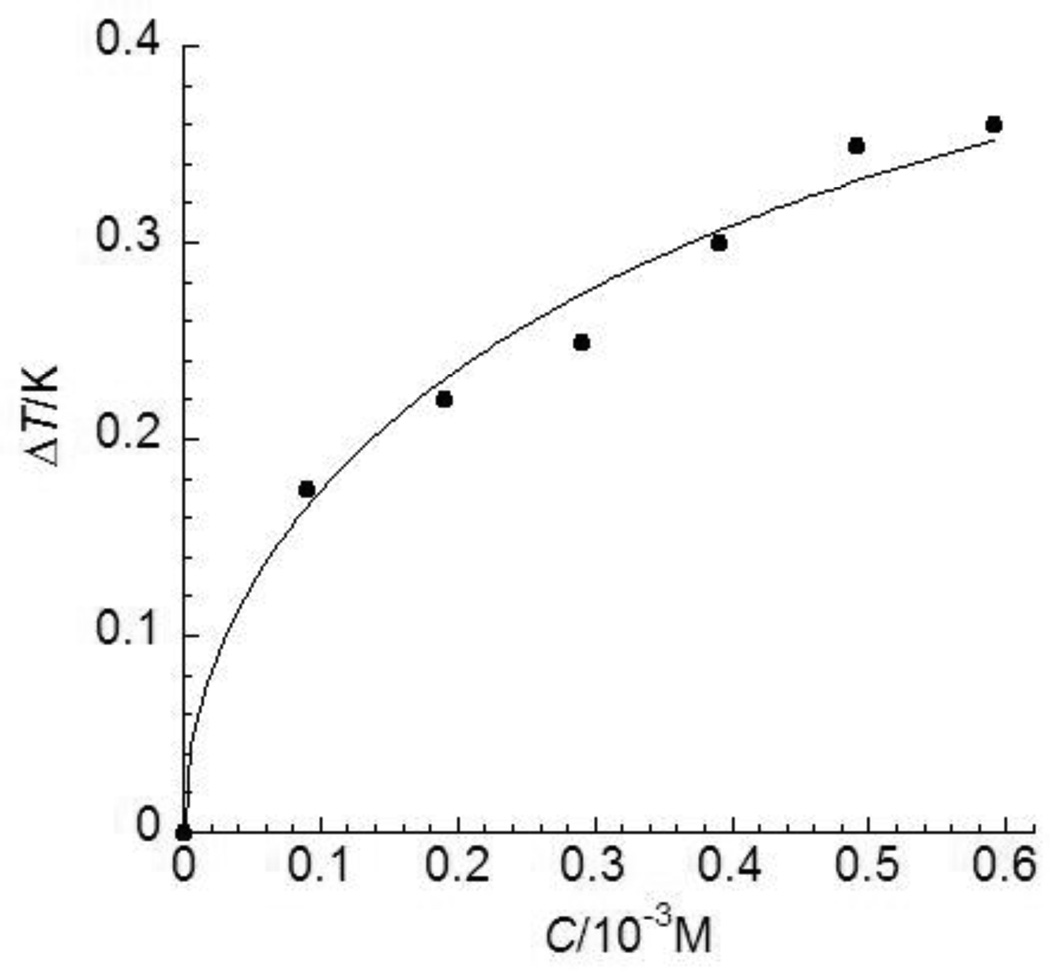
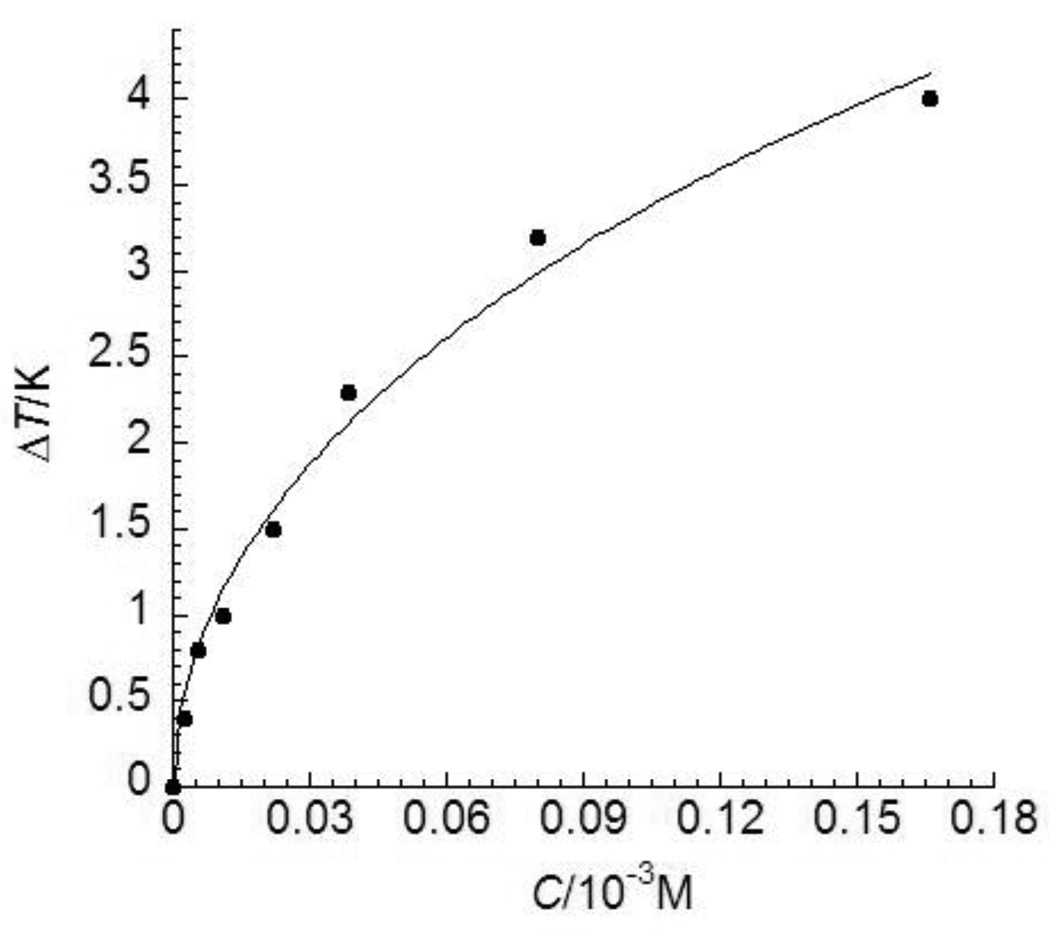
Here we demonstrated the fitting of the experimental data of five AFPs from distinct structural classes including a rod like α-helical type I fish AFP from shorthorn sculpin (Type I AFP) (Fig. 2) [22], a Ca2+-dependent C-type lectin-like type II AFPs from herring (Type II AFP-Ca2+) (Fig. 3) [23], a Ca2+-independent C-type lectin-like type II AFP from longsnout poacher (Type II AFP) (Fig. 4) [24], a globular type III AFP from ocean pout (Type III AFP) (Fig. 5) [25], and a β-helical AFP from the yellow mealworm beetle (TmAFP) (Fig. 6) [26]. In order to test the derived relationship between the freezing point depression by AFP and the concentration of AFP in a wide concentration range, we measured the TH activity of type III AFP using differential scanning calorimetry (DSC). The experimental TH values of type III AFP obtained in this study were in good agreement with the known data [25,27–30].
FIGURE 2.
Thermal hysteresis (TH) activities of a Type I fish AFP at various concentrations. The experimental data are adopted from ref. 22 shown as solid dots and standard deviations were not available. The theoretical values obtained by Eq. (12) are shown in a solid line.
FIGURE 3.
Thermal hysteresis (TH) activities of a Ca2+-dependent C-type lectin-like Type II fish AFP at various concentrations. The experimental data are adopted from ref. 23 shown as solid dots and standard deviations were not available. The theoretical values obtained by Eq. (12) are shown in a solid line.
FIGURE 4.
Thermal hysteresis (TH) activities of a Ca2+-independent C-type lectin-like Type II fish AFP at various concentrations. The experimental data are adopted from ref. 24 shown as solid dots and standard deviations were within 6% of the mean values. The theoretical values obtained by Eq. (12) (as shown in a solid line) demonstrate a better fit for these low concentration data than those obtained through the best possible fit using Eq. (6) in ref. 7 (as shown in a dotted line).
FIGURE 6.
Thermal hysteresis (TH) activities of an insect AFP, TmAFP, at various concentrations. The experimental data are adopted from ref. 26 shown as solid dots and standard deviations were within 8% of the mean values. The theoretical values obtained by Eq. (12) are shown in a solid line.
The theoretical TH activities of the five representative AFPs calculated by Eq. (12) shown as solid lines were in quantitative agreement with the experimental data shown as solid circles (Figs. 2–6). As shown in Figs. 2–6, the theoretical results are in excellent agreement with the empirical values. And the estimated Langmuir adsorption coefficients of the AFPs are listed in Table 1. Despite the differences in antifreeze activities and structures, the association constants for the AFPs bound to ice are very similar to each other (Table 1), suggesting that the AFPs with higher antifreeze activities do not bind to ice more readily, nor do they bind more tightly.
TABLE 1.
The estimated apparent maximum freezing point depression, adsorption coefficients and free energy change of adsorption for the AFPs.a
| Antifreeze Protein (AFP) |
|
K (10−3 M−1) |
ΔG at 273 K (kJ mol−1) |
|
|---|---|---|---|---|
| Type I AFP | 0.37 (0.01) | 0.968 (0.08) | −15.60 (0.08) | |
| Type II AFP-Ca2+ | 0.58 (0.03) | 0.981 (0.05) | −15.64 (0.05) | |
| Type II AFP | 1.44 (0.01) | 0.990 (0.05) | −15.66 (0.05) | |
| Type III AFP | 1.10 (0.01) | 0.991 (0.03) | −15.66 (0.03) | |
| TmAFP | 10.9 (0.3) | 0.980 (0.06) | −15.63 (0.06) |
The Langmuir adsorption coefficient, K, was estimated by fitting the experimental data using Eq. 12. The free energy change of adsorption is estimated from ΔGa = −RT ln K, where R = 8.314 J mol−1 K−1 and T = 273 K. Standard errors are in the parentheses.
Due to the inapplicability or the poor sensitivity of usual spectroscopic techniques in ice, a highly scattering and anisotropic medium, it is nearly impossible to directly measure the affinity of an AFP to ice [12,13,31]. The indirect experimental results of the adsorption affinities of fish and insect AFPs to ice demonstrated that insect AFPs do not bind to ice with higher affinity than fish AFPs regardless of their distinct differences in antifreeze activities and structures [13]. Our results agree very well with their experimental results and provide a theoretical support for this earlier report [13]. By combining the experimental and theoretical results, we can also estimate the free energy change for the adsorption of the AFP onto the ice crystal surface by the equation, ΔGa = − RT ln K (Table 1). The estimated values of the free energy change of the adsorption are reasonably comparable to earlier predictions [32,33].
The Langmuir model of impurity adsorption dynamics has been accepted [11,17,34]. In this study, a simple Langmuir isotherm is used to describe the surface coverage of AFPs, which has an implication of a possible reversible adsorption of AFPs. It has been debated for decades whether the adsorption of antifreeze (glyco)proteins, AF(G)Ps, on ice surfaces is reversible or irreversible [35–38]. The important concerns regarding the irreversibility adsorption are summarized below.
First, adsorption dynamics of some AF(G)Ps on ice surfaces has been observed by the methods including surface second harmonic generation (SSHG) [39,40], temperature gradient thermometry [41], NMR [42,43], FTIR [43] spectroscopy and Langmuir adsorption process for the binding of the AF(G)Ps to ice was suggested. Recently, the adsorption kinetics of the fluorescein isothiocyanate (FITC) labeled AFGPs on ice surfaces was studied using confocal fluorescence microscopy [44]. The small fluorescence label, FTIC, has advantage over macromolecular fluorescence label (e.g., green fluorescent proteins) [45] since the small molecule label can limit the effect of slow diffusion. Similar cases have been reported for inhibition of mineralization [46]. Moreover, irreversible adsorption is not generally accepted for adsorbed polymers [47]. Polydisperisty effects of polymers and the slow diffusion of polymers may mask their desorption [48].
Second, hydrogen bonding [49–52], van der Waals, hydrophobic interaction [53–58], and/or some combination of the three are account for the binding of AF(G)Ps to ice. But irreversible adsorption is attributed to stronger bond formation between the adsorbate and the adsorbent [29,59,60]. No such strong bonds are detected between antifreeze molecules and ice to account for irreversible adsorption.
Third, the heterogeneity and highly fluidic nature of the ice surface make it less possible for irreversible adsorption [44]. The quasi-liquid layer (QLL) is involved in antifreeze function as suggested by computer simulations [61]. Experimental and theoretical results have suggested that an ice-water interface should be considered in the adsorption to ice and the accumulation of the antifreeze molecules at such ice/water interface is thus implied as a reversible process [61–66]. Here, the reported thermodynamic model applies to the ice-water interface. For example, when n = 2, h = 2 × 4.48 Å (Figure 1) [67], close to the previously determined 10 Å interface thickness [66]. It should also be noted that the value of h varies under different experimental conditions, such as the cooling rate and pressure.
Finally, there is no evidence supporting that the complete inhibition of ice growth must need the irreversibility of the adsorption of antifreeze molecules to the ice [37]. Under the reversible adsorption conditions, the growth of ice can still be completely inhibited provided the kinetics of adsorption of AF(G)Ps overcomes that of water on ice surfaces.
The improved model is simple and can fit the experimental data of various AFPs in a wide concentration range very well. However, several potential limitations should be noted. In the derivation of this model, we assume that AFPs are evenly distributed on the ice surface. Experimentally, it is true only when we allow the temperature to cool down very slowly, so that distribution equilibrium is reached. In addition, the Langmuir isotherm ignores the possibility that the initial overlayer may act as a substrate for further adsorption. In this case, more complex models, such as BET isotherm [68], need to be considered. Furthermore, as more and more AFPs adsorb on the ice surface, the further adsorption of the AFPs cannot be considered as homogeneous. Statistical model may be used for the non-homogeneous cases. Finally, we cannot rule out the existence of more complex mechanisms.
5. Conclusions
The detailed derivation of an improved adsorption-inhibition model for simple AFPs is presented in this study. This model quantitatively describes the TH phenomenon in spite of the diverse structures of antifreeze molecules. The apparent maximum freezing point depression and the free energy change of the adsorption of AFPs onto ice surfaces have been first estimated using Eq. (12). The results are reliable and meaningful, which have much broader utility for a better understanding the mechanisms of biological antifreezes. This work demonstrates the power of thermodynamics as a tool to derive useful information for a complex system and suggests that the mechanism of AFP action is a kinetically controlled, reversible process.
Highlights.
► A thermodynamic consideration for thermal hysteresis (TH) caused by antifreeze proteins (AFPs) is given. ► A realistic relationship between the ice surface coverage by AFPs and the concentration of AFP is developed. ► The theoretical and experimental TH values of various AFPs are in good agreement. ► Mechanistic insights are given for biological antifreezes
Acknowledgments
This work was supported by National Institutes of Health grants GM086249 and Research Corporation Cottrell College Science Award CC10492 to XW.
Footnotes
Publisher's Disclaimer: This is a PDF file of an unedited manuscript that has been accepted for publication. As a service to our customers we are providing this early version of the manuscript. The manuscript will undergo copyediting, typesetting, and review of the resulting proof before it is published in its final citable form. Please note that during the production process errors may be discovered which could affect the content, and all legal disclaimers that apply to the journal pertain.
References
- 1.DeVries AL, Wohlschlag DE. Science. 1969;163:1073–1075. doi: 10.1126/science.163.3871.1073. [DOI] [PubMed] [Google Scholar]
- 2.Fletcher GL, Hew CL, Davies PL. Annu. Rev. Physiol. 2001;63:359–390. doi: 10.1146/annurev.physiol.63.1.359. [DOI] [PubMed] [Google Scholar]
- 3.Duman JG. Annu. Rev. Physiol. 2001;63:327–357. doi: 10.1146/annurev.physiol.63.1.327. [DOI] [PubMed] [Google Scholar]
- 4.Breton G, Danyluk J, Ouellet Fo, Sarhan F. Biotechnol. Annu. Rev. 2000;6:59–101. doi: 10.1016/s1387-2656(00)06019-1. [DOI] [PubMed] [Google Scholar]
- 5.Raymond JA, DeVries AL. Proc. Natl. Acad. Sci. U.S.A. 1977;74:2589–2593. doi: 10.1073/pnas.74.6.2589. [DOI] [PMC free article] [PubMed] [Google Scholar]
- 6.Chernov AA. Modern Crystallography III: Crystal Growth. New York: Springer; 1984. [Google Scholar]
- 7.Burcham TS, Osuga DT, Yeh Y, Feeney RE. J. Biol. Chem. 1986;261:6390–6397. [PubMed] [Google Scholar]
- 8.Kuroda T. Proceedings of the 4th Topical Conference on Crystal Growth Mechanisms; Hokkaido Press; Japan. 1991. p. 157. [Google Scholar]
- 9.Wilson PW. Cryoletters. 1993;14:31–36. [Google Scholar]
- 10.Wang S, Amornwittawat N, Banatlao J, Chung M, Kao Y, Wen X. J. Phys. Chem. B. 2009;113:13891–13894. doi: 10.1021/jp907762u. [DOI] [PMC free article] [PubMed] [Google Scholar]
- 11.Weaver ML, Qiu SR, Hoyer JR, Casey WH, Nancollas GH, De Yoreo JJ. ChemPhysChem. 2006;7:2081–2084. doi: 10.1002/cphc.200600371. [DOI] [PubMed] [Google Scholar]
- 12.Can O, Holland NB. J. Colloid Interface Sci. 2009;329:24–30. doi: 10.1016/j.jcis.2008.10.001. [DOI] [PubMed] [Google Scholar]
- 13.Marshall CB, Tomczak MM, Gauthier SY, Kuiper MJ, Lankin C, Walker VK, Davies PL. Biochemistry. 2004;43:148–154. doi: 10.1021/bi035605x. [DOI] [PubMed] [Google Scholar]
- 14.Sander LM, Tkachenko AV. Phys. Rev. Lett. 2004;93:128102. doi: 10.1103/PhysRevLett.93.128102. [DOI] [PubMed] [Google Scholar]
- 15.Langmuir I. J. Am. Chem. Soc. 1918;40:1361–1403. [Google Scholar]
- 16.Cabrera N, Vermilyea DA. In: Doremus RH, Roberts BW, Turnbull D, editors. Proceedings of the International Conference; Wiley, Cooperstown; New York. 1958. [Google Scholar]
- 17.Weaver ML, Qiu SR, Hoyer JR, Casey WH, Nancollas GH, De Yoreo JJ. J. Cryst. Growth. 2007;306:135–145. [Google Scholar]
- 18.Amornwittawat N, Wang S, Duman JG, Wen X. Biochim. Biophys. Acta. 2008;1784:1942–1948. doi: 10.1016/j.bbapap.2008.06.003. [DOI] [PMC free article] [PubMed] [Google Scholar]
- 19.Amornwittawat N, Wang S, Banatlao J, Chung M, Velasco E, Duman JG, Wen X. Biochim. Biophys. Acta. 2009;1794:341–346. doi: 10.1016/j.bbapap.2008.10.011. [DOI] [PMC free article] [PubMed] [Google Scholar]
- 20.Wang S, Amornwittawat N, Juwita V, Kao Y, Duman JG, Pascal TA, Goddard WA, Wen X. Biochemistry. 2009;48:9696–9703. doi: 10.1021/bi901283p. [DOI] [PMC free article] [PubMed] [Google Scholar]
- 21.Wilson PW, Beaglehole D, DeVries AL. Biophys. J. 1993;64:1878–1884. doi: 10.1016/S0006-3495(93)81559-5. [DOI] [PMC free article] [PubMed] [Google Scholar]
- 22.Low W-K, Miao M, Ewart KV, Yang DSC, Fletcher GL, Hew CL. J. Biol. Chem. 1998;273:23098–23103. doi: 10.1074/jbc.273.36.23098. [DOI] [PubMed] [Google Scholar]
- 23.Liu Y, Li Z, Lin Q, Kosinski J, Seetharaman J, Bujnicki JM, Sivaraman J, Hew C-L. PLoS ONE. 2007;2:e548. doi: 10.1371/journal.pone.0000548. [DOI] [PMC free article] [PubMed] [Google Scholar]
- 24.Nishimiya Y, Kondo H, Takamichi M, Sugimoto H, Suzuki M, Miura A, Tsuda S. J. Mol. Biol. 2008;382:734–746. doi: 10.1016/j.jmb.2008.07.042. [DOI] [PubMed] [Google Scholar]
- 25.Sonnichsen FD, Sykes BD, Chao H, Davies PL. Science. 1993;259:1154–1157. doi: 10.1126/science.8438165. [DOI] [PubMed] [Google Scholar]
- 26.Marshall CB, Daley ME, Sykes BD, Davies PL. Biochemistry. 2004;43:11637–11646. doi: 10.1021/bi0488909. [DOI] [PubMed] [Google Scholar]
- 27.Chao H, Sonnichsen FD, Deluca CI, Sykes BD, Davies PL. Protein Sci. 1994;3:1760–1769. doi: 10.1002/pro.5560031016. [DOI] [PMC free article] [PubMed] [Google Scholar]
- 28.Miura K, Ohgiya S, Hoshino T, Nemoto N, Odaira M, Nitta R, Tsuda S. J. Biochem. 1999;126:387–394. doi: 10.1093/oxfordjournals.jbchem.a022462. [DOI] [PubMed] [Google Scholar]
- 29.Miura K, Ohgiya S, Hoshino T, Nemoto N, Suetake T, Miura A, Spyracopoulos L, Kondo H, Tsuda S. J. Biol. Chem. 2001;276:1304–1310. doi: 10.1074/jbc.M007902200. [DOI] [PubMed] [Google Scholar]
- 30.Kristiansen E, Zachariassen KE. Cryobiology. 2005;51:262–280. doi: 10.1016/j.cryobiol.2005.07.007. [DOI] [PubMed] [Google Scholar]
- 31.Gabellieri E, Strambini GB. Biophys. J. 2003;85:3214–3220. doi: 10.1016/S0006-3495(03)74739-0. [DOI] [PMC free article] [PubMed] [Google Scholar]
- 32.Cheng A, Merz KM., Jr Biophys. J. 1997;73:2851–2873. doi: 10.1016/S0006-3495(97)78315-2. [DOI] [PMC free article] [PubMed] [Google Scholar]
- 33.Jorov A, Zhorov BS, Yang DSC. Protein Sci. 2004;13:1524–1537. doi: 10.1110/ps.04641104. [DOI] [PMC free article] [PubMed] [Google Scholar]
- 34.Weaver ML, Qiu SR, Friddle RW, Casey WH, De Yoreo JJ. Cryst. Growth Des. 2010;10:2954–2959. doi: 10.1021/cg901626a. [DOI] [PMC free article] [PubMed] [Google Scholar]
- 35.Yeh Y, Feeney RE. Chem. Rev. 1996;96:601–618. doi: 10.1021/cr950260c. [DOI] [PubMed] [Google Scholar]
- 36.Gibson MI. Polym. Chem. 2010;1:1141–1152. [Google Scholar]
- 37.Knight CA, Cheng CC, DeVries AL. Biophys. J. 1991;59:409–418. doi: 10.1016/S0006-3495(91)82234-2. [DOI] [PMC free article] [PubMed] [Google Scholar]
- 38.Knight CA, DeVries AL. Phys. Chem. Chem. Phys. 2009;11:5749–5761. doi: 10.1039/b821256b. [DOI] [PubMed] [Google Scholar]
- 39.Feeney RE, Burcham TS, Yeh Y. Annu. Rev. Biophys. Biophys. Chem. 1986;15:59–78. doi: 10.1146/annurev.bb.15.060186.000423. [DOI] [PubMed] [Google Scholar]
- 40.Brown RA, Yeh Y, Burcham TS, Feeney RE. Biopolymers. 1985;24:1265–1270. doi: 10.1002/bip.360240713. [DOI] [PubMed] [Google Scholar]
- 41.Chapsky L, Rubinsky B. FEBS Lett. 1997;412:241–244. doi: 10.1016/s0014-5793(97)00787-4. [DOI] [PubMed] [Google Scholar]
- 42.Ba Y, Wongskhaluang J, Li J. J. Am. Chem. Soc. 2003;125:330–331. doi: 10.1021/ja027557u. [DOI] [PubMed] [Google Scholar]
- 43.Tsvetkova NM, Phillips BL, Krishnan VV, Feeney RE, Fink WH, Crowe JH, Risbud SH, Tablin F, Yeh Y. Biophys. J. 2002;82:464–473. doi: 10.1016/S0006-3495(02)75411-8. [DOI] [PMC free article] [PubMed] [Google Scholar]
- 44.Zepeda S, Yokoyama E, Uda Y, Katagiri C, Furukawa Y. Cryst. Growth Des. 2008;8:3666–3672. [Google Scholar]
- 45.Pertaya N, Marshall CB, DiPrinzio CL, Wilen L, Thomson ES, Wettlaufer JS, Davies PL, Braslavsky I. Biophys. J. 2007;92:3663–3673. doi: 10.1529/biophysj.106.096297. [DOI] [PMC free article] [PubMed] [Google Scholar]
- 46.Qiu SR, Orme CA. Chem. Rev. 2008;108:4784–4822. doi: 10.1021/cr800322u. [DOI] [PubMed] [Google Scholar]
- 47.Cohen Stuart MA. Biopolymers at Interfaces. New York: Marcel Dekker, Inc.; 2003. [Google Scholar]
- 48.Newmark RA. J. Polym. Sci. Polym. Chem. Ed. 1980;18:559–563. [Google Scholar]
- 49.DeVries AL. Trans. R. Soc. Lond., B, Biol. Sci. 1984;304:575–588. [Google Scholar]
- 50.Hew CL, Yang DSC. Eur. J. Biochem. 1992;203:33–42. doi: 10.1111/j.1432-1033.1992.tb19824.x. [DOI] [PubMed] [Google Scholar]
- 51.Wen D, Laursen R. J. Biol. Chem. 1992;267:14102–14108. [PubMed] [Google Scholar]
- 52.Knight CA, Driggers E, DeVries AL. Biophys. J. 1993;64:252–259. doi: 10.1016/S0006-3495(93)81361-4. [DOI] [PMC free article] [PubMed] [Google Scholar]
- 54.Wen DL. R. A., Biophys. J. 1992;63:1659–1662. doi: 10.1016/S0006-3495(92)81750-2. [DOI] [PMC free article] [PubMed] [Google Scholar]
- 54.Chao H, Houston ME, Hodges RS, Kay CM, Sykes BD, Loewen MC, Davies PL, Sonnichsen FD. Biochemistry. 1997;36:14652–14660. doi: 10.1021/bi970817d. [DOI] [PubMed] [Google Scholar]
- 55.Madura JD, Baran K, Wierzbicki A. J. Mol. Recognit. 2000;13:101–113. doi: 10.1002/(SICI)1099-1352(200003/04)13:2<101::AID-JMR493>3.0.CO;2-9. [DOI] [PubMed] [Google Scholar]
- 56.Haymet ADJ, Ward LG, Harding MM. J. Am. Chem. Soc. 1999;121:941–948. [Google Scholar]
- 57.Haymet ADJ, Ward LG, Harding MM, Knight CA. FEBS Lett. 1998;430:301–306. doi: 10.1016/s0014-5793(98)00652-8. [DOI] [PubMed] [Google Scholar]
- 58.Sönnichsen FD, DeLuca CI, Davies PL, Sykes BD. Structure. 1996;4:1325–1337. doi: 10.1016/s0969-2126(96)00140-2. [DOI] [PubMed] [Google Scholar]
- 59.Hall DG, Lips A. Langmuir. 1999;15:1905–1912. [Google Scholar]
- 60.Lowell S, Shields JE, Thomas MA, Thommes M. Characterization of Porous Solids and Powders: Surface Area, Pore Size and Density. 1st ed. Netherlands: Kluwer Academic Publishers; 2004. [Google Scholar]
- 61.Wierzbicki A, Dalal P, Cheatham TE, Knickelbein JE, Haymet ADJ, Madura JD. Biophys. J. 2007;93:1442–1451. doi: 10.1529/biophysj.107.105189. [DOI] [PMC free article] [PubMed] [Google Scholar]
- 62.Nutt DR, Smith JC. J. Am. Chem. Soc. 2008;130:13066–13073. doi: 10.1021/ja8034027. [DOI] [PubMed] [Google Scholar]
- 63.Smolin N, Daggett V. J. Phys. Chem. B. 2008;112:6193–6202. doi: 10.1021/jp710546e. [DOI] [PubMed] [Google Scholar]
- 64.Bilgram JH, Güttinger H, Känzig W. Phys. Rev. Lett. 1978;40:1394–1397. [Google Scholar]
- 65.Hayward JA, Haymet ADJ. Phys. Chem. Chem. Phys. 2002;4:3712–3719. [Google Scholar]
- 66.Beaglehole D, Wilson P. J. Phys. Chem. 1993;97:11053–11055. [Google Scholar]
- 67.Fletcher NH. The Chemical Physics of Ice. Cambridge: Cambridge University; 1970. [Google Scholar]
- 68.Atkins PW. Physical Chemistry. Third Edition. New York: W. H. Freeman and Company; 1985. [Google Scholar]


