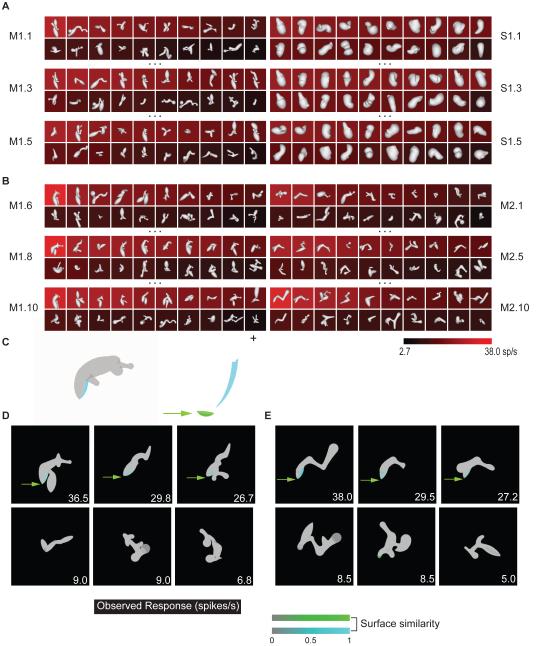
Figure 4.
Surface tuning example. (A, B) Selected generations from two medial axis lineages and one surface lineage. Details as in Figure 1. (C) Optimum surface template model (based on correlation with response rates in both lineages), projected onto the template source stimulus (left) and schematized (right) as a combination of two surface fragment icons (green, cyan) positioned relative to object center (cross). The acute convex point (green) is enlarged for visibility. (D) Surface template similarity (see scale bar) for three example high response stimuli (top row) and three low response stimuli (bottom row) from the first medial axis lineage. (E) Surface template similarity for high and low response stimuli from the second medial axis lineage.

