

Abstract
Cytochrome P450 (CYP) epoxygenases, CYP2C8, 2C9 and 2J2 mRNA and proteins, were expressed in prostate carcinoma (PC‐3, DU‐145 and LNCaP) cells. 11,12‐Epoxyeicosatrienoic acid (11,12‐EET) was the major arachidonic acid metabolite in these cells. Blocking EET synthesis by a selective CYP epoxygenase inhibitor (N‐methylsulfonyl‐6‐(2‐propargyloxyphenyl)hexanamide [MS‐PPOH]) inhibited tonic (basal) invasion and migration (motility) while exogenously added EET induced cell motility in a concentration‐dependent manner. An epidermal growth factor receptor (EGFR) kinase inhibitor (AG494) or a PI3 kinase inhibitor (LY294002) inhibited cell migration and reduced 11,12‐EET‐induced cell migration. Importantly, synthetic EET antagonists (14,15‐epoxyeicosa‐5(Z)‐enoic acid [14,15‐EEZE], 14,15‐epoxyeicosa‐5(Z)‐enoic acid 2‐[2‐(3‐hydroxy‐propoxy)‐ethoxy]‐ethyl ester [14,15‐EEZE‐PEG] and 14,15‐epoxyeicosa‐5(Z)‐enoic‐methylsulfonylimide [14,15‐EEZE‐mSI]) inhibited EET‐induced cell invasion and migration. 11,12‐EET induced cell stretching and myosin‐actin microfilament formation as well as increased phosphorylation of EGFR and Akt (Ser473), while 14,15‐EEZE inhibited these effects. These results suggest that EET induce and EET antagonists inhibit cell motility, possibly by putative EET receptor‐mediated EGFR and PI3K/Akt pathways, and suggest that EET antagonists are potential therapeutic agents for prostate cancer. (Cancer Sci 2010; 101: 2629–2636)
Cytochrome P450 (CYP) epoxygenases metabolize arachidonic acid (AA) to 5,6‐, 8,9‐, 11,12‐ and 14,15‐epoxyeicosatrienoic acid (EET). In humans, multiple CYP including CYP2C8, 2C9 and 2J2 convert AA to EET.( 1 , 2 ) Their catalytic efficiency and regio‐selectivity of EET synthesis are isoform‐ and species‐specific.( 3 , 4 ) Epoxyeicosatrienoic acids stimulate proliferation, angiogenesis and migration of endothelial cells.( 5 , 6 ) Our previous studies on cardiovascular systems suggest that EET bind to a putative binding protein or receptor(s) to initiate signaling,( 7 , 8 ) although the protein(s) has not been fully characterized. Thus, this uncharacterized binding protein will be referred as “a putative receptor”. Numerous synthetic compounds have been developed as EET antagonists and used to antagonize the actions of the EET in vascular systems.( 9 , 10 )
Numerous CYP epoxygenase mRNA including CYP2C8, 2J2 and 2C9 are differentially expressed in the human prostate gland( 4 , 11 ) and proteins of the CYP2C family are present in malignant prostate tissue samples,( 12 , 13 ) suggesting potential roles of CYP epoxygenases and EET in prostate cancer. Because EET stimulate cell migration of several cell types,( 5 , 14 , 15 ) we determined the roles of EET in the regulation of motility of prostate carcinoma cells and possible signaling pathways of EET in this regulation. Furthermore, we determined whether a group of synthetic compounds, known for their ability to antagonize the actions of EET in vascular systems,( 9 , 10 ) can block EET‐induced cell motility. These EET antagonists may represent new potential therapeutic agents in the treatment of prostate cancer.
Materials and Methods
Materials. PC‐3, DU‐145 and LNCaP cells were obtained from the American Type Culture Collection (ATCC, Rockville, MD, USA). Eagle’s minimal essential medium (RPMI) was obtained from Invitrogen (Carlsbad, CA, USA). Arachidonic acid, epidermal growth factor (EGF), miconazole and LY294002 were obtained from Sigma Chemical (St Louis, MO, USA). AG‐494, 14,15‐EET, 11,12‐EET, 8,9‐EET, 5,6‐EET, [2H8]14,15‐EET and 17‐octadecynoic acid (17‐ODYA) were obtained from Cayman Chemical (Ann Arbor, MI, USA). 14,15‐epoxyeicosa‐5(Z)‐enoic acid (14,15‐EEZE), 14,15‐epoxyeicosa‐5(Z)‐enoic acid 2‐[2‐(3‐hydroxy‐propoxy)‐ethoxy]‐ethyl ester (14,15‐EEZE‐PEG), 14,15‐epoxyeicosa‐5(Z)‐enoic‐methylsulfonylimide (14,15‐EEZE‐mSI) and N‐methylsulfonyl‐6‐(2‐propargyloxyphenyl)hexanamide (MS‐PPOH) were synthesized in Dr Falck’s laboratory. RT2 Real‐Time SYBR Green/Fluorescein PCR Master Mix and primers for CYP2C8, CYP2C9, CYP2J2 and HPRT1 were obtained from SuperArray (Frederick, MD, USA). The primary antibody against CYP2C8/9/19 was from Millipore (Billerica, MA, USA), CYP2C9 was from Abcam Inc. (Cambridge, MA, USA) and MorphoSys US Inc. (Raleigh, NC, USA), and CYP2C8 was generously provided by Dr Capdevila (Vanderbilt University, TN, USA). Primary antibodies against Akt, phospho‐Akt (Ser473) and epidermal growth factor receptor (EGFR) were obtained from Cell Signaling Technologies (Danvers, MA, USA). Bio‐Plex Phospho‐EGFR (Tyr) Assay Kit was obtained from BioRad (Hercules, CA, USA). Goat anti‐rabbit IgG‐HRP was obtained from Zymed Laboratories (South San Francisco, CA, USA). SA‐2 human IgM antibody and FITC‐labeled anti‐human IgM were provided by Dr Williams.( 16 ) Transwell plates with filters (8‐μm pore) were obtained from Corning Inc. (Corning, NY, USA). Matrigel was obtained from BD Biosciences (Bedford, MA, USA). The ECL western blot detection kit and BCA protein assay kit were obtained from Pierce (Rockville, IL, USA). Distilled and deionized water was used in all experiments.
Cell culture. PC‐3, DU‐145 and LNCaP cells were cultured in RPMI containing fetal bovine serum (10%), l‐glutamine (1%) and penicillin/streptomycin (1%) at 37°C in 5% CO2. Cells were grown to approximately 60–70% confluency prior to all experiments except for the migration assay.
Quantitative RT‐PCR of CYP epoxygenases and HPRT1. Total RNA were extracted from cells using Trizol reagent (Invitrogen) followed by treatment with RNase‐free DNAase I. One microgram was reverse‐transcribed using oligo‐dT primers with SuperScript III First‐Strand Synthesis Kit (Invitrogen). Sample mRNA were quantified using RT2 Real‐Time SYBR Green/Fluorescein PCR Master Mix with human CYP2C8, CYP2C9, CYP2J2 and HPRT1 primers (SuperArray). The PCR cycling conditions were: 95°C for 10 min; 45 cycles at 95°C for 30 s; 55°C for 60 s; and finally at 72°C for 30 s (BioRad iCycler). The relative expression of CYP epoxygenases was normalized to HPRT1 for each cell line and compared with CYP2C9 of PC‐3 cells (the lowest expression among the prostate carcinoma cells).
Measurement of EET. Samples were added with [2H8]14,15‐EET as an internal standard, isolated by solid phase extraction, and EET were analyzed using liquid chromatography‐electrospray ionization‐mass spectrometry (LC‐ES‐MS) (Agilent 1100 LC‐MSD, SL model) as previously described.( 17 ) For quantitative measurement, m/z 319 and 327 were used for four regioisomeric EET and [2H8]14,15‐EET (internal standard), respectively. Then, EET concentrations were normalized to protein content using the BCA protein assay.
Immunofluorescence imaging of microfilaments. To examine actin‐myosin organization, cells were cultured on coverslips in 12‐well plates in complete medium for 48 h. Cells were treated with vehicle or 11,12‐EET, 14,15‐EEZE, or a combination of 11,12‐EET and 14,15‐EEZE for 90 min. Then, cells were fixed and incubated with the SA‐2 human IgM antibody to the myosin heavy chain and FITC‐ labeled anti‐human IgM as previously described.( 16 ) The cell images were captured using a Nikon Eclipse E600 fluorescence microscope (Nikon Instruments Inc., Melville, NY, USA).
Cell invasion assay. Cell invasion was determined using Boyden Chambers with Transwell inserts containing filters coated with Matrigel as previously described.( 18 , 19 ) Pharmacological agents such as 14,15‐EET, 11,12‐EET, EET antagonists (14,15‐EEZE, 14,15‐EEZE‐PEG and 14,15‐EEZE‐mSI), MS‐PPOH, miconazole, 17‐ODYA, or combinations of these agents were added to the cells during the assay. Human fibroblast (ATCC) conditioned‐media (400 μL) was added in the bottom compartment of the well as a chemoattractant. An additional six wells per treatment without Matrigel or Transwells but containing the identical number of cells and pharmacological agents were used for the “control counts” of the thymidine [methyl‐3H] (Perkin Elmer, Boston, MA, USA) to assess any changes or difference in cell numbers between control cells and pharmacologically treated cells due to cell proliferation or cell death. Cells were incubated at 37°C in an incubator for 5 h. Each treatment was repeated 2–3 times. The invasion was reported as the percentage of invasion of the control cells.
Cell migration assay. Cell migration was determined by in vitro wound healing assay as previously described.( 16 ) Cells were treated with 14,15‐EET, 11,12‐EET, 14,15‐EEZE, 14,15‐EEZE‐PEG, 14,15‐EEZE‐mSI, MS‐PPOH, miconazole, LY‐294002, AG‐494, or combinations of these pharmacological agents in serum‐free media. Photographs of the wounds were taken at 0 h and after 24 h incubation at 37°C. Each treatment was performed in three dishes and repeated in two or three separate experiments. Migration was determined by the difference (in micrometre) between the initial wound widths (0 h) and the final wound widths (24 h) and normalized to the percentage of migration of the control cells.
Cell viability. Cells were treated with the same conditions used in the invasion and migration assays and then cell viability and proliferation were determined using the trypan blue assay (Sigma Chemical)( 20 ) and/or the MTT assay (Sigma Chemical)( 21 ) to assure that the observed changes in cell migration were not from cell proliferation or cell death.
Western blot analysis. Proteins were separated on SDS‐PAGE BioRad Ready Gels (10%). Protein loading and β‐actin were used as the loading controls. Blots were incubated with primary antibodies against CYP2C8/9/19, CYP2C8, CYP2C9, p‐Akt (Ser473) (1:1000), total‐Akt (1:1000) or total‐EGFR (1:1000) followed by goat anti‐rabbit IgG‐HRP (1:3000). Total EGFR (t‐EGFR) expression was used for comparison of the p‐EGFR results obtained from the Bio‐Plex assay (see below). Detection was made by using ECL Western blotting Substrate (Pierce) and captured by Fuji film X‐ray (Tokyo, Japan). Band densities were analyzed using Image J software from the NIH.
Determination of phospho‐EGFR using Bio‐Plex phospho‐protein assay. The PC‐3 cells were treated with 11,12‐EET or 14,15 EEZE for 1, 5, 15, 30, 60 and 120 min and lysed as above. Then, p‐EGFR (Tyr) was determined using Bio‐Plex Phospho‐EGFR (Tyr) Assay Kit following the provided protocol. The EGF (0.5 ng/mL) treatment was used as an experimental positive control and the kit‐supplied samples of untreated HeLa cells were used as a negative control. Briefly, in a 96‐well plate, bead solution and sample were added and incubated at room temperature, washed, and the antibody for p‐EGFR was added and incubated at room temperature and washed. Then, Streptavidin‐PE working dilution was added, incubated, washed and Bio‐Plex Bead resuspension buffer was added. The plate was shaken for 30 s and the samples were measured on the Bio‐Plex reader. The relative fluorescence signal in each well corresponds to the relative level of p‐EGFR (Tyr).
Statistical analysis. The means of the measured values of each treatment group were compared using Student’s t‐test (two tailed). Means were considered statistically different from one another if P < 0.05.
Results
Expression of CYP epoxygenases. The relative CYP2C8, CYP2C9 and CYP2J2 mRNA in PC‐3, DU‐145 and LNCaP cells was compared with the reference HPRT1 gene.( 22 ) Then, they were normalized to the mRNA of CYP2C9 in PC‐3 cells (a relative expression of 1.00). CYP mRNA varied among cell lines. The relative expression of CYP2C8 mRNA in prostate carcinoma cells was in the order of DU‐145 > PC‐3 ≈ LNCaP cells, CYP2C9 mRNA was in the order of LNCaP > DU‐145 ≈ PC‐3 cells, and CYP2J2 mRNA was in the order of LNCaP ≈ DU‐145 > PC‐3 cells (Fig. 1A).
Figure 1.
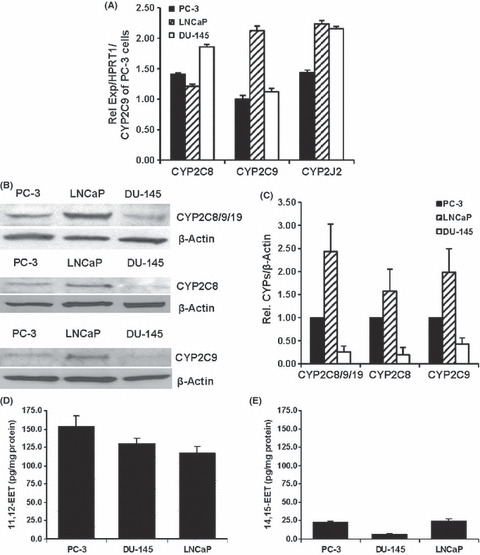
Expression of CYP2C8, 2C9 and 2J2 and concentrations of epoxyeicosatrienoic acids (EET) in human prostate carcinoma cells. (A) Relative CYP2C8, 2C9 and 2J2 mRNA normalized to HPRT1 mRNA and compared with the level of CYP2C9 mRNA in PC‐3 cells (n = 5). (B) Immunoreactive bands for CYP2C8/9/19, CYP2C8, CYP2C9 and β‐actin. (C) Immunoreactive band intensity of CYP2C8/9/19, 2C8 and 2C9 to the band intensity of β‐actin and normalized to the intensity ratio in PC‐3 cells (n = 3, 4). Concentrations of (D) 11,12‐EET and (E) 14,15‐EET in prostate carcinoma cells normalized to protein content (n = 6).
CYP2C8/9/19, CYP2C8 and CYP2C9 proteins were determined by Western blot analysis. Interestingly, the most intense immunoreactive band of CYP2C8/9/19 was observed in the LNCaP cells and decreased in PC‐3 > DU‐145 cells. Immunoreactive bands of CYP2C8 and 2C9 were also relatively higher in LNCaP cells than in PC‐3 and DU‐145 cells (Fig. 1B). The relative intensity of immunoreactive bands of CYP2C8/9/19, 2C8 and 2C9 to β‐actin in these prostate carcinoma cells was summarized (Fig. 1C). Again, the expression of proteins was normalized to the expression of that CYP epoxygenase in PC‐3 cells (a relative expression of 1.00). Primary antibody against CYP2J2 was not available for this study.
Regioisomers and concentrations of EET. In prostate carcinoma cells, 11,12‐EET was the major metabolite (Fig. 1D) and 14,15‐EET was the second most abundant isomer (Fig. 1E), while 8,9‐EET and 5,6‐EET were produced at very low or undetectable concentrations. Among prostate carcinoma cell lines, PC‐3 cells produced 11,12‐EET at higher concentrations than in DU‐145 and LNCaP cells. DU‐145 cells produced the lowest concentrations of 14,15‐EET.
Since EET can be hydrolyzed by soluble epoxide hydrolase (sEH) to their corresponding regioisomers of dihydroxyeicosatrienoic acids (DHET), the concentrations of DHET were determined by LC‐ESI‐MS( 17 ) to evaluate whether the hydrolysis of EET might contribute to the effects of EET on cell motility. Concentrations of 11,12‐DHET (hydrolytic product of 11,12‐EET) were 12.33 ± 2.55, 5.33 ± 3.11, and 11.67 ± 1.86 pg/mg protein for the PC‐3, DU‐145 and LNCaP cells, respectively, indicating that the hydrolysis of EET to DHET in these cells was low. Furthermore, exogenously added 11,12‐DHET (0.1, 1.0 and 10.0 μmol/L) did not significantly change cell invasion or migration (data not shown).
Effects of EET and inhibitors of EET synthesis on cell motility. Prostate carcinoma cells were treated with 11,12‐EET or 14,15‐EET at different concentrations during the invasion or migration assay. 11,12‐EET increased invasion and migration of PC‐3 cells in a concentration‐dependent manner (Fig. 2A). Identical results were obtained with the 14,15‐EET treatment and also in the DU‐145 and LNCaP cells (data not shown).
Figure 2.

Effects of epoxyeicosatrienoic acids (EET) and a selective cytochrome P450 (CYP) epoxygenase inhibitor on invasion and migration. (A) Effects of 11,2‐EET (0.1, 1.0 and 10.0 μmol/L) on invasion (left) and migration (right) of PC‐3 cells. (B) Effects of N‐methylsulfonyl‐6‐(2‐propargyloxyphenyl)hexanamide (MS‐PPOH) (MS[1] = 2.0 μmol/L; MS[2] = 10.0 μmol/L), and a combination of 11,12‐EET (1.0 μmol/L) and MS‐PPOH (10.0 μmol/L) on invasion (left), migration (right; MS‐PPOH = 10.0 μmol/L) and 11,12‐EET‐induced invasion/migration of PC‐3 cells (n = 9–12). (C) Effects of a selective CYP epoxygenase inhibitor on concentrations of EET. Concentrations of 11,12‐EET and 14,15‐EET in PC‐3 cells after incubation with vehicle (control) or MS‐PPOH (10.0 μmol/L) at 37°C for 30 min (n = 4). *Significantly higher than control with P < 0.01. %Significantly lower than control with P < 0.05. #Significantly lower than 11,12‐EET‐induced invasion or migration with P < 0.01.
Blocking cellular EET synthesis by a selective CYP epoxygenase inhibitor, MS‐PPOH, inhibited tonic (basal) cell invasion and migration and reduced the 11,12‐EET‐induced cell motility (Fig. 2B). In a separate experiment, PC‐3 cells were treated with MS‐PPOH (10.0 μmol/L) at 37°C for 30 min, cells were lyzed and EET were determined by LC‐ESI‐MS.( 17 ) Concentrations of 11,12‐EET and 14,15‐EET were significantly lower in the MS‐PPOH‐treated PC‐3 cells than in the control cells (Fig. 2C). Similar decreases of cell motility were observed with CYP inhibitors, miconazole and 17‐ODYA. (Invasion was reduced to 72.0 ± 8.8% and 22.6 ± 7.5% for miconazole at 10.0 and 50.0 μmol/L, respectively, and 53.5 ± 6.4% for 17‐ODYA at 10.0 μmol/L; migration was reduced to 47.5 ± 2.8% for miconazole at 30.0 μmol/L and 79.9 ± 7.0% for a combination of miconazole at 30.0 μmol/L and 11,12‐EET at 1.0 μmol/L.) These results indicate that endogenously produced EET mediate a tonic motility of prostate carcinoma cells and the blockade of EET synthesis reduces tonic motility.
Effects of the inhibition of EGFR kinase and phospha‐tidylinositol 3‐kinase (PI3K) on cell motility. To determine the effects of inhibition of EGFR kinase on cell migration, PC‐3 cells were treated with an EGFR kinase inhibitor, AG‐494, during the migration assay. AG494 inhibited cell migration and also reduced EET‐induced cell migration (Fig. 3A). These results suggest that EET stimulates cell migration, possibly through the trans‐activation of EGFR.
Figure 3.

Effects of an epidermal growth factor receptor (EGFR) kinase inhibitor and a PI3 kinase inhibitor on invasion and migration. (A) Effects of AG‐494 (AG[1] = 10.0 μmol/L; AG[2] = 20.0 μmol/L) on migration and 11,12‐epoxyeicosatrienoic acid (11,12‐EET)‐induced migration of PC‐3 cells. (B) Effects of LY294002 (LY[1] = 20.0 μmol/L; LY[2] = 50.0 μmol/L) on migration and 11,12‐EET‐induced migration of PC‐3 cells. (n = 9–12). *Significantly higher than control with P < 0.01. %Significantly lower than control with P < 0.01. #Significantly lower than 11,12‐EET‐induced invasion or migration with P < 0.01.
To determine the effect of inhibition of phosphatidylinositol 3‐kinase (PI3K) on cell migration, PC‐3 cells were treated with a PI3K inhibitor, LY294002, during the migration assay. LY294002 inhibited cell migration and also reduced 11,12‐EET‐induced migration of PC‐3 cells (Fig. 3B). These results suggest that the actions of EET on cell motility might involve activation of the PI3K/Akt pathway.
Cell morphology and myosin microfilament organization. To determine the changes in cell shapes and organization of actin/myosin microfilaments, PC‐3 cells were treated with 11,12‐EET, 14,15‐EEZE, or a combination of 11,12‐EET and 14,15‐EEZE for 90 min. The cells were then fixed and stained for myosin heavy chain( 16 ) (Fig. 4A). Myosin‐containing stress fibers were present in the control PC‐3 cells (Fig. 4A, panel a), indicating an association between myosin and actin. 11,12‐EET induced the cells to stretch out and exhibit more apparent myosin microfilaments (Fig. 4A, panel b), indicating increased myosin‐actin association. However, 14,15‐EEZE diminished myosin‐containing stress fibers (Fig. 4A, panel c), indicating a lack of myosin‐actin association. 14,15‐EEZE also induced significant changes in the cell shape to become rounded and smaller. Furthermore, 14,15‐EEZE reduced the effects of 11,12‐EET‐induced cell stretching and myosin‐actin association (Fig. 4A, panel d). Cells were viable under these treatments.
Figure 4.

Cell morphology, invasion and migration induced by epoxyeicosatrienoic acid (EET) and EET antagonists. (A) Fluorescence images depicting actin‐myosin organization in PC‐3 cells treated with (a) vehicle, (b) 11,12‐EET (1.0 μmol/L), (c) 14,15‐epoxyeicosa‐5(Z)‐enoic acid (14,15‐EEZE) (5.0 μmol/L) and (d) 11,12‐EET and 14,15‐EEZE for 90 min at 37°C. (B) Examples of effects of 11,12‐EET (1.0 μmol/L), 14,15‐EEZE (5.0 μmol/L), and a combination of 11,12‐EET and 14,15‐EEZE on wound closures of PC‐3 cells at 37°C. (C) Effects of EET antagonists, 14,15‐EEZE (A, 5.0 μmol/L), 14,15‐EEZE‐PEG (B, 5.0 μmol/L), 14,15‐epoxyeicosa‐5(Z)‐enoic‐methylsulfonylimide (14,15‐EEZE‐mSI) (C, 5.0 μmol/L), and combinations of these antagonists and 11,12‐EET (E, 1.0 μmol/L) on invasion of PC‐3 cells (n = 12–18). (D) Effects of EET antagonists and combinations of these antagonists and 11,12‐EET (E, 1.0 μmol/L) on migration of PC‐3 cells (n = 9–12). *Significantly higher than control with P < 0.01. %Significantly lower than control with P < 0.05. #Significantly lower than 11,12‐EET‐induced invasion or migration with P < 0.01.
Effects of putative EET receptor antagonists on cell invasion and migration. To determine the effects of synthetic EET antagonists on cell invasion and migration, PC‐3 cells were treated with 14,15‐EEZE, 14,15‐EEZE‐PEG, 14,15‐EEZE‐mSI, 11,12‐EET, and combinations of these EET antagonists and 11,12‐EET during the invasion and migration assays. 11,12‐EET stimulated but 14,15‐EEZE blocked the migration of PC‐3 cells (Fig. 4B). The EET antagonists alone inhibited tonic invasion and migration and blocked the 11,12‐EET‐induced cell invasion/migration of PC‐3 cells (Fig. 4C,D). The effects of 11,12‐EET and 14,15‐EEZE on migration in DU‐145 and LNCaP cells were similar to PC‐3 cells (data not shown). These results further indicate that EET stimulate cell motility possibly through the interaction of EET with a putative binding protein/receptor(s) and the activity is blocked by the synthetic EET receptor antagonists.
Effects of 11,12‐EET and EET antagonist on the activation of EGFR. The activation of EGFR by 11,12‐EET and 14,15‐EEZE in PC‐3 cells was determined by measuring p‐EGFR (Tyr) using a Bio‐Plex assay. 11,12‐EET activated EGFR in a time‐dependent manner as indicated by the fluorescence signal that represents the level of p‐EGFR (Tyr). Total EGFR for each time point was determined by Western blot analysis and used for normalizing p‐EGFR (Fig. 5A). Vehicle‐treated cells were examined at two time points of 1 and 120 min. The EET treatment of cells increased p‐EGFR over time with maximal activation at 5 min, and the activated EGFR decreased to the control level after 60 min.
Figure 5.

Activation and inhibition of epidermal growth factor receptor (EGFR) and Akt by epoxyeicosatrienoic acid (EET) and EET antagonists. (A) Effects of 11,12‐EET (1.0 μmol/L) on phosphorylated EGFR (p‐EGFR) (Tyr) in PC‐3 cells as determined by Bio‐Plex Phospho‐EGFR (Tyr) Assay Kit and normalized to total EGFR (t‐EGFR) (by western blot) at different times and control cells at 1 min and 120 min (n = 3). (B) Effects of 11,12‐EET (1.0 μmol/L), 14,15‐epoxyeicosa‐5(Z)‐enoic acid (14,15‐EEZE) (5.0 μmol/L), and a combination of 11,12‐EET and 14,15‐EEZE on p‐EGFR (Tyr) at 5 min treatment and normalized to the control (n = 3). *Significantly higher than control with P < 0.01. %Significantly lower than the control with P < 0.01. #Significantly lower than 11,12‐EET‐activated EGFR with P < 0.01. (C) Example of the effects of 11,12‐EET (1.0 μmol/L) on p‐Akt (Ser473) in PC‐3 cells at different times. Below the figure is the average of the p‐Akt band intensity to t‐Akt at each time point (n = 4). (D) Example of the effects of 11,12‐EET (1.0 μmol/L), 14,15‐EEZE (5.0 μmol/L), and a combination of 11,12‐EET and 14,15‐EEZE on p‐Akt (Ser473) at 60 min treatment. Below the figure is the average of the relative (p‐Akt/t‐Akt) in PC‐3 cells treated with 11,12‐EET and 14,15‐EEZE as normalized to the control cells (n = 4). *Significantly higher than control with P < 0.01. %Significantly lower than the control with P < 0.05. #Significantly lower than 11,12‐EET‐activated Akt with P < 0.01.
The PC‐3 cells were treated with 11,12‐EET, 14,15‐EEZE, and a combination of 11,12‐EET and 14,15‐EEZE for 5 min, and p‐EGFR was determined by Bio‐Plex assay. Again, 11,12‐EET increased p‐EGFR but 14,15‐EEZE decreased p‐EGFR and it also blocked the activation of EGFR by 11,12‐EET (Fig. 5B).
Effects of 11,12‐EET and EET antagonist on the activation of PI3K/Akt. The PC‐3 cells were treated with 11,12‐EET at various times and p‐Akt (p‐Ser473) and t‐Akt were determined by Western blot analysis. The immunoreactive band ratio of p‐Akt to t‐Akt indicated that 11,12‐EET activated Akt as a function of time with maximal activation at approximately 30–60 min (Fig. 5C). 11,12‐EET also activated Akt in the LNCaP cells with maximal activation at approximately 60 min, similar to the PC‐3 cells (data not shown). The PC‐3 cells were treated with 11,12‐EET, 14,15‐EEZE, and a combination of 14,15‐EEZE and 11,12‐EET for 60 min and p‐Akt (p‐Ser473) was measured by Western blot analysis. 11,12‐EET activated Akt but 14,15‐EEZE inhibited the phosphorylation of Akt and it also blocked EET‐activated Akt (Fig. 5D).
Discussion
Prostate carcinoma (PC‐3, DU‐145 and LNCaP) cells have differential expression of CYP mRNA and proteins. Interestingly, the mRNA expression, protein expression and EET concentrations in these cells did not appear to have obvious correlations. For example, LNCaP cells had the highest mRNA of CYP2C9 and 2J2 and the highest immunoreactive bands for CYP2C8, 2C9 and 2C8/9/19 among the prostate carcinoma cells. However, PC‐3 cells, but not LNCaP cells, had the highest endogenous 11,12‐EET concentrations (Fig. 1C). These results suggest that PC‐3 cells might have higher epoxygenase activity or may express other CYP epoxygenases. Since CYP2J2 mRNA was detected, it is possible that these carcinoma cells express CYP2J2 protein; although a previous study did not detect CYP2J2 in prostate adenocarcinoma tissues.( 13 ) In addition to these three well‐characterized CYP epoxygenases, the synthesis of EET by other CYP epoxygenases( 1 , 23 ) in prostate carcinoma cells cannot be ruled out.
Although EET stimulate migration and invasion of various cell types( 14 ) including some carcinoma cell lines,( 15 ) the mechanisms underlying these effects are not fully understood. The EET‐induced changes in actin‐myosin microfilaments suggest that EET may stimulate a variety of signaling pathways including activation of the EGFR and PI3/Akt pathways.( 24 , 25 ) Activation of EGFR by the cross‐talk with other ligand‐activated G‐protein‐coupled receptors has been documented.( 26 ) Previous studies on EET and EET antagonists suggest that EET may bind to putative binding protein or receptor(s),( 7 , 8 ) which may trans‐activate EGFR and Akt in the regulation of cell motility.( 6 , 27 , 28 ) A protein tyrosine kinase (PTK) inhibitor, AG‐494, inhibited cell migration and reduced EET‐activated cell migration similar to other PTK inhibitors, genistein and tyrphostin AG‐1478.( 29 ) A PI3K inhibitor, LY294002, also inhibited prostate carcinoma cell migration and reduced EET‐activated cell migration. These results suggest that EET possibly transactivate EGFR and the subsequent PI3K/Akt pathways to stimulate motility of prostate carcinoma cells.
11,12‐EET induced PC‐3 cells to stretch out and form more apparent actin‐myosin microfilaments. Conversely, 14,15‐EEZE diminished myosin‐containing microfilaments, indicating that the cells had decreased myosin‐actin association. Furthermore, 14,15‐EEZE induced significant morphological changes that caused the cells to become more rounded and smaller. The cytoskeletal changes suggest that 11,12‐EET may induce cell motility while EET antagonists such as 14,15‐EEZE may block cell motility and reduce the effects of EET.
Importantly, synthetic EET antagonists, 14,15‐EEZE, 14,15‐EEZE‐PEG and 14,15‐EEZE‐mSI diminished tonic invasion/migration and reduced 11,12‐EET‐induced cell motility. These results indicate that EET are endogenous stimulators of prostate carcinoma cell motility and EET antagonists inhibit the actions of endogenous EET, suggesting the activation/deactivation of putative EET‐binding protein or receptor(s).( 7 , 8 ) The EET antagonists reduced the EET‐activated phosphorylation of EGFR and Akt. Taken together, these results indicate that EET antagonists inhibit motility of prostate carcinoma cells, possibly through the antagonism of putative EET receptor‐mediated EGFR activation and the subsequent PI3K/Akt pathways, as summarized in the proposed diagram in Figure 6. These synthetic EET antagonists exhibit a therapeutic potential for prostate cancer.
Figure 6.

A proposed diagram of the signaling pathway for epoxy‐eicosatrienoic acid (EET)‐mediated prostate carcinoma cell motility. In this proposed signaling pathway, EET bind to a putative EETR to activate MMP and cleave pro‐HB‐EGF to HB‐EGF. Then, HB‐EGF activates EGFR( 30 , 31 ) and initiates a signaling cascade to activate the PI3K/Akt pathway to increase cell motility. An unidentified mechanism of EET‐activated EETR to activate the PI3K/Akt signaling pathway( 32 ) cannot be ruled out. EETR, putative EET receptor; EEZE, EET antagonists; EGFR, epidermal growth factor receptor; HB‐EGF, heparin‐binding EGF‐like growth factor; MMP, matrix metalloproteinases; PI3K/Akt, phos‐phatidylinositol 3‐kinase/Akt signaling pathway; Pro, Pro‐HB‐EGF.
Disclosure Statement
The authors have no conflict of interest.
Acknowledgments
The authors thank Ana Doris Gomez‐Granados, Marilyn Isbell and Michael Endsley for their technical assistance. This work was supported by the Wisconsin Breast Cancer Showhouse, the Cancer Center of the Medical College of Wisconsin, the National Institutes of Health (HL‐51055, GM‐31278, GM‐069700, and CA‐136799) and The Robert A. Welch Foundation.
References
- 1. Rifkind AB, Lee C, Chang TK et al. Arachidonic acid metabolism by human cytochrome P450s 2C8, 2C9, 2E1, and 1A2: regioselective oxygenation and evidence for a role for CYP2C enzymes in arachidonic acid epoxygenation in human liver microsomes. Arch Biochem Biophys 1995; 320: 380–9. [DOI] [PubMed] [Google Scholar]
- 2. Lundblad MS, Stark K, Eliasson E et al. Biosynthesis of epoxyeicosatrienoic acids varies between polymorphic CYP2C enzymes. Biochem Biophys Res Commun 2005; 327: 1052–7. [DOI] [PubMed] [Google Scholar]
- 3. Imaoka S, Hashizume T, Funae Y. Localization of rat cytochrome P450 in various tissues and comparison of arachidonic acid metabolism by rat P450 with that by human P450 orthologs. Drug Metab Pharmacokinet 2005; 20: 478–84. [DOI] [PubMed] [Google Scholar]
- 4. Nishimura M, Yaguti H, Yoshitsugu H et al. Tissue distribution of mRNA expression of human cytochrome P450 isoforms assessed by high‐sensitivity real‐time reverse transcription PCR. Yakugaku Zasshi 2003; 123: 369–75. [DOI] [PubMed] [Google Scholar]
- 5. Michaelis UR, Fisslthaler B, Barbosa‐Sicard E et al. Cytochrome P450 epoxygenases 2C8 and 2C9 are implicated in hypoxia‐induced endothelial cell migration and angiogenesis. J Cell Sci 2005; 118: 5489–98. [DOI] [PubMed] [Google Scholar]
- 6. Wang Y, Wei X, Xiao X et al. Arachidonic acid epoxygenase metabolites stimulate endothelial cell growth and angiogenesis via mitogen‐activated protein kinase and phosphatidylinositol 3‐kinase/Akt signaling pathways. J Pharmacol Exp Ther 2005; 314: 522–32. [DOI] [PubMed] [Google Scholar]
- 7. Yang W, Tuniki VR, Anjaiah S et al. Characterization of epoxyeicosatrienoic acid binding site in U937 membranes using a novel radiolabeled agonist, 20‐125i‐14,15‐epoxyeicosa‐8(Z)‐enoic acid. J Pharmacol Exp Ther 2008; 324: 1019–27. [DOI] [PubMed] [Google Scholar]
- 8. Yang W, Holmes BB, Gopal VR et al. Characterization of 14,15‐epoxyeicosatrienoyl‐sulfonamides as 14,15‐epoxyeicosatrienoic acid agonists: use for studies of metabolism and ligand binding. J Pharmacol Exp Ther 2007; 321: 1023–31. [DOI] [PubMed] [Google Scholar]
- 9. Gauthier KM, Jagadeesh SG, Falck JR et al. 14,15‐epoxyeicosa‐5(Z)‐enoic‐mSI: a 14,15‐ and 5,6‐EET antagonist in bovine coronary arteries. Hypertension 2003; 42: 555–61. [DOI] [PubMed] [Google Scholar]
- 10. Gauthier KM, Deeter C, Krishna UM et al. 14,15‐Epoxyeicosa‐5(Z)‐enoic acid: a selective epoxyeicosatrienoic acid antagonist that inhibits endothelium‐dependent hyperpolarization and relaxation in coronary arteries. Circ Res 2002; 90: 1028–36. [DOI] [PubMed] [Google Scholar]
- 11. Ragavan N, Hewitt R, Cooper LJ et al. CYP1B1 expression in prostate is higher in the peripheral than in the transition zone. Cancer Lett 2004; 215: 69–78. [DOI] [PubMed] [Google Scholar]
- 12. Yokose T, Doy M, Taniguchi T et al. Immunohistochemical study of cytochrome P450 2C and 3A in human non‐neoplastic and neoplastic tissues. Virchows Arch 1999; 434: 401–11. [DOI] [PubMed] [Google Scholar]
- 13. Enayetallah AE, French RA, Grant DF. Distribution of soluble epoxide hydrolase, cytochrome P450 2C8, 2C9 and 2J2 in human malignant neoplasms. J Mol Histol 2006; 37: 133–41. [DOI] [PubMed] [Google Scholar]
- 14. Michaelis UR, Xia N, Barbosa‐Sicard E et al. Role of cytochrome P450 2C epoxygenases in hypoxia‐induced cell migration and angiogenesis in retinal endothelial cells. Invest Ophthalmol Vis Sci 2008; 49: 1242–7. [DOI] [PubMed] [Google Scholar]
- 15. Jiang JG, Ning YG, Chen C et al. Cytochrome p450 epoxygenase promotes human cancer metastasis. Cancer Res 2007; 67: 6665–74. [DOI] [PubMed] [Google Scholar]
- 16. Tew GW, Lorimer EL, Berg TJ et al. SmgGDS regulates cell proliferation, migration, and NF‐{kappa}B transcriptional activity in non‐small cell lung carcinoma. J Biol Chem 2008; 283: 963–76. [DOI] [PubMed] [Google Scholar]
- 17. Nithipatikom K, Grall AJ, Holmes BB et al. Liquid chromatographic‐electrospray ionization‐mass spectrometric analysis of cytochrome P450 metabolites of arachidonic acid. Anal Biochem 2001; 298: 327–36. [DOI] [PubMed] [Google Scholar]
- 18. Nithipatikom K, Endsley MP, Isbell MA et al. 2‐Arachidonoylglycerol: a novel inhibitor of androgen‐independent prostate cancer cell invasion. Cancer Res 2004; 64: 8826–30. [DOI] [PubMed] [Google Scholar]
- 19. Endsley MP, Aggarwal N, Isbell MA et al. Diverse roles of 2‐arachidonoylglycerol in invasion of prostate carcinoma cells: location, hydrolysis and 12‐lipoxygenase metabolism. Int J Cancer 2007; 121: 984–91. [DOI] [PMC free article] [PubMed] [Google Scholar]
- 20. Mimeault M, Pommery N, Wattez N et al. Anti‐proliferative and apoptotic effects of anandamide in human prostatic cancer cell lines: implication of epidermal growth factor receptor down‐regulation and ceramide production. Prostate 2003; 56: 1–12. [DOI] [PubMed] [Google Scholar]
- 21. Yang P, Collin P, Madden T et al. Inhibition of proliferation of PC3 cells by the branched‐chain fatty acid, 12‐methyltetradecanoic acid, is associated with inhibition of 5‐lipoxygenase. Prostate 2003; 55: 281–91. [DOI] [PubMed] [Google Scholar]
- 22. Ohl F, Jung M, Xu C et al. Gene expression studies in prostate cancer tissue: which reference gene should be selected for normalization? J Mol Med 2005; 83: 1014–24. [DOI] [PubMed] [Google Scholar]
- 23. Choudhary D, Jansson I, Stoilov I et al. Metabolism of retinoids and arachidonic acid by human and mouse cytochrome P450 1b1. Drug Metab Dispos 2004; 32: 840–7. [DOI] [PubMed] [Google Scholar]
- 24. Zhou W, Grandis JR, Wells A. STAT3 is required but not sufficient for EGF receptor‐mediated migration and invasion of human prostate carcinoma cell lines. Br J Cancer 2006; 95: 164–71. [DOI] [PMC free article] [PubMed] [Google Scholar]
- 25. Marcoux N, Vuori K. EGF receptor activity is essential for adhesion‐induced stress fiber formation and cofilin phosphorylation. Cell Signal 2005; 17: 1449–55. [DOI] [PubMed] [Google Scholar]
- 26. Schwartz MA, Baron V. Interactions between mitogenic stimuli, or, a thousand and one connections. Curr Opin Cell Biol 1999; 11: 197–202. [DOI] [PubMed] [Google Scholar]
- 27. Jiang JG, Chen CL, Card JW et al. Cytochrome P450 2J2 promotes the neoplastic phenotype of carcinoma cells and is up‐regulated in human tumors. Cancer Res 2005; 65: 4707–15. [DOI] [PubMed] [Google Scholar]
- 28. Zhang B, Cao H, Rao GN. Fibroblast growth factor‐2 is a downstream mediator of phosphatidylinositol 3‐kinase‐Akt signaling in 14,15‐epoxyeicosatrienoic acid‐induced angiogenesis. J Biol Chem 2006; 281: 905–14. [DOI] [PubMed] [Google Scholar]
- 29. Skogseth H, Larsson E, Halgunset J. The invasive behaviour of prostatic cancer cells is suppressed by inhibitors of tyrosine kinase. Apmis 2006; 114: 61–6. [DOI] [PubMed] [Google Scholar]
- 30. Chen JK, Capdevila J, Harris RC. Heparin‐binding EGF‐like growth factor mediates the biological effects of P450 arachidonate epoxygenase metabolites in epithelial cells. Proc Natl Acad Sci U S A 2002; 99: 6029–34. [DOI] [PMC free article] [PubMed] [Google Scholar]
- 31. Cheng LM, Jiang JG, Sun ZY et al. The epoxyeicosatrienoic acid‐stimulated phosphorylation of EGF‐R involves the activation of metalloproteinases and the release of HB‐EGF in cancer cells. Acta Pharmacol Sin 2010; 31: 211–8. [DOI] [PMC free article] [PubMed] [Google Scholar]
- 32. Dhanasekaran A, Gruenloh SK, Buonaccorsi JN et al. Multiple antiapoptotic targets of the PI3K/Akt survival pathway are activated by epoxy‐eicosatrienoic acids to protect cardiomyocytes from hypoxia/anoxia. Am J Physiol Heart Circ Physiol 2008; 294: H724–35. [DOI] [PMC free article] [PubMed] [Google Scholar]