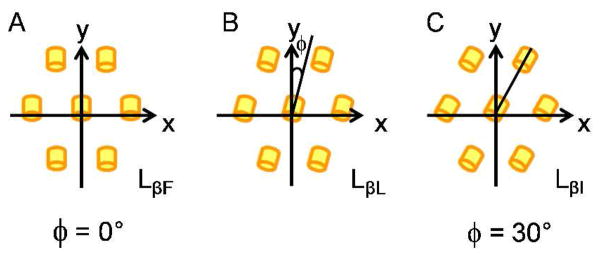
Figure 7.
Schematic illustration of the relative orientation of the tilted lipid tails in the three phases comprised by the Lβ′ phase. Yellow cylinders represent the in-plane projections of the lipid tails. The phases differ in the azimuthal angle (φ) as shown. For the LβF and the LβI phase with φ = 0° (A) and φ = 30° (C), respectively, there is a reflection symmetry about the tilt direction. In LβL phase (B) the reflection symmetry about the tilt direction is broken. Adapted from Smith et al.42

