

Abstract
Background & Aims
A limited number of genetic risk factors have been reported in primary sclerosing cholangitis (PSC). To discover further genetic susceptibility factors for PSC, we followed up on a second tier of single nucleotide polymorphisms (SNPs) from a genome-wide association study (GWAS).
Methods
We analyzed 45 SNPs in 1221 PSC cases and 3508 controls. The association results from the replication analysis and the original GWAS (715 PSC cases and 2962 controls) were combined in a meta-analysis comprising 1936 PSC cases and 6470 controls. We performed an analysis of bile microbial community composition in 39 PSC patients by 16S rRNA sequencing.
Results
Seventeen SNPs representing 12 distinct genetic loci achieved nominal significance (Preplication<0.05) in the replication. The most robust novel association was detected at chromosome 1p36 (rs3748816; Pcombined=2.1×10⁻⁸) where the MMEL1 and TNFRSF14 genes represent potential disease genes. Eight additional novel loci showed suggestive evidence of association (Prepl<0.05). FUT2 at chromosome 19q13 (rs602662; Pcomb=1.9×10⁻⁶, rs281377; Pcomb = 2.1×10⁻⁶ and rs601338; Pcomb=2.7×10⁻⁶) is notable due to its implication in altered susceptibility to infectious agents. We found that FUT2 secretor status and genotype defined by rs601338 significantly influences biliary microbial community composition in PSC patients.
Conclusions
We identify multiple new PSC risk loci by extended analysis of a PSC GWAS. FUT2 genotype needs to be taken into account when assessing the influence from microbiota on biliary pathology in PSC.
Keywords: primary sclerosing cholangitis, genome-wide association study, single nucleotide polymorphism, immunogenetics
Introduction
Primary sclerosing cholangitis (PSC) is a chronic cholestatic liver disease of unknown etiology, characterized by progressive inflammation and fibrosis of the bile ducts leading to liver cirrhosis in many cases [1]. An important clinical feature of PSC is the frequent autoimmune manifestations in other organ systems, most commonly inflammatory bowel disease (IBD), which is reported in 62–83% of PSC patients of Northern European decent [1]. In addition, approximately 25% of PSC patients are affected by at least one autoimmune disease outside the liver and colon [2], most commonly type 1 diabetes, thyroid disease, rheumatoid arthritis and psoriasis. Shared genetic susceptibility could potentially explain the frequent occurrence of these immune-related co-morbidities in PSC.
The importance of genetic risk factors in PSC is demonstrated by heritability studies estimating siblings of PSC patients to be 9–39 times more likely to develop PSC than the general population [1]. The contribution of genetic variants in the HLA complex on chromosome 6p21 to the risk of PSC is well established [1]. Previously, strong evidence for associated risk factors outside of the HLA region has been reported at chromosome 3p21 in MST1 and chromosome 2q13 near BCL2L11 [3]. In addition, suggestive PSC associations have been reported at six additional loci harboring the likely susceptibility genes GPBAR1, IL2RA, GPC5/GPC6, IL2/IL21, CARD9 and REL [3–6]. In the most recent PSC GWAS [3], only the top 23 associated regions were selected for replication genotyping.
Replication attempts of promising, but lower ranked markers from GWAS have yielded valuable findings in multiple other diseases, and have been particularly fruitful when combined with a semi-hypothesis driven approach taking into consideration gene content and potential biological relevance [7]. In an attempt to identify novel susceptibility loci in PSC, we selected a second tier of promising associated markers from an available PSC GWAS [3] for replication in an independent cohort.
Materials and Methods
Study Subjects
The discovery panel included a total of 715 PSC cases and 2962 healthy controls, with 332 PSC cases and 262 controls from Scandinavia, and 383 PSC cases and 2700 controls from Germany [3]. The replication panel consisted of a total of 1221 PSC cases and 3508 controls, with 289 PSC cases and 820 controls from Scandinavia, 561 PSC patients and 2063 controls from Central Europe, and 371 PSC cases and 625 controls from the United States (US). The recruitment of study subjects is described in detail in the Supplementary Methods in the Supplementary Material.
Written informed consent was obtained from all study participants. The study conforms to the ethical guidelines of the 1975 Declaration of Helsinki and was approved by the South-Eastern Norwegian Regional Ethics Committee (S-93178 and S-08872b).
Association Analysis of Genome-Wide Data
Genome-wide genotyping, imputation and quality control in the discovery panel are described in the Supplementary Methods. Association analysis of the genotyped and imputed SNPs in the discovery panel was performed using a logistic regression procedure implemented in the R statistical package version 2.9.1 (http://www.r-project.org). The six first principal components generated by the EIGENSTRAT software [8] after removal of population outliers were included as covariates in the regression to correct for residual population structure.
Selection of SNPs for Extended Replication
A total of 2,466,182 SNPs were included in the association analysis of the GWAS dataset. All nominally associated SNPs (P-value<0.05) outside the HLA complex (defined as position 25 to 35 million base pairs on chromosome 6p21) which had previously not been subjected to replication genotyping, were considered potential candidates for replication. We aimed to integrate a priori knowledge on disease mechanisms in PSC and genetic susceptibility factors for related conditions and traits by implementing two SNP prioritization strategies for replication genotyping.
Strategy I
All non-HLA SNPs with a GWAS P-value (PGWAS)<0.05 (n=134,466) were aligned with SNPs reported to be associated in immune-mediated and chronic inflammatory diseases and relevant biochemical parameters as listed in the Catalog of Genome-Wide Association Studies (http://www.genome.gov/26525384) (accessed 23.04.2010) Supplementary Table 2 lists the phenotypes taken into consideration.
Strategy II
Genetic loci harboring SNPs with robust statistical evidence of association in the GWAS (PGWAS<1.0 ×10⁻⁴) underwent literature-based assessment taking potential pathogenetic mechanisms in PSC into account [1]. Before this assessment, the number of candidate SNPs with a PGWAS<1.0 ×10⁻⁴ were reduced by applying a linkage disequilibrium (LD) clumping threshold of r2=0.8 and distance=50kb in PLINK version 1.06 [9] using LD measurements from the HapMap project.
To further avoid redundant genotyping, the total number of SNPs selected with strategies I and II were clumped using a LD clumping threshold of r2=0.8 and distance=2000kb in PLINK version 1.06 [9]. In FUT2, two redundant coding SNPs (rs601338 and rs281377) were purposely retained. In addition, a tag (rs4143332, r2=1.0, D′=1.0) for the most strongly associated SNP (rs3134792) in HLA-B was included. If assay design was not possible for the index SNPs from the clumping, SNPs identified to be in LD with the SNP in the clumping procedure were used instead.
Association Analysis of Replication Data and Meta-analysis
Replication genotyping and quality control are described in in the Supplementary Methods. Association analysis in the three replication panels was performed by the Cochran-Mantel-Haenszel (CMH) test as implemented in the PLINK version 1.06 [9]. Along with the CMH test a Breslow-Day (BD) test for heterogeneity of odds ratios was performed. Meta-analysis of the summary statistics in the discovery and replication panels was performed using the Meta-Analysis Tool for genome-wide association scans, METAL (http://www.sph.umich.edu/csg/abecasis/Metal) (version released 2010-08-01) (see Supplementary Methods for details).
To adjust for multiple testing in the replication a strict Bonferroni correction was applied assuming independence between the 45 SNPs analyzed (Bonferroni-adjusted P-value threshold at 0.05/45=0.0011).
Association Signal Plots, Linkage Disequilibrium Calculations and Pathway Analysis
Regional association plots were generated from the GWAS data using the LocusZoom software (see Supplementary Methods) [10]. For all other LD calculations data from the HapMap project and PLINK version 1.06 [9] were used. To examine the functional relationship among genomic PSC risk regions, we performed a Gene Relationships Across Implicated Loci (GRAIL) pathway analysis (http://www.broadinstitute.org/mpg/grail/) (see Supplementary Methods).
Biliary FUT2 Phenotyping, FUT2 sequence alignment and Profiling of Biliary Microbiota Composition
To demonstrate presence of FUT2 in the bile duct epithelium, immunostaining for the α(1,2)fucose-specific lectin Ulex europaeus agglutinin-I was performed. The biliary FUT2 phenotyping is described in detail in the Supplementary Methods. Sequence alignment of human FUT2 with a range of different species was performed to evaluate evolutionary conservation (see figure legend to Supplementary Figure 2). A fragment of the 16S rRNA gene spanning the V1 and V2 hypervariable regions was amplified from processed bile samples of PSC patients and sequenced using 454 GS-FLX Titanium sequencing chemistry as described [11] (see Supplementary Methods).
Results
SNP Selection and Genotyping Results
Seven hundred and fifteen PSC patients and 2962 controls were successfully genotyped and analyzed in the GWAS (Table 1). Among the total of 2,466,182 genotyped and imputed SNPs analyzed, a subset of 59 SNPs were selected for follow-up; 37 SNPs based on SNP selection strategy I and 22 SNPs based on SNP selection strategy II. Following quality pruning of the replication dataset a total of 45 SNPs were included in the association analysis.
Table 1.
Clinical characteristics of the PSC patients included in the study.
| Genome-wide analysis | Replication analysis | ||||
|---|---|---|---|---|---|
| Scandinavian | German | Scandinavian | Central European | United States | |
| Number of PSC patients | 332 | 383 | 289 | 561 | 371 |
| Median age at diagnosis (range) | 34 (10–76) | 32 (9–76) | 37 (12–74) | 35 (2–81) | 41 (8–77) |
| Male patients (%) | 241 (73%) | 259 (69%) | 199 (70%) | 354 (64%) | 239 (64%) |
| IBD data available for (n) patients | 331 | 364 | 249 | 544 | 329 |
| IBD (%) | 260 (79%) | 245 (67%) | 196 (79%) | 347 (64%) | 262 (80%) |
| IBD subtype | |||||
| Ulcerative Colitis (%) | 64% | 51% | 66% | 47% | 66% |
| Crohn’s disease (%) | 10% | 10% | 8% | 13% | 8% |
| IBD unclassified (%) | 4% | 7% | 5% | 4% | 6% |
| CCA data available for (n) patients | 330 | 375 | 243 | 461 | 329 |
| CCA diagnosed (%) | 35 (11%) | 10 (3%) | 27 (11%) | 28 (6.1%) | 27 (8%) |
Clinical characteristics of the patients included in the study stratified according to study panel in the genome-wide analysis or the replication analysis.
IBD, inflammatory bowel disease; CCA, cholangiocarcinoma
Association Results
A total of 17 SNPs achieved nominal significance in the replication (Prepl<0.05) and demonstrated effect sizes in the same direction as observed in the discovery cohort (Table 2). Results for the additional 28 SNPs studied are provided in Supplementary Table 1. The associated SNPs implicate 12 genetic loci, 9 of which had not previously been reported to be associated with PSC. The association results for SNPs with nominally significant replication with same direction of effect were homogenous (PHETEROGENEITY (HET)>0.05) when the GWAS discovery and replication cohorts were compared, except for one marker (rs11936230). Within the three panels constituting the replication cohort the significant association results were also largely homogenous, however 2 markers (rs11682163 and rs281377) had a significant Breslow-Day test implying heterogeneity of odds ratios inbetween the three panels for these SNPs. Four SNPs at MMEL1/TNFRSF14, IL2/IL21 and CARD9 demonstrated association results robust to correction for multiple testing using Bonferroni’s method (P<0.0011) in the replication analysis (Table 2).
Table 2.
Allele frequencies and results from the association analyses for SNPs with association results reaching nominal significance with consistent effect sizes in the replication.
| Genome-wide analysis | Replication analysis | ||||||||||||||||
|---|---|---|---|---|---|---|---|---|---|---|---|---|---|---|---|---|---|
| Allele frequencies (Cases/Controls) | Allele frequencies (Cases/Controls) | ||||||||||||||||
| Chr | SNP | Position | Locus | Al | Scandinavia (332/262) |
Germany (383/2700) |
P-value* | OR (95% CI)* | Scandinavia (289/820) |
Central Europe (561/2063) |
United States (371/625) |
P -value† | OR (95% CI) † | BD P value |
Combined P -value |
Het P- Value |
SNP selection strategy |
| 1 | rs3748816 | 2,516,606 | TNFRSF14/MMEL1 | G/A | 0.29/0.34 | 0.28/0.33 | 6.5×10⁻⁴ | 0.79 (0.69–0.90) | 0.31/0.35 | 0.30/0.34 | 0.27/0.35 | 8.7×10⁻⁶ | 0.79 (0.71–0.88) | 0.45 | 2.1×10⁻⁸ | 0.92 | I |
| 4 | rs13132245 | 123,269,042 | KIAA1109/IL2/IL21 | G/A | 0.16/0.21 | 0.12/0.17 | 7.3×10⁻⁵ | 0.69 (0.57–0.83) | 0.13/0.18 | 0.12/0.14 | 0.12/0.15 | 3.0×10⁻⁴ | 0.77 (0.67–0.89) | 0.65 | 1.2×10⁻⁷ | 0.40 | II |
| 4 | rs13119723 | 123,437,763 | KIAA1109/IL2/IL21 | G/A | 0.13/0.18 | 0.09/0.14 | 4.1×10⁻⁵ | 0.65 (0.53–0.80) | 0.15/0.19 | 0.13/0.15 | 0.12/0.16 | 4.0×10⁻⁴ | 0.78 (0.68–0.90) | 0.87 | 9.9×10⁻⁸ | 0.32 | II |
| 9 | rs4077515 | 138,386,317 | CARD9 | T/C | 0.48/0.45 | 0.43/0.40 | 0.045 | 1.14 (1.00–1.31) | 0.49/0.45 | 0.47/0.42 | 0.45/0.42 | 5.3×10⁻⁴ | 1.18 (1.08–1.30) | 0.95 | 7.6×10⁻⁵ | 0.55 | I |
| 16 | rs2903692 | 11,146,284 | CLEC16A | A/G | 0.28/0.33 | 0.31/0.36 | 0.0014 | 0.80 (0.92–0.70) | 0.27/0.33 | 0.32/0.35 | 0.32/0.36 | 0.0012 | 0.85 (0.76–0.94) | 0.43 | 6.4×10⁻⁶ | 0.64 | I |
| 2 | rs13017599 | 61,017,835 | REL | A/G | 0.40/0.35 | 0.40/0.37 | 0.027 | 1.16 (1.32–1.02) | 0.40/0.36 | 0.42/0.38 | 0.38/0.37 | 0.0026 | 1.16 (1.05–1.28) | 0.42 | 1.9×10⁻⁴ | 0.88 | I |
| 21 | rs11203203 | 42,709,255 | UBASH3A | A/G | 0.39/0.35 | 0.42/0.37 | 0.0025 | 1.22 (1.39–1.07) | 0.39/0.34 | 0.39/0.36 | 0.40/0.36 | 0.0033 | 1.16 (1.05–1.28) | 0.68 | 2.9×10⁻⁵ | 0.60 | I |
| 19 | rs602662 | 53,898,797 | FUT2 | A/G | 0.56/0.50 | 0.53/0.46 | 7.7×10⁻⁵ | 1.30 (1.49–1.14) | 0.53/0.47 | 0.48/0.45 | 0.51/0.50 | 0.0034 | 1.15 (1.05–1.27) | 0.29 | 1.9×10⁻⁶ | 0.21 | II |
| 21 | rs9976767 | 42,709,459 | UBASH3A | G/A | 0.48/0.46 | 0.48/0.44 | 0.028 | 1.15 (1.02–1.30) | 0.45/0.43 | 0.47/0.44 | 0.49/0.43 | 0.0055 | 1.14 (1.04–1.26) | 0.44 | 4.0×10⁻⁴ | 0.99 | I |
| 19 | rs601338 | 53,898,486 | FUT2 | A/G | 0.50/0.44 | 0.47/0.40 | 4.5×10⁻⁵ | 1.33 (1.52–1.16) | 0.51/0.44 | 0.46/0.42 | 0.48/0.48 | 0.0061 | 1.14 (1.04–1.26) | 0.062 | 2.7×10⁻⁶ | 0.14 | II |
| 2 | rs11682163 | 3,727,421 | ALLC | C/T | 0.49/0.39 | 0.49/0.44 | 7.9×10⁻⁵ | 1.29 (1.47–1.14) | 0.50/0.45 | 0.49/0.44 | 0.43/0.45 | 0.010 | 1.13 (1.03–1.24) | 0.048 | 7.6×10⁻⁶ | 0.14 | II |
| 19 | rs281377 | 53,898,415 | FUT2 | T/C | 0.43/0.49 | 0.46/0.52 | 9.3×10⁻⁶ | 0.71 (0.61–0.83) | 0.39/0.47 | 0.47/0.49 | 0.44/0.44 | 0.011 | 0.88 (0.80–0.97) | 0.025 | 2.1×10⁻⁶ | 0.059 | II |
| 22 | rs5771069 | 48,777,607 | IL17REL | A/G | 0.48/0.54 | 0.49/0.53 | 0.0057 | 0.82 (0.95–0.72) | 0.45/0.49 | 0.47/0.50 | 0.48/0.50 | 0.028 | 0.90 (0.82–0.99) | 0.89 | 5.8×10⁻⁴ | 0.43 | I |
| 4 | rs11936230 | 123,236,205 | KIAA1109/IL2/IL21 | T/C | 0.38/0.30 | 0.41/0.35 | 1.9×10⁻⁵ | 1.33 (1.17–1.52) | 0.38/0.34 | 0.38/0.36 | 0.38/0.36 | 0.039 | 1.11 (1.01–1.22) | 0.79 | 1.9×10⁻⁵ | 0.040 | II |
| 12 | rs4149056 | 21,222,816 | SLCO1B1 | C/T | 0.13/0.17 | 0.16/0.17 | 0.044 | 0.84 (1.00–0.70) | 0.14/0.17 | 0.15/0.16 | 0.13/0.15 | 0.043 | 0.87 (0.76–1.00) | 0.60 | 0.0045 | 0.76 | I |
| 22 | rs4820599 | 23,320,213 | GGT1 | G/A | 0.29/0.24 | 0.31/0.28 | 0.035 | 1.16 (1.01–1.33) | 0.29/0.28 | 0.29/0.27 | 0.31/0.28 | 0.043 | 1.11 (1.00–1.23) | 0.77 | 0.0038 | 0.69 | I |
| 12 | rs3184504 | 110,368,991 | SH2B3 | T/C | 0.54/0.52 | 0.57/0.51 | 0.0016 | 1.23 (1.08–1.40) | 0.47/0.45 | 0.51/0.49 | 0.51/0.47 | 0.050 | 1.10 (1.00–1.21) | 0.67 | 4.6×10⁻⁴ | 0.21 | I |
Complete association results for SNPs reaching nominal significance with consistent effect sizes in the replication. For the genome-wide analysis, the allele frequencies were calculated based on allele dosages and are listed separately for the German and Scandinavian discovery panels. For the replication analysis, allele frequencies are given for all three panels making up the combined replication panel. The combined P-values for the genome-wide analysis and the replication analysis were generated using the METAL software [34]. The genomic positions refer to NCBI’s build 36. SNP selection strategies I and II indicate SNPs selected based on the two SNP selection strategies. The HLA association was confirmed for rs4143332 (Prepl=4.1×10−77, Pcomb=4.4×10−123) (not listed in the table).
Chr, chromosome; Al, alleles; OR, Odds Ratio; CI, Confidence Interval; BD, Breslow-Day; Het, heterogeneity
Odds ratios and P-values derived from logistic regressions of allele dosages including the six first principal components from the principal components analysis as covariates.
P-values generated by using the Cochrane-Mantel-Haenszel test
The strongest finding in the replication panel was the missense SNP rs3748816 (M[ATG] → T[ACG]) located in MMEL1, which achieved genome-wide significance [12] in the combined analysis (Pcomb=2.1×10⁻⁸) (Table 2). The association signal at this locus (1p36) encompasses MMEL1 and extends into the tumor necrosis factor receptor superfamily member 14 (TNFRSF14) gene (Figure 1).
Figure 1. Regional association plots for MMEL1/TNFRSF14, CLEC16A and FUT2.

The association results for both the genotyped and imputed SNPs are represented by the −log10 P-value plotted against the genomic position. The index SNP is marked out with a purple diamond while the colors of the remaining SNPs indicate the linkage disequilibrium with the index SNP. The recombination rates were derived from the HapMap project and are represented by the thin blue lines. The plots were generated using the LocusZoom software [10].
FUT2 associations and bile microbial community composition
Eight novel loci demonstrated suggestive evidence for association in the replication panel (Prepl<0.05), but were not robust to correction for multiple testing (Table 2). Of these, three SNPs in the Fucosyltransferase 2 gene (FUT2, see Table 2 and Figure 1) at 19q13 (a synonymous SNP, rs281377 (Pcomb=2.1×10⁻⁶), a nonsense SNP, rs601338 (W(TGG)→*(TAG)) (Pcomb=2.7×10⁻⁶) and a missense SNP, rs602662 (G(GGT)→S(AGT)) (Pcomb=1.9×10⁻⁶) are of particular interest given the associations between FUT2 genotype and several infectious diseases. Strong LD between these SNPs (r2rs601338 vs. rs281377=0.84, r2rs601338 vs. rs602662=0.76 and r2rs281377 vs. rs602662=0.57) implies that the putatively functional allele(s) cannot be directly determined by the association analysis. The rs601338 polymorphism generates a premature stop codon (W143X) and a truncated, dysfunctional FUT2 protein [13]. By immunostaining for the α(1,2)fucose-specific lectin Ulex europaeus agglutinin-I (Figure 2), we show that this stop codon appears to have a profound effect on expression of α(1,2)fucosylated glycans in bile duct epithelium. The rs602662 polymorphism results in an amino acid substitution (G247S) which may be detrimental to FUT2 function as shown by strong evolutionary conservation of this residue (Supplementary Figure 2).
Figure 2. Biliary FUT2 Phenotyping.
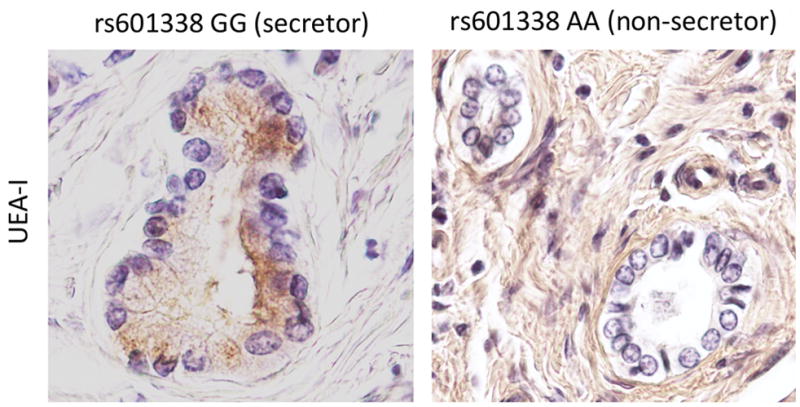
Lectin staining of the hilar liver biopsy specimens from PSC patients. Paraffin-embedded sections from individuals with AA (non-secretor) and GG (secretor) variants of the FUT2 rs601338 SNP were used to evaluate the expression of α(1,2)fucosylated glycans in bile duct epithelium. H antigen, detected with the α(1,2)fucose-specific lectin Ulex europaeus agglutinin-I (UEA-I) (brown staining), is expressed on the apical surface of the biliary epithelial layer of secretor variant, while it is absent on non-secretor epithelia (Original magnification X400).
To evaluate a potential functional role of FUT2 secretor status and genotype as defined by rs601338 in the pathophysiology of PSC, we analyzed the bacterial community composition of bile samples from 39 PSC patients (8 homozygous for the functional allele “G”, 21 heterozygous and 10 homozygous for the loss-of-function allele “A” (W(TGG)→*(TAG)), since we previously observed genotype-dependent changes in community structure of the colon in the context of Crohn’s disease [11]. Intriguingly, the abundances of several phyla displayed significant differences with respect to FUT2 genotype and secretor status similar to those observed in the colon. In particular, the Firmicutes are significantly elevated and Proteobacteria significantly decreased among nonsecretors, in addition to differences observed in the Bacteroidetes, Actinobacteria and Tenericutes (Figure 3A and Supplementary Table 3). Similarly, alpha diversity measures display significant differences with respect to genotype in the same manner observed in the colon, i.e. a decrease of diversity in the heterozygous state compared to both homozygous genotypes (Figure 3B and 3C and Supplementary Table 4). Finally, differences in inter-individual variability, i.e. beta diversity, are also apparent (adonis: unweighted UniFrac-r2=0.074, P=0.055 (genotype); normalized weighted UniFrac- r2=0.057, P=0.049 (secretor status)) (Supplementary Figure 4A and 4B). Using the full species assemblage to test for differentiation with respect to FUT2 genotype also revealed marginal results (Redundancy Analysis: F=1.140, P=0.085 (Supplementary Figure 4C)).
Figure 3. Influence of FUT2 genotype on phyla abundances and alpha diversity.

(A)
Mean abundances (± SE) of the major phyla with respect to genotype at the nonsense SNP rs601338 (W(TGG)→*(TAG). (B) The Abundance based Coverage Estimator (ACE) as a measure of the approximated species richness [35] (C) Alpha diversity measured as the sum of the total branch length in each sample (i.e. Phylogenetic Diversity) [36]. All values are based on the normalized dataset (2,000 reads per individual).
Additional suggestive associations
Among the other associated SNPs, rs2903692 (Pcomb=6.4×10⁻⁶) is located in the gene C-type lectin domain family 16, member A (CLEC16A, see Table 2 and Figure 1). Two SNPs, rs11203203 (Pcomb=2.9×10⁻⁵) and rs9976767 (Pcomb=4.0×10⁻⁴) localize to an intron of ubiquitin associated and SH3 domain containing A gene (UBASH3A, see Table 2) and are in LD (r2=0.63). The rs11682163 SNP (Pcomb=7.6×10⁻⁶) is localized in allantoicase (ALLC, see Table 2) at 2p25. At 22q13, rs5771069 (Pcomb=5.8×10⁻⁴) is a missense SNP (L(CTT)→P(CCT)) in interleukin 17 receptor E-like (IL17REL, see Table 2). At 12p12, the rs4149056 SNP (Pcomb=0.0045) is a missense SNP (V(GTG)→A(GCG) in an exon of the solute carrier organic anion transporter family gene (SLCO1B1). The rs4820599 SNP (Pcomb=0.0038) is localized in an intron of the gamma-glutamyltransferase 1 gene (GGT1) at 22q11. The rs3184504 SNP (Pcomb=4.6×10⁻⁴) represents a missense mutation (W(TGG)→R(CGG) in an exon of the SH2B adaptor protein 3 gene (SH2B3, see Table 2) at 12q24.
The associated SNPs at 4q27 (rs13132245; Pcomb=1.2×10⁻⁷ and rs13119723; Pcomb=9.9×10⁻⁸ ) are localized 42 kb upstream of and in an intron of KIAA1109, respectively. Both rs13119723 and another genetic variant residing in this region, rs6822844, which is in LD with the replicated SNPs at rs13132245 (r2 = 0.85) and rs13119723 (r2 = 0.66) have been reported nominally associated with PSC in two candidate gene studies [5, 6]. The replicated SNPs at 9q34 (rs4077515; Pcomb=7.6×10⁻⁵) in the caspase-recruitment domain family, member 9 gene (CARD9) and at 2p16 (rs13017599; Pcomb=1.9 ×10⁻⁴) near v-rel reticuloendotheliosis viral oncogene (REL) (Table 2 and Supplementary Figure 1) also belong to loci which previously have been reported nominally associated with PSC [5]. A GRAIL analysis of previously published and hereby detected PSC risk loci demonstrated that several of the loci are functionally related (see Supplementary Figure 3A and 3B).
Discussion
In the largest PSC cohort presented, we performed replication genotyping and a combined analysis of 45 SNPs not followed up in a previous GWAS in PSC [3]. We identified one novel PSC risk locus with association results below the threshold for genome-wide significance along with suggestive evidence for replication of 8 additional loci. The PSC associated FUT2 variant was shown to significantly influence the bile microbial community composition in PSC patients.
The replicated SNP at 1p36 (MMEL1-TNFRSF14) represents the first genetic overlap demonstrated between PSC and primary biliary cirrhosis (PBC) [14]. Interestingly, the SNP demonstrates opposite effect sizes in PSC and PBC [14]. Considering the peak association signal of the observed non-synonymous SNP at MMEL1 (Figure 1), the suggestive presence of MMEL1 protein expression in bile duct cells and glandular cells of the gall bladder (http://www.proteinatlas.org) and the fundamental role of other membrane metallo-endopeptidase family members in processes of metabolism, MMEL1 has a relevant candidate role at this locus. For PSC, TNFRSF14 is also an intriguing candidate. The TNFRSF14 protein is expressed on T-lymphocytes and mucosal epithelium and acts as a receptor for the proinflammatory cytokine LIGHT [15]. TNFRSF14 signaling also has inhibitory effects on B- and T-cells, and this dual role is thought to regulate immune tolerance [16]. Mice lacking Btla (Btla−/− mice), the mediator responsible for the inhibitory actions of TFNRSF14, spontaneously develop an autoimmune, hepatitis-like disease accompanied by severe bile duct epithelium inflammation with nuclear pleomorphism and irregularity of duct outlines [17] paralleling features of histopathological liver biopsy specimens in human PSC [18].
FUT2 encodes an enzyme (Galactoside 2-alpha-L-fucosyltransferase 2) involved in protein glycosylation, including the ABH blood-antigen synthesis pathway [13]. Genetic variants giving rise to a non-functional, truncated FUT2-enzyme result in an inability to synthesize ABH-antigens on mucosal surfaces and in salivary glands, which is referred to as non-secretor status [13]. FUT2-determined secretor status has been observed to affect susceptibility to a number of infectious agents [19], possibly by altering the recognition and binding of pathogen adhesins to their preferred carbohydrate receptors on mucosal surfaces [20]. Homozygosity for the PSC associated nonsense variant rs601338 has been reported to account for > 95% of the prevalence of non-secretor status in Caucasians [21]. The nonsense SNP rs601338 is also an risk factor for Crohn disease [19]. Although the bile duct is an environment distinct from the portions of the GI tract most frequently afflicted by Crohn’s disease, we observe strikingly similar changes with respect to the abundance of major bacterial phyla and the level and pattern of bacterial diversity compared to previous observations in the colon [11]. Thus, these general patterns appear to be consistent between different habitats throughout the GI tract, which may underlie the overlapping association of FUT2 to different chronic inflammatory disorders. Importantly, based on the present data, further enquiries into this topic need to take account of both biliary FUT2 expression and the biliary microbiome in the contaminated bile ducts of these patients, as well as the potential effects from rs602662 genotype on FUT2 function [22, 23].
Among the additional novel suggestive loci, the CLEC16A association was most robust. CLEC16A has a predicted C-type lectin domain structure [24] and C-type lectins serve as central players in the immune response by modulating toll receptor function [25]. A role for toll-like receptor signaling in PSC pathogenesis has been suggested [26], but whether CLEC16A is implicated can only be speculated. Like for CLEC16A, the suggestive associations observed at SLCO1B1 and GGT might also involve immunological mechanisms since SLCO1B1 and GGT are involved in the hepatic uptake and interconvertion of the inflammatory mediator leukotriene C4, respectively [27, 28]. The associations at SLCO1B1 and GGT can also reflect other roles of these genes as the PSC associated variants have been shown to alter blood levels of bilirubin and gamma glutamyltransferase, respectively, in previous GWAS [29, 30].
The potential roles of the PSC associations at IL2/IL21 and REL/PUS10 that are strengthened by the current study have previously been extensively reviewed [31]. In a disease like PSC, in which no effective medical therapy is available, the IL2 and IL2RA genetic findings could prove to be of unique translational value (e.g. an IL-2 monoclonal antibody (Daclizumab/Zenapax) is under clinical trials in other conditions). Like for FUT2, the associations observed at CARD9 point towards the interaction of host genetics and microbiota. When stimulated by intracellular pathogens, CARD9 interacts with NOD2 and induces cytokine production or activates the NF-KB pathway [32].
It has been established that susceptibility loci in related conditions are typically implicated in several disorders [33]. What is increasingly evident, and strengthened by our, study is that PSC belongs to the family of autoimmune diseases, and that the overlapping genes are not restricted to IBD susceptibility genes (Table 3). For a rare disease, a clear understanding of the overlap with other immune mediated diseases may provide therapeutic opportunities otherwise not within scope. There is also a strong need to expand on the genetic susceptibility to PSC in study populations recruited outside of Northern-Europe and the United States.
Table 3.
Associations in other autoimmune diseases for PSC loci with robust or suggestive association in the current study.
| Locus | Candidate gene(s) and SNP(s) associated in the current study | Autoimmune phenotypes with a reported association at the locus | Associated SNP | References |
|---|---|---|---|---|
| 1p36 | MMEL1-TNFRSF14 | Celiac disease | rs3748816 | Dubois et al., Nat Genet, (2010). |
| rs3748816 | Multiple sclerosis | rs6684864 | Blanco-Kelly et al., Genes Immun 12, 145 (2011). | |
| rs3748816 | Ban et al., Genes Immun 11, 660 (2010). | |||
| Primary biliary cirrhosis | rs3748816 | Hirschfield et al., Nat Genet 42, 655 (2010). | ||
| Rheumatoid arthritis | rs3890745 | Raychaudhuri et al., Nat Genet 40, 1216 (2008). | ||
| Ulcerative colitis | rs734999 | Anderson et al., Nat Genet 43, 246 (2011). | ||
| 2p15 | REL | Celiac disease | rs13003464 | Dubois et al., Nat Genet, (Feb 28, 2010). |
| rs13017599 | Crohn’s disease | rs10181042 | Franke et al., Nat Genet 42, 1118 (2010). | |
| Psoriasis | rs702873 | Strange et al., Nat Genet 42, 985 (2010). | ||
| Psoriatic arthritis | rs13017599 | Ellinghaus et al., J Invest Dermatol Epub (2011). | ||
| Rheumatoid arthritis | rs13017599 | Gregersen et al., Nat Genet 41, 820 (2009). | ||
| rs13031237 | Stahl et al., Nat Genet 42, 508 (2010). | |||
| Ulcerative colitis | rs13003464 | McGovern et al., Nat Genet 42, 332 (2010). | ||
| 2p25 | ALLC | n/a | ||
| ra11682163 | ||||
| 4q27 | IL2-IL21 | Celiac disease | rs13119723 | van Heel et al., Nat Genet 39, 827 (2007). |
| rs13132245 | rs6822844 | Hunt et al., Nat Genet 40, 395 (2008). | ||
| rs13119723 | rs13151961 | Dubois et al., Nat Genet, (2010). | ||
| rs11936230 | Graves’ disease | rs17388568 | Todd et al., Nat Genet 39, 857 (2007). | |
| Psoriatic arthritis | rs13119723 | Liu et al., PLoS Genet 4, e1000041 (2008). | ||
| rs13151961 | Liu et al., PLoS Genet 4, e1000041 (2008). | |||
| Rheumatoid arthritis | rs13119723 | Stahl et al., Nat Genet 42, 508 (2010). | ||
| rs6822844 | Maiti et al., Arthritis Rheum 62, 323 (2010). | |||
| Systemic lupus erythematosus | rs6822844 | Maiti et al., Arthritis Rheum 62, 323 (2010). | ||
| Sjögren’s syndrome | rs6822845 | Maiti et al., Arthritis Rheum 62, 323 (2010). | ||
| Type 1 diabetes | rs4505848 | Barrett et al., Nat Genet 41, 703 (2009). | ||
| rs6534347 | WTCCC, Nature 447, 661 (2007). | |||
| Ulcerative colitis | rs17388568 | Anderson et al., Nat Genet 43, 246 (2011). | ||
| 9q35 | CARD9 | Ankylosing spondylitis | rs4077515 | Burton et al., Nat Genet 39, 1329 (2007). |
| rs4077515 | rs4077515 | Pointon et al., Genes Immun 11, 490 (2010). | ||
| rs10781500 | Evans et al., Nat Genet 43, 761 (2011). | |||
| Crohn’s disease | rs4077515 | Franke et al., Nat Genet 42, 1118 (2010). | ||
| rs10870077 | Zhernakova et al., Am J Hum Genet 82, 1202 (2008). | |||
| Ulcerative colitis | rs4077515 | McGovern et al., Nat Genet 42, 332 (2010). | ||
| rs10781500 | Barrett et al., Nat Genet 41, 1330 (2009). | |||
| rs10781499 | Anderson et al., Nat Genet 43, 246 (2011). | |||
| rs10870077 | Zhernakova et al., Am J Hum Genet 82, 1202 (2008). | |||
| 12p12 | SLCO1B1 | n/a | ||
| rs4149056 | ||||
| 12q31 | SH2B3 | Celiac disease | rs653178 | Hunt et al., Nat Genet 40, 395 (2008). |
| rs3184504 | rs653178 | Dubois et al., Nat Genet, (2010). | ||
| rs653178 | Zhernakova et al., PLoS Genet 7, e1002004 (2011). | |||
| Multiple sclerosis | rs3184504 | Alcina et al., Genes Immun 11, 439 (2010). | ||
| Rheumatoid arthritis | rs3184504 | Stahl et al., Nat Genet 42, 508 (2010). | ||
| rs653178 | Zhernakova et al., PLoS Genet 7, e1002004 (2011). | |||
| Systemic lupus erythematosus | rs17696736 | Gateva et al., Nat Genet 41, 1228 (2009). | ||
| Type 1 diabetes | rs3184504 | Barrett et al., Nat Genet 41, 703 (2009). | ||
| rs17696736 | WTCCC, Nature 7, 661 (2007). | |||
| 16p14 | CLEC16A | Celiac disease | rs12928822 | Dubois et al., Nat Genet, (Feb 28, 2010). |
| rs2903692 | Multiple sclerosis | rs11865121 | De Jager et al., Nat Genet 41, 776 (2009). | |
| rs2903692 | Martinez, et al. Ann Rheum Dis 69, 309 (2010) | |||
| Primary biliary cirrhosis | rs12924729 | Mells et al., Nat Genet 43, 329 (2011). | ||
| Rheumatoid arthritis | rs6498169 | Martinez et al., Ann Rheum Dis 69, 309 (2010). | ||
| Systemic lupus erythematosus | rs12708716 | Gateva et al., Nat Genet 41, 1228 (2009). | ||
| Type 1 diabetes | rs12708716 | Cooper et al., Nat Genet 40, 1399 (2008). | ||
| rs2903692 | Martinez et al., Ann Rheum Dis 69, 309 (2010). | |||
| 19q13 | FUT2 | Crohn’s disease | rs504963 | McGovern et al., Hum Mol Genet 19, 3468 (2010). |
| rs602662 | rs602662 | McGovern et al., Hum Mol Genet 19, 3468 (2010). | ||
| rs601338 | rs601338 | McGovern et al., Hum Mol Genet 19, 3468 (2010). | ||
| rs281377 | rs281379 | Franke et al., Nat Genet 42, 1118 (2010). | ||
| 22q11 | GGT1 | n/a | ||
| rs4820599 | ||||
| 21q22 | UBASH3A | Celiac disease | rs11203203 | Zhernakova et al., PLoS Genet 7, e1002004 (2011). |
| rs11203203 | Rheumatoid arthritis | rs11203203 | Stahl et al., Nat Genet 42, 508 (2010). | |
| rs9976767 | rs11203203 | Zhernakova et al., PLoS Genet 7, e1002004 (2011). | ||
| Type 1 diabetes | rs9976767 | Grant et al., Diabetes 58, 290 (2009). | ||
| rs11203203 | Barrett et al., Nat Genet 41, 703 (2009). | |||
| Vitiligo | rs11203203 | Jin et al., N Engl J Med 362, 1686 (2010). | ||
| 22q13 | IL17REL | Ulcerative colitis | rs5771069 | Anderson et al., Nat Genet 43, 246 (2011). |
| rs5771069 | rs5771069 | Franke et al., Nat Genet 42, 292 (2010). |
All currently reported associations in autoimmune diseases for the nominally replicated candidate genes studied in the present paper are listed in the table. The index SNP from the current study is indicated in bold. In studies where multiple SNPs at the locus are reported associated to the respective disease, the SNP with the lowest P-value is presented in the table. Significantly associated index SNPs from the current study are additionally presented in the table.
WTCCC; Wellcome Trust Case Control Consortium, n/a; no associations to autoimmune diseases reported for genetic variants in these genes.
In conclusion, we identify multiple PSC risk loci involved in regulating the immune response and the present study demonstrates a considerable overlap in the genetic susceptibility with other autoimmune diseases not restricted to IBD. The FUT2 association potentially represents other components of the pathogenesis, and the significant influence from FUT2 genotype on biliary microbial composition demonstrated by our study should be taken into account when further investigating the influence of microbiota on biliary pathology.
Supplementary Material
Acknowledgments
Financial Support: The study was supported by The Norwegian PSC Research Center (http://ous-research.no/nopsc/) and the German Ministry of Education and Research (BMBF) through the National Genome Research Network (NGFN) and the Integrated Research and Treatment Center - Transplantation (reference number: 01EO0802) and the PopGen biobank (http://www.popgen.de). The US part of the study was supported by the NIH (DK 84960). The project received infrastructure support through the Norwegian Functional Genomics Programme (FUGE) via the “CIGENE” platform (http://www.cigene.no/), the Research Computing Services at the University of Oslo and the DFG excellence cluster “Inflammation at Interfaces” (http://www.inflammation-at-interfaces.de/)
The authors are indebted to all PSC patients and healthy controls for their participation. We thank Katja Cloppenborg-Schmidt, Ilona Urbach, Irene Pauselis, Tanja Wesse, Tanja Henke, Rainer Vogler, Hege Dahlen Sollid, Bente Woldseth and Liv Wenche Torbjørnsen for expert technical help. Paul R. Berg and Silje Karoliussen are specially thanked for providing expert assistance in the genotyping process. We are grateful to Arthur Kaser and Michael Nothnagel for helpful discussions. Benedicte A. Lie and The Norwegian Bone Marrow Donor Registry at Oslo University Hospital, Rikshospitalet in Oslo are acknowledged for sharing the healthy Norwegian controls. Dr. Felix Braun, Dr. Wolfgang Kreisel, Dr. Thomas Berg and Dr. Rainer Günther are acknowledged for contributing German PSC patients.
List of abbreviations
- PSC
primary sclerosing cholangitis
- SNP
single nucleotide polymorphism
- GWAS
genome-wide association study
- IBD
inflammatory bowel disease
- CEPH
Centre d’Etude du Polymorphisme Humain
- HWE
Hardy-Weinberg-Equilibrium
- LD
linkage disequilibrium
- CMH
Cochran-Mantel-Haenszel
- BD
Breslow-Day
- HET
heterogeneity
- PBC
primary biliary cirrhosis
- Chr
chromosome
- Al
alleles
- OR
Odds Ratio
- CI
Confidence Interval
- GRAIL
Gene Relationships Across Implicated Loci
Footnotes
Conflict of interest: All authors declare no conflict of interest.
Publisher's Disclaimer: This is a PDF file of an unedited manuscript that has been accepted for publication. As a service to our customers we are providing this early version of the manuscript. The manuscript will undergo copyediting, typesetting, and review of the resulting proof before it is published in its final form. Please note that during the production process errors may be discovered which could affect the content, and all legal disclaimers that apply to the journal pertain.
References
- 1.Karlsen TH, Schrumpf E, Boberg KM. Update on primary sclerosing cholangitis. Dig Liver Dis. 2010;42:390–400. doi: 10.1016/j.dld.2010.01.011. [DOI] [PubMed] [Google Scholar]
- 2.Saarinen S, Olerup O, Broome U. Increased frequency of autoimmune diseases in patients with primary sclerosing cholangitis. Am J Gastroenterol. 2000;95:3195–3199. doi: 10.1111/j.1572-0241.2000.03292.x. [DOI] [PubMed] [Google Scholar]
- 3.Melum E, Franke A, Schramm C, Weismuller TJ, Gotthardt DN, Offner FA, et al. Genome-wide association analysis in primary sclerosing cholangitis identifies two non-HLA susceptibility loci. Nat Genet. 2011;43:17–19. doi: 10.1038/ng.728. [DOI] [PMC free article] [PubMed] [Google Scholar]
- 4.Karlsen TH, Franke A, Melum E, Kaser A, Hov JR, Balschun T, et al. Genome-wide association analysis in primary sclerosing cholangitis. Gastroenterology. 2010;138:1102–1111. doi: 10.1053/j.gastro.2009.11.046. [DOI] [PubMed] [Google Scholar]
- 5.Janse M, Lamberts LE, Franke L, Raychaudhuri S, Ellinghaus E, Muri Boberg K, et al. Three ulcerative colitis susceptibility loci are associated with primary sclerosing cholangitis and indicate a role for IL2, REL, and CARD9. Hepatology. 2011;53:1977–1985. doi: 10.1002/hep.24307. [DOI] [PMC free article] [PubMed] [Google Scholar]
- 6.Stallhofer J, Denk GU, Glas J, Laubender RP, Goke B, Rust C, et al. Analysis of IL2/IL21 Gene Variants in Cholestatic Liver Diseases Reveals an Association with Primary Sclerosing Cholangitis. Digestion. 2011;84:29–35. doi: 10.1159/000321619. [DOI] [PubMed] [Google Scholar]
- 7.Trynka G, Zhernakova A, Romanos J, Franke L, Hunt KA, Turner G, et al. Coeliac disease-associated risk variants in TNFAIP3 and REL implicate altered NF-kappaB signalling. Gut. 2009;58:1078–1083. doi: 10.1136/gut.2008.169052. [DOI] [PubMed] [Google Scholar]
- 8.Price AL, Patterson NJ, Plenge RM, Weinblatt ME, Shadick NA, Reich D. Principal components analysis corrects for stratification in genome-wide association studies. Nat Genet. 2006;38:904–909. doi: 10.1038/ng1847. [DOI] [PubMed] [Google Scholar]
- 9.Purcell S, Neale B, Todd-Brown K, Thomas L, Ferreira MA, Bender D, et al. PLINK: a tool set for whole-genome association and population-based linkage analyses. Am J Hum Genet. 2007;81:559–575. doi: 10.1086/519795. [DOI] [PMC free article] [PubMed] [Google Scholar]
- 10.Pruim RJ, Welch RP, Sanna S, Teslovich TM, Chines PS, Gliedt TP, et al. LocusZoom: regional visualization of genome-wide association scan results. Bioinformatics. 2010;26:2336–2337. doi: 10.1093/bioinformatics/btq419. [DOI] [PMC free article] [PubMed] [Google Scholar]
- 11.Rausch P, Rehman A, Kunzel S, Hasler R, Ott SJ, Schreiber S, et al. Colonic mucosa-associated microbiota is influenced by an interaction of Crohn disease and FUT2 (Secretor) genotype. Proc Natl Acad Sci U S A. 2011;108:19030–19035. doi: 10.1073/pnas.1106408108. [DOI] [PMC free article] [PubMed] [Google Scholar]
- 12.Hirschhorn JN, Daly MJ. Genome-wide association studies for common diseases and complex traits. Nat Rev Genet. 2005;6:95–108. doi: 10.1038/nrg1521. [DOI] [PubMed] [Google Scholar]
- 13.Kelly RJ, Rouquier S, Giorgi D, Lennon GG, Lowe JB. Sequence and expression of a candidate for the human Secretor blood group alpha(1,2)fucosyltransferase gene (FUT2). Homozygosity for an enzyme-inactivating nonsense mutation commonly correlates with the non-secretor phenotype. J Biol Chem. 1995;270:4640–4649. doi: 10.1074/jbc.270.9.4640. [DOI] [PubMed] [Google Scholar]
- 14.Hirschfield GM, Liu X, Han Y, Gorlov IP, Lu Y, Xu C, et al. Variants at IRF5-TNPO3, 17q12-21 and MMEL1 are associated with primary biliary cirrhosis. Nat Genet. 2010;42:655–657. doi: 10.1038/ng.631. [DOI] [PMC free article] [PubMed] [Google Scholar]
- 15.Steinberg MW, Shui JW, Ware CF, Kronenberg M. Regulating the mucosal immune system: the contrasting roles of LIGHT, HVEM, and their various partners. Semin Immunopathol. 2009;31:207–221. doi: 10.1007/s00281-009-0157-4. [DOI] [PMC free article] [PubMed] [Google Scholar]
- 16.Sedy JR, Gavrieli M, Potter KG, Hurchla MA, Lindsley RC, Hildner K, et al. B and T lymphocyte attenuator regulates T cell activation through interaction with herpesvirus entry mediator. Nat Immunol. 2005;6:90–98. doi: 10.1038/ni1144. [DOI] [PubMed] [Google Scholar]
- 17.Oya Y, Watanabe N, Owada T, Oki M, Hirose K, Suto A, et al. Development of autoimmune hepatitis-like disease and production of autoantibodies to nuclear antigens in mice lacking B and T lymphocyte attenuator. Arthritis Rheum. 2008;58:2498–2510. doi: 10.1002/art.23674. [DOI] [PMC free article] [PubMed] [Google Scholar]
- 18.Chapman RW, Arborgh BA, Rhodes JM, Summerfield JA, Dick R, Scheuer PJ, et al. Primary sclerosing cholangitis: a review of its clinical features, cholangiography, and hepatic histology. Gut. 1980;21:870–877. doi: 10.1136/gut.21.10.870. [DOI] [PMC free article] [PubMed] [Google Scholar]
- 19.McGovern DP, Jones MR, Taylor KD, Marciante K, Yan X, Dubinsky M, et al. Fucosyltransferase 2 (FUT2) non-secretor status is associated with Crohn’s disease. Hum Mol Genet. 2010;19:3468–3476. doi: 10.1093/hmg/ddq248. [DOI] [PMC free article] [PubMed] [Google Scholar]
- 20.Mentis A, Blackwell CC, Weir DM, Spiliadis C, Dailianas A, Skandalis N. ABO blood group, secretor status and detection of Helicobacter pylori among patients with gastric or duodenal ulcers. Epidemiol Infect. 1991;106:221–229. doi: 10.1017/s0950268800048366. [DOI] [PMC free article] [PubMed] [Google Scholar]
- 21.Svensson L, Petersson A, Henry SM. Secretor genotyping for A385T, G428A, C571T, C628T, 685delTGG, G849A, and other mutations from a single PCR. Transfusion (Paris) 2000;40:856–860. doi: 10.1046/j.1537-2995.2000.40070856.x. [DOI] [PubMed] [Google Scholar]
- 22.Serpa J, Mendes N, Reis CA, Santos Silva LF, Almeida R, Le Pendu J, et al. Two new FUT2 (fucosyltransferase 2 gene) missense polymorphisms, 739G-->A and 839T-->C, are partly responsible for non-secretor status in a Caucasian population from Northern Portugal. Biochem J. 2004;383:469–474. doi: 10.1042/BJ20040803. [DOI] [PMC free article] [PubMed] [Google Scholar]
- 23.Silva LM, Carvalho AS, Guillon P, Seixas S, Azevedo M, Almeida R, et al. Infection-associated FUT2 (Fucosyltransferase 2) genetic variation and impact on functionality assessed by in vivo studies. Glycoconj J. 2010;27:61–68. doi: 10.1007/s10719-009-9255-8. [DOI] [PubMed] [Google Scholar]
- 24.Hakonarson H, Grant SF, Bradfield JP, Marchand L, Kim CE, Glessner JT, et al. A genome-wide association study identifies KIAA0350 as a type 1 diabetes gene. Nature. 2007;448:591–594. doi: 10.1038/nature06010. [DOI] [PubMed] [Google Scholar]
- 25.Svajger U, Anderluh M, Jeras M, Obermajer N. C-type lectin DC-SIGN: an adhesion, signalling and antigen-uptake molecule that guides dendritic cells in immunity. Cell Signal. 2010;22:1397–1405. doi: 10.1016/j.cellsig.2010.03.018. [DOI] [PMC free article] [PubMed] [Google Scholar]
- 26.Karrar A, Broome U, Sodergren T, Jaksch M, Bergquist A, Bjornstedt M, et al. Biliary epithelial cell antibodies link adaptive and innate immune responses in primary sclerosing cholangitis. Gastroenterology. 2007;132:1504–1514. doi: 10.1053/j.gastro.2007.01.039. [DOI] [PubMed] [Google Scholar]
- 27.Jedlitschky G, Keppler D. Transport of leukotriene C4 and structurally related conjugates. Vitam Horm. 2002;64:153–184. doi: 10.1016/s0083-6729(02)64005-1. [DOI] [PubMed] [Google Scholar]
- 28.Mistry D, Stockley RA. Gamma-glutamyl transferase: the silent partner? Copd. 2010;7:285–290. doi: 10.3109/15412555.2010.496819. [DOI] [PubMed] [Google Scholar]
- 29.Johnson AD, Kavousi M, Smith AV, Chen MH, Dehghan A, Aspelund T, et al. Genome-wide association meta-analysis for total serum bilirubin levels. Hum Mol Genet. 2009;18:2700–2710. doi: 10.1093/hmg/ddp202. [DOI] [PMC free article] [PubMed] [Google Scholar]
- 30.Yuan X, Waterworth D, Perry JR, Lim N, Song K, Chambers JC, et al. Population-based genome-wide association studies reveal six loci influencing plasma levels of liver enzymes. Am J Hum Genet. 2008;83:520–528. doi: 10.1016/j.ajhg.2008.09.012. [DOI] [PMC free article] [PubMed] [Google Scholar]
- 31.Karlsen TH, Kaser A. Deciphering the genetic predisposition to primary sclerosing cholangitis. Semin Liver Dis. 2011;31:188–207. doi: 10.1055/s-0031-1276647. [DOI] [PubMed] [Google Scholar]
- 32.Hara H, Saito T. CARD9 versus CARMA1 in innate and adaptive immunity. Trends Immunol. 2009;30:234–242. doi: 10.1016/j.it.2009.03.002. [DOI] [PubMed] [Google Scholar]
- 33.Zhernakova A, van Diemen CC, Wijmenga C. Detecting shared pathogenesis from the shared genetics of immune-related diseases. Nat Rev Genet. 2009;10:43–55. doi: 10.1038/nrg2489. [DOI] [PubMed] [Google Scholar]
- 34.Willer CJ, Li Y, Abecasis GR. METAL: fast and efficient meta-analysis of genomewide association scans. Bioinformatics. 2010;26:2190–2191. doi: 10.1093/bioinformatics/btq340. [DOI] [PMC free article] [PubMed] [Google Scholar]
- 35.Chao A. Estimating the population size for capture-recapture data with unequal catchability. Biometrics. 1987;43:783–791. [PubMed] [Google Scholar]
- 36.Faith DP. Conservation Evaluation and Phylogenetic Diversity. Biol Conserv. 1992;61:1–10. [Google Scholar]
Associated Data
This section collects any data citations, data availability statements, or supplementary materials included in this article.