1. Introduction
A complex system is characterized by interconnected components which are typically quite simple, but when assembled as a whole exhibit emergent behavior that would not be predicted based on the behavior of each individual component alone (Mitchell, 2009). In other words, the emergent behavior of the system is not a simple sum of behaviors of all the constituent components. The brain is an excellent example of a complex system. A complete understanding of the biochemical processes that underlie the behavior of an individual neuron can never produce an explanation for processes such as decision making and emotion. In his paper entitled More Is Different (Anderson, 1972), P.W. Anderson makes the case that multiscale modeling approaches are necessary for modeling systems in the natural world. He advised against the reductionistic approach in which a system is condensed to its most basic constituent, studied ad infinitum at that level, and the resultant conclusions are applied to the system at the macroscopic level. It is becoming increasingly apparent that multiscale approaches will be necessary to understand many of the systems in our universe. In fact, in work by Gu et al. (Gu, Weedbrook, Perales, & Nielsen, 2009), an infinite square ising model was used as formal evidence of Anderson’s assertion. In this work, the ising model was used to represent a cellular automaton (CA), a two dimensional lattice of cells that communicate with adjacent neighbors. Inputs to the CA were encoded as the ground state of the ising block, and the model stepped through time according to an update function. Many macroscopic features of the system were shown to be undecidable based solely on the microscopic properties. They concluded that a reductionistic “theory of everything” is necessary, but is unlikely to be solely sufficient to describe a complex system with emergent behavior. Clearly such a theory of everything would be inapplicable in the brain. However, by modeling the way neurons interact with each other en masse, a bottom-up modeling approach may be able to reproduce some of the complex behaviors inherent to the brain. One such approach is agent based modeling.
An agent based model (ABM) consists of a set of individuals, or agents, representing the components of a system. Agents are allowed to interact with each other according to a rule, or a set of rules, designed with knowledge of the system in mind. Agent based models are most valuable in systems that exhibit complex emergent behavior. Although rules only control the low-level interactions of agents, these models often exhibit emergent behavior on the level of the system. For example, the Boids simulation (Reynolds, 1987) is one such ABM, where the agents in the simulation are birds, and the very simple rules they obey are cohesion (fly close to your neighbors), separation (not too close), and alignment (in the same direction). These simple rules will, over a few iterations, form a coordinated flock out of any random initial configuration of birds.
The brain exhibits hierarchy in both structural (Bullmore & Sporns, 2009; Hagmann, et al., 2008) and functional (Bullmore & Sporns, 2009; Meunier, Achard, Morcom, & Bullmore, 2008; Meunier, Lambiotte, Fornito, Ershe, & Bullmore, 2009) organization. Due to this hierarchical organization, the brain can be modeled at various scales ranging from the microscale level of the individual neuron to the macroscale level of the complete brain (Jirsa, Sporns, Breakspear, Deco, & Mcintosh, 2010; Hayasaka & Laurienti, 2010). A microscale model of the brain including each of approximately 300 billion neurons would be difficult to implement and to interpret. Such a model would be just as complex as the brain, negating the advantage of producing a more simplified representation. On the other hand, a macroscale model at the whole-brain scale would include a top-down definition of the system. Every behavior of the system would necessarily be individually defined. Between these two extremes lies a mesoscale model, wherein the brain model is composed of interdependent regions performing mesoscale interactions resulting in macroscale behaviors.
We introduce a brain-inspired mesoscale agent-based model that we call the agent-based brain-inspired model (ABBM). The model is built upon a brain network measured using functional brain imaging data from humans. The ABBM uses rules that are based on the microscale level of the neuron and applies those rules at the mesoscale level of pools of neurons. These rules are used by each mesoscale brain region to process the information it receives and make a decision about whether to turn on or turn off. This decision-making process is analogous to a single neuron on the microscale integrating information received from neighboring neurons and firing if the excitation exceeds a minimum voltage. In this way, the ABBM uses principles from the microscale level and applies them to the mesoscale level.
Our proposed framework is a more generalized version of a neural network model, such as that described by Goltsev et al. in (Goltsev, Abreu, Dorogovtsev, & Mendes, 2010). Their model utilized a set of excitatory and inhibitory neurons arranged as a network, and behaviors were driven by equations. The model exhibited oscillatory, chaotic, and critical behaviors. Other equation-based neural network models have demonstrated transitions from disordered chaos to global synchronization (Percha, Dzakpasu, & Zochowski, 2005). Contrary to equation based modeling, our agent-based model utilizes interdependent agents driven by cellular automaton rules. Cellular automata have been studied thoroughly in resources such as (Bak, Chen, & Creutz, 1989; Braga, Cattaneo, Flocchini, & Vogliotti, 1995; Cook, 2004; Wolfram, 2002). It is typical that equation-based and agent-based models are capable of producing similar results, but agent-based models are often considered more intuitive as they produce results that are more easily interpreted (Parunak, Savit, & Riolo, 1998). Edward Fredkin has noted a distinct difference between cellular automata and equation-based models as noted by Robert Wright (Wright, 1988) – “You can predict a future state of a system susceptible to the analytic approach without figuring out what states it will occupy between now and then, but in the case of many cellular automata, you must go through all the intermediate states to find out what the end will be like: there is no way to know the future except to watch it unfold.” Some cellular automata, including Conway’s Game of Life, have been shown to be capable of universal computation (Bak, et al., 1989; Cook, 2004), meaning that these systems are capable of computing any computable sequence and can replicate any computer program.
Some neural network models utilize network structure based on real world systems, such as those in (Goltsev, et al., 2010; Grinstein & Linsker, 2004; Percha, et al., 2005). For example, Grinstein and Linsker (Grinstein & Linsker, 2004) investigated the importance of the underlying network structure in defining the system dynamics of neural networks. Their neural network utilized Hopfield-type dynamical rules and was engineered such that the degree distribution of the network reflected topology that commonly occurs in self-organized networks. This design enabled the neural network to produce synchronous behavior and oscillatory sequences of neural activity commonly seen in experimental data. Likewise, the agent-based brain-inspired model studied here is an extension of the functional brain networks that are currently used to study the functional interactions between brain regions. A functional brain network is a set of nodes and pathways between nodes representing the way in which regions of the brain communicate to perform a task. To clarify, these connections do not necessarily represent physical white matter tracts connecting neuronal cell bodies, but instead represent correlations in functional activity as measured through functional magnetic resonance imaging (fMRI). Functional brain networks are distinct from traditional fMRI data. Traditional fMRI data show which regions of the brain are active during a particular task. In contrast, functional brain networks consider all regions of the brain simultaneously by treating the brain as a network of interconnected and interdependent regions. The distinct advantage of a network-based approach of modeling the brain is that it does not focus on individual brain regions, but evaluates the interactions between all brain regions. This network-based approach has enabled us for the first time to model brain dynamics as described in this paper. In our model, agents are defined by functional network nodes representing brain regions, and functional links between nodes dictate which agents are allowed to interact. The utilization of functional brain networks derived from human data is a major strength of this approach.
While the information received by each node is limited by the number of other nodes connected to it, we show here that this model is capable of producing emergent behavior at the level of the system. We apply this system to well-described test problems and additionally demonstrate the ability of the model to produce a wide range of behaviors. A combination of true brain network structure and cellular automata rules results in model output with a wide dynamic range, and imparts the potential to produce a myriad of brain-like functional states.
2. Methods
2.1 Framework for an agent based brain-inspired model
The agent-based brain-inspired model (ABBM) is an agent-based model with connectivity structure that is derived from brain network data. The underlying brain network dictates which brain nodes can interact with one another by explicitly specifying the existence of connections. The brain nodes can be selected to represent the brain network at different levels, from the level of neurons to anatomical parcellation of the cortex. In this work, each node represents a distinct brain anatomical area defined by the AAL (automated anatomical labeling) atlas (Tzourio-Mazoyer, et al., 2002), and connections between the nodes were determined using fMRI time series data as is described, for example, in (Bullmore & Sporns, 2009). Although we used fMRI data to define connections, the framework may be applied to any functional or structural network derived from other imaging modalities or direct methods such as histology.
2.1.1 Data acquisition and network generation
Networks used for the ABBM were generated using functional brain imaging data from normal humans. Gradient echo EPI images (TR/TE = 2500/40 ms) were acquired over a period of 5 minutes while study participants were lying at rest with eyes closed, resulting in one full-brain volume every 2.5 seconds. The functional time series were then used to generate functional brain networks as described below. Acquisition was performed on a 1.5 T GE twin-speed LX scanner with a birdcage head coil (GE Medical Systems, Milwaukee, WI). The image volumes were corrected for motion, normalized to the MNI (Montreal Neurological Institute) space, and re-sliced to 4×4×5 mm voxel (or 3D pixel) size using SPM99 (Wellcome Trust Centre for Neuroimaging, London, UK).
ABBM generation is depicted in Figure 1. From the fMRI time series data, time courses were extracted from gray matter areas in normalized brain space and corrected for physiological noise by band-pass filtering to eliminate signal outside of the range of 0.009 – 0.08 Hz (Fox, et al., 2005; Heuvel, Stam, Boersma, & Pol, 2008). Mean time courses from the entire brain, the deep white matter, and the ventricles were regressed from the filtered time series in order to correct physiologically confounding noises further. The six rigid-body motion parameters from the motion correction process were also regressed out from the time series to correct for subject motions during the scan. The resulting time series data were averaged in 90 regions of interest (ROIs) as defined by the AAL atlas (Tzourio-Mazoyer, et al., 2002). The AAL atlas segments the cerebrum into 90 anatomical regions. As an example of this parcellation scheme, the medial surface of the frontal lobe is parcellated into 4 regions: the cingulate, paracingulate, marginal ramus, and paracentral regions. Although this parcellation scheme is based on an anatomical segmentation, there is a structure-function relationship where in general the tissue contained in one region tends to be the tissue that is associated with a particular brain function. The structure-function relationship is not one-to-one in that one region is often involved in many tasks, and multiple regions are often associated with one task, but in general this structure-function relationship is present. A complete description of the parcellation is contained in Tzourio-Mazoyer, et al. (2002). The AAL atlas has become very common in ROI-based studies (Bassett, Brown, Deshpande, Carlson, & Grafton, 2011; Braun, et al., 2012; Power, et al., 2011; Wang, et al., 2009).
Figure 1. Creating an ABBM from a functional brain network.
Resting state fMRI data are collected. Voxel time series are extracted for 90 anatomical regions and a Pearson correlation analysis is performed between all possible pairs of nodes. A threshold is applied to prune weak correlations from the correlation matrix. The resulting links represent communication pathways between agents in the agent-based brain-inspired model.
A cross-correlation matrix of 90×90 was then calculated from the averaged time series data. Each value in this cross-correlation matrix represents a functional link between the 90 brain regions. A large correlation between two regions, either positive or negative, is considered as a functional connection between the nodes. The diagonal of the correlation matrix was set to zero in order to avoid self-connections. While there are some strong functional connections in the correlation matrix, the vast majority of correlation coefficients are close to zero. These weak connections can be pruned from the network by applying separate positive and negative correlation thresholds across the correlation matrix to remove weakly correlated positive or negative connections, respectively. There is some debate about how to properly threshold brain networks (Foti, Hughes, & Rockmore, 2011; Rubinov & Sporns, 2011; Wijk, Stam, & Daffershofer, 2010). Ideally, the thresholded network should be sparse, but thresholding should not result in fragmentation of the network as there must be a path of communication between any given node and any other node in the network. We chose to threshold the network at the most stringent positive and negative thresholds that would not fragment the network. These thresholds were +0.3916 for positive correlations and −0.1839 for negative correlations. After determining these thresholds we verified that the connection density was appropriate for a network of this size (Laurienti, Joyce, Telesford, Burdette, & Hayasaka, 2011; Blagus, Subelj, & Bajec, 2011). Some portions of the work described here utilize the full correlation matrix (no correlation thresholds applied), the thresholded correlation matrix, or a signed binary adjacency matrix based on the thresholded correlation matrix.
2.1.2 Building the agent-based brain-inspired model
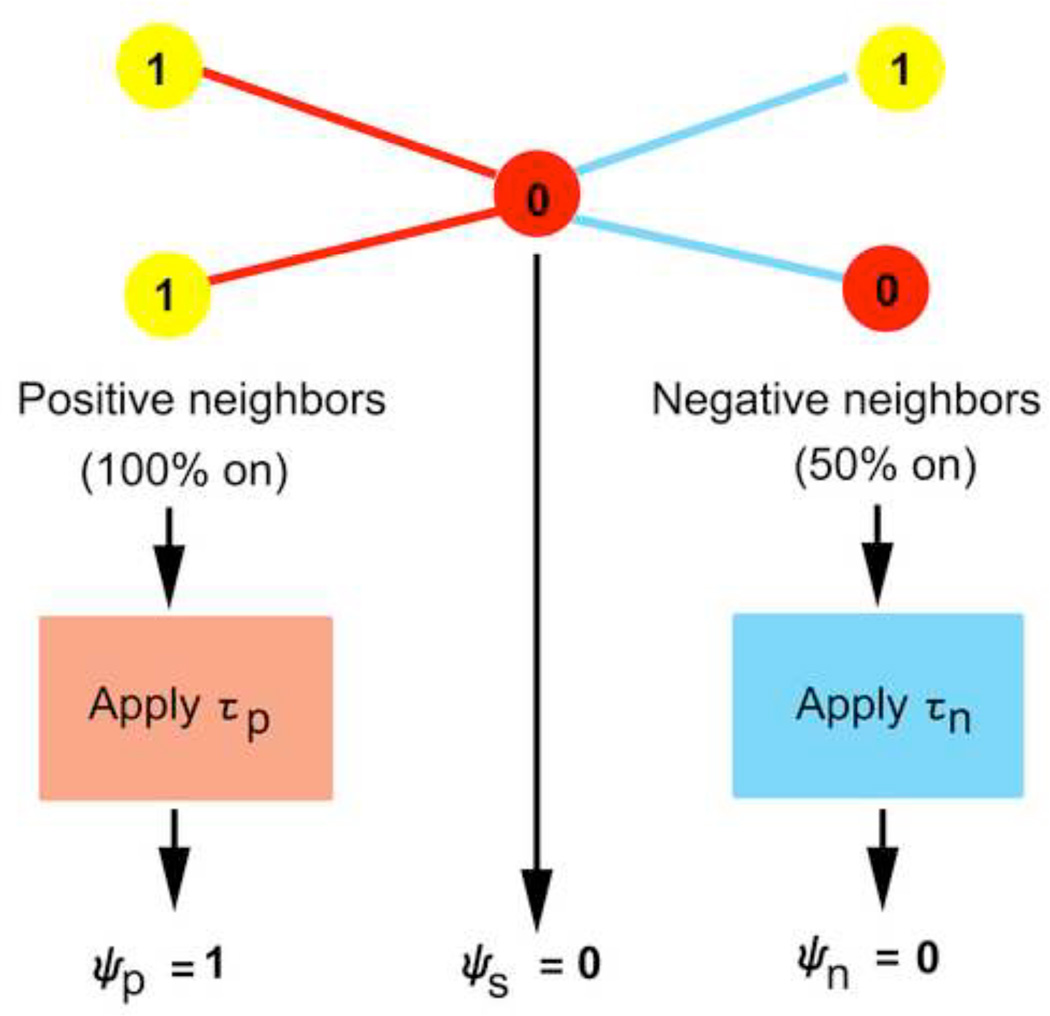
An agent based model is a collection of agents that interact with one another by following simple rules. The rules used here were inspired by the work of Stephen Wolfram (Wolfram, 2002), who has been a major contributor to the study of cellular automata. In this case, agents are represented by the 90 nodes of the brain network, and links represent communication pathways between the agents. In order to succinctly visualize the output of the ABBM by representing the model as a cellular automaton, the 90 nodes of the brain network are arranged on a 1-D grid. Each node has a state, which may be on (active) or off (inactive), and the states update over successive time steps based on the states of connected neighbors. As states update, the new 1-D grid is printed directly below the original one. All nodes are assigned an initial configuration at the start of the simulation, and all nodes are updated simultaneously. A 3-bit neighborhood Ψ is defined for each node based on its current state and the states of the immediate neighbors (Figure 2). These three bits are the positive bit ψp, self bit ψs, and negative bit ψn. The self bit is simply the state of the node itself, and can be either 1 (on) or 0 (off). The positive bit is based on the weighted average of states of all neighbors that are connected by positively-valued correlation links, with correlation coefficients as weights. If this weighted average exceeds some minimum value, called the positive bit minimum τp, then the positive bit, ψp, is set to 1. Similarly, the state of the negative bit ψn is based on the weighted average of states of all negatively connected neighbors of the node. The state of the negative bit ψn is then determined by applying the negative bit minimum τn. Note that the positive and negative bit minima are distinct from the positive and negative correlation thresholds that are applied to the correlation matrix. The correlation thresholds are used to generate sparse connectivity and remove weak or spurious connections. The positive and negative bit minima are used to distill the information received from all positive and all negative connecting neighbors, respectively. Therefore, these minima do not alter the network topology, but instead change a node’s interpretation of its surroundings. The positive and negative bit minima may be user-defined or chosen using an optimization algorithm (see section 2.3 on solving test problems with genetic algorithms). An example of the process of determining the neighborhood of a given node is pictured in Figure 2.
Figure 2. Summarizing the neighborhood of a node into 3 binary bits.
Pictured is the neighborhood for an example node (center node). Red lines indicate positive connections to positive neighbors (two left-most nodes) and blue lines indicate negative connections to negative neighbors (two right-most nodes). Nodes are either on (yellow nodes with values of 1) or off (red nodes with values of 0). The positive bit minimum τp and negative bit minimum τn are applied to the percentage of positive or negative nodes in the on state to determine the value of those bits in the binary neighborhood. In this example, all links are considered equally weighted, but in the ABBM link weights contribute to the percentage of nodes that are on or off.
An intuitive interpretation of the above is that each node receives information from all of its connected neighbors, but the information is weakened if the two nodes are only weakly correlated. Neighbors that are negatively connected are grouped together to form one aggregate negative neighbor. Similarly, neighbors that are positively connected form one aggregate positive neighbor. Given two possible states (on or off) and a 3-bit neighborhood Ψ, 23=8 possible neighborhood configurations exist. Those combinations are shown in Table 1, commonly referred to as a rule table. The top row displays the 8 possible neighborhood configurations at the current time t, and the bottom row displays the state that a node having a given configuration will take in the next time step, t+1.
Table 1.
Rule 110 for a binary neighborhood of size 3.
| Neighborhood Ψ = [ψp,t ψs,t ψn,t] |
1 1 1 | 1 1 0 | 1 0 1 | 1 0 0 | 0 1 1 | 0 1 0 | 0 0 1 | 0 0 0 |
| Next State ψs,(t+1) |
0 | 1 | 1 | 0 | 1 | 1 | 1 | 0 |
The agent-based model can then be iterated over time steps, where all agents are updated simultaneously. The rule shown in Table 1 is just one example, and in fact there are 28 = 256 possible rules for a neighborhood of size 3. This is derived from the fact that there are 23 = 8 possible 3-bit neighborhoods (the top row of Table 1), and the 8 “next states” associated with these 8 neighborhoods (the bottom row of Table 1) can each be either a 1 or a 0. Therefore there are 28 = 256 possible combinations of “next states” that can fill the bottom row of Table 1. By convention, rules are named by the decimal conversion of the binary string of “next states” – in the example shown above, the binary string 01101110 converts to 110 in decimal. The 256 combinations that can fill the bottom row of Table 1 are Rule 0 (00000000) through Rule 255 (11111111).
The state of all nodes at one time describes the system state. Since the ABBM is a deterministic system, meaning there is no randomness, we can exactly predict the next system state using the corresponding rule and system parameters. In other words, if the current state of all nodes in the system is known, there is only one possible state the system can have in the next time step. Note that although each system state can lead to exactly one other system state, multiple system states may lead to a single system state (for example rule 255, where all possible states result in all nodes in the system turning on). The ABBM can be thought of as a generalized form of a Boolean network (Wuensche, 2002) with the brain network playing an important role in state changes. The set of all possible system states comprises the state-space of the system. We can imagine state-space as a diagram resembling a network, which describes all possible system states and the pathways by which the system travels from one state to the next. The system will follow a trajectory as it moves from one state to another. Eventually this trajectory will lead to a sequence of repeating states, which we refer to as an attractor. Often there are multiple entry points into a single attractor, and each attractor is associated with a unique set of system states of the state-space diagram, or a subspace of state-space. This subspace, consisting of all initial states and trajectories leading to a particular attractor, is called an attractor basin.
2.2 Equivalent null models
In order to determine if characteristics particular to the brain network topology drive the behavior of the ABBM, equivalent random networks were generated as null models of the original brain networks. Two null models were created for each brain network. The first null model (null1) was formed in a method similar to that described in (Maslov & Sneppen, 2002). Specifically, the algorithm selected two edges in the correlation matrix and swapped their termini. This method preserved the overall degree of each node without regard to whether connections are positive or negative. The second null model (null2) destroyed the degree distribution by completely randomizing the origin and terminus of each edge in the correlation matrix. Figure 3 shows an example network and the corresponding null models. Where different realizations of the original network were studied (i.e. fully connected, thresholded, and binary), an equivalent null1 and null2 model was made for each realization.
Figure 3. Generating equivalent null models for brain networks.
Panel a shows an original correlation matrix, panel b shows the equivalent null1 model, maintaining the overall degree distribution, and panel c shows the equivalent null2 model, which is a complete randomization and does not maintain degree distribution.
2.3 Evolving rules to solve test problems
We have tested the ABBM on two well-described test problems, namely the density classification and synchronization problems. These tasks have been used previously to show that a 1-D elementary CA can perform simple computations (Back, Fogel, & Michalewicz, 1997). Since the ABBM is based on a functional brain network that has complex topology, and because nodes are diverse in the number of positive and negative connections, this is not an elementary cellular automaton. Therefore, we have performed these tests in the ABBM to show that it too is capable of computation.
The goal of the density classification problem is to find a rule that can determine whether greater than half of the cells in a CA are initially in the on state. If the majority of nodes are on (i.e. density > 50%), then by the final iteration of the CA, all cells should be in the on state. Otherwise, all cells should be turned off. The ABBM should be able to do this from any random initial configuration of on and off nodes. For the synchronization task, the goal is for the CA to synchronously turn all nodes on and then off in alternating time steps. As in the density classification problem, the CA should be able to perform this task from any random initial configuration. These problems would be trivial in a system with a central controller or other source of knowledge of the state of every node in the system. However, in the ABBM each node receives limited inputs from only a few other nodes in the network. Each node must decide based on this limited information whether to turn on or off in the next time step, resulting in network-wide cooperation without the luxury of network-wide communication.
It has been demonstrated by others (Das, Crutchfield, Mitchell, & Hanson, 1995; Mitchell, 1998; Mitchell, Crutchfield, & Das, 1997) that these problems can be solved by finding an appropriate rule through genetic algorithms (GA). Genetic algorithms exploit the concept of evolution by combining potential solutions to a problem until an optimal solution has been evolved. In general, a GA begins with an initial population of individuals, or chromosomes. These individuals are potential solutions to a given problem, and their suitability is quantified by a fitness function. Typically the fittest individuals, those that produce the highest fitness, survive and reproduce offspring. Each offspring is a new solution resulting from a crossover of the parents’ chromosomal materials; each progenitor chromosome consists of components taken from two parents, ideally incorporating desirable characteristics from both. Offspring may be subject to mutations, which diversify the genetic pool and lead to exploration of new regions of the solution space. Mutations that increase the fitness of an individual tend to remain in the population, as they increase the probability that those individuals will survive and reproduce offspring. This process of evaluating fitness, selecting parents, reproducing, and introducing mutations is repeated for a number of generations. For an excellent review of genetic algorithms, we refer readers to (Mitchell, 1998).
Genetic algorithms were implemented to solve the two test problems as described in (Back, et al., 1997) with minor modifications to suit the ABBM. For both the density classification and synchronization problems, the initial population was composed of 100 individuals. Each individual contained 22 binary bits, where bits 1–7 represented the value of τp, bits 8–14 represented the value of τn, and bits 15–22 represented the 8-bit rule. The initial values for each variable were generated with uniform random probability. At the beginning of each generation, each chromosome was tested on 100 unique initial configurations (system states). These initial configurations were designed to linearly sample the range of densities from 0 to 100%. The fitness was calculated as the proportion of initial configurations for which the ABBM produced the correct output, and ranged from 0 to 1. The individuals with the top 20 fitness values were selected for crossover. An additional 10 individuals were selected at random from the bottom 80 individuals in order to increase exploration of the solution space. These 30 individuals were saved for the next generation, and the remaining 70 individuals were generated by performing single-point crossover within each variable. Each offspring was mutated at three randomly selected points, where the bit is reversed from 0 to 1 or 1 to 0. The genetic algorithm was iterated for 100 generations. To avoid convergence on a poor solution, the mutation rate was increased when the mean hamming distance of the population was below 0.25 and the fitness was less than 0.9. In such cases, the mutation rate was randomly increased to 4 – 22 bits per chromosome. These changes to the genetic algorithm increased the average maximal fitness level from about 0.65 to about 0.85.
Brain networks studied in the current literature are sometimes left as fully connected correlation-based networks, e.g. (Rubinov & Sporns, 2011), and often they are thresholded to remove spurious connections while retaining the connection strengths of the remaining connections, e.g. (Fransson & Marrelec, 2008). Most commonly the networks are binarized into adjacency matrices, such as in (Achard, Salvador, Whitcher, Suckling, & Bullmore, 2006; Bullmore, et al., 2009; Burdette, et al., 2010; Joyce, Laurienti, Burdette, & Hayasaka, 2010). Modified network architecture may significantly impact the ability of the ABBM to solve these test problems. As there is no consensus on the correct treatment of the correlation matrix, here the ABBM is studied in all three forms.
3. Results
3.1 Characterization of the ABBM
The behavior of the agent based brain-inspired model is governed by an 8-bit rule, the positive bit minimum τp, and the negative bit minimum τn. Here we investigate the effects of these factors on output patterns of the ABBM.
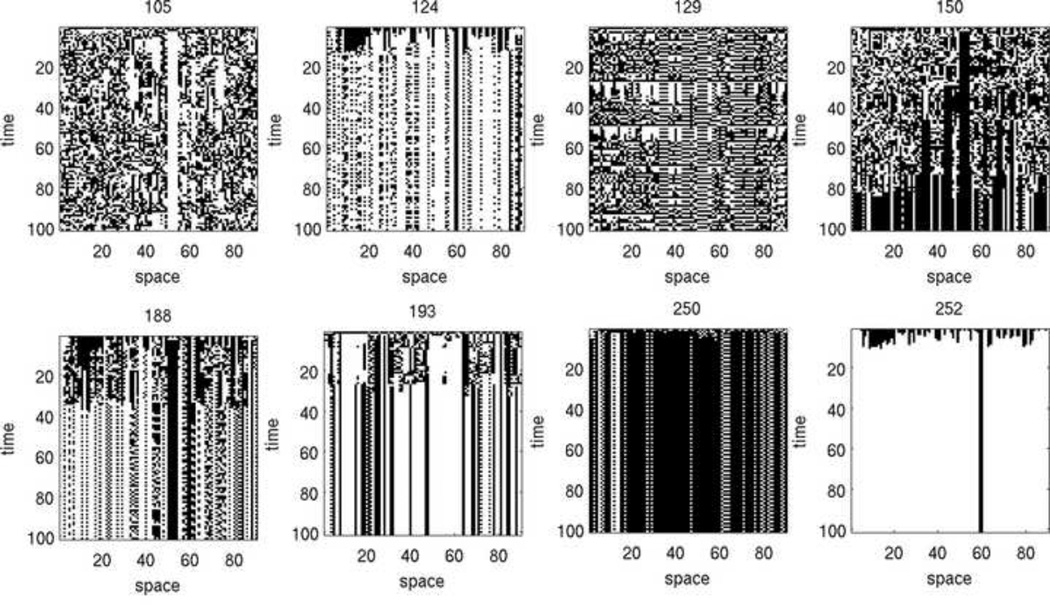
Output patterns are visualized as space-time diagrams, in which nodes are represented horizontally as columns consisting of white (on) or black (off) squares, and each time step is shown as a new row appended below the previous one. Rule diagrams were generated, showing output of the ABBM for rules 0 through 255, starting from the same initial configuration of 30 randomly selected nodes being on, and at fixed values of τp and τn. These rule diagrams are shown in full in Supplemental Material 1, but a selection of rules is shown in Figure 4.
Figure 4. Output of ABBM using a selection of rules.
Each rule started from the same initial configuration (30 randomly selected nodes were turned on). The positive bit minimum τp and negative bit minimum τn were both set to 0.5. The ABBM is capable of producing a diverse range of behaviors depending on the 8-bit rule specified.
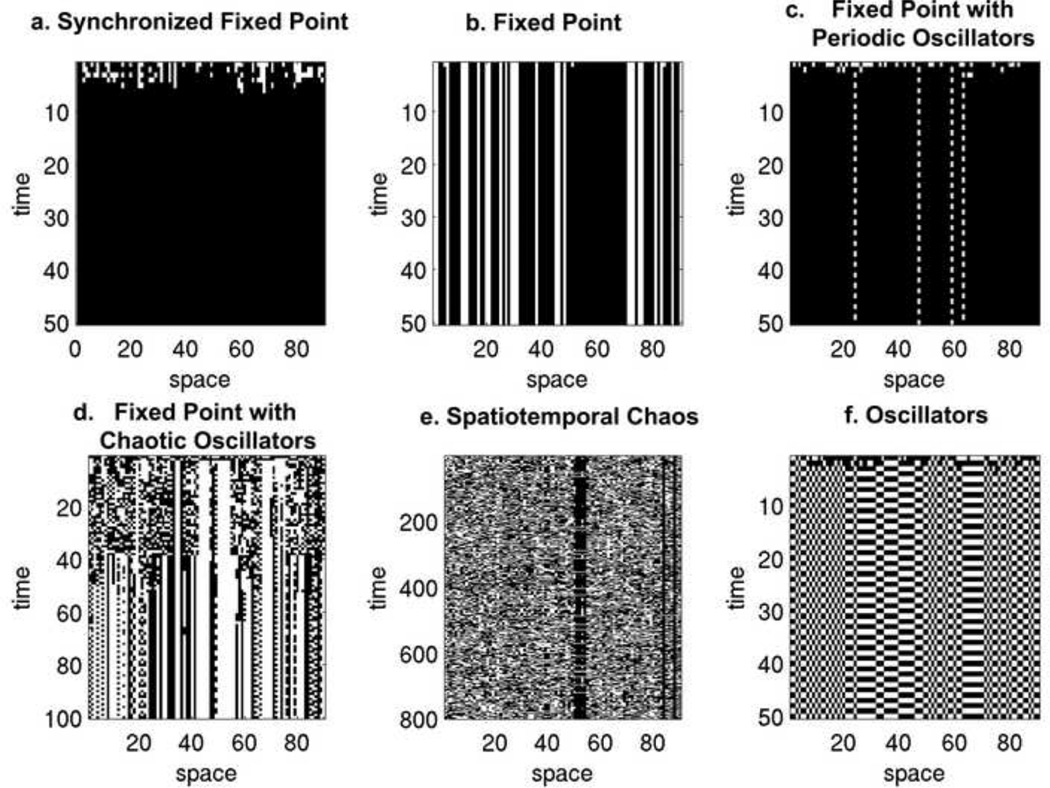
Importantly, the spatial arrangement of cells in the space-time diagrams does not reflect the configuration of nodes in the network, as each node shares connections with other nodes that may be located anywhere in the brain network. As such, the spatial patterns that have historically been used to classify elementary cellular automata (e.g. (Wolfram, 2002)) cannot apply here. Instead, we have adapted the classification scheme introduced by Mahajan & Gade (2010) (Mahajan & Gade, 2010), who used cellular automata to study coupled circle maps as networks. We have expanded their classification scheme (synchronized fixed point, fixed point with periodic orbit, fixed point with chaotic orbit, and spatiotemporal chaos) to include two additional output categories (fixed point, oscillators). These classifications are shown in Figure 5.
Figure 5. Output phases of the agent-based brain-inspired model.
All space-time diagrams began at a randomly generated initial configuration in which 30 nodes were initially on. a: Synchronized fixed point, Rule 98, τp = 0.3, τn = 0.4. b: Fixed point, Rule 98, τp = 0, τn = 1. c: Fixed point with periodic oscillators, Rule 98, τp = 0.5, τν = 0.5. d: Fixed point with chaotic oscillators, Rule 97, τp = 0.4, τn = 0.2. e: Spatiotemporal chaos, Rule 158, τp = 0.4, τn = 0.9. f: Oscillators, Rule 50, τp = 0.3, τn = 0.3.
Synchronized fixed point is shown in panel a, where all nodes take the same state. In panel b, the ABBM is in the fixed point phase, where nodes can be either on or off, but do not change in subsequent time steps. In panel c, steady state is reached after a few time steps and is characterized by fixed point nodes with some nodes perpetually oscillating between states. Fixed point with chaotic oscillators is shown in panel d, in which the system undergoes an extended period of state changes with no obvious pattern, until steady state is eventually reached. Panel e depicts spatiotemporal chaos, in which the system may continue for hundreds of thousands of steps without repeating states, until finally steady state is reached. Finally, panel f depicts the phase in which all nodes in the system are oscillating between two states.
This classification scheme enables the qualitative description of the output of the ABBM, and also brings two observations to light. First, and unsurprisingly, modifying the underlying ABBM rule modulates the output of the model. Second, the same rule can cause dramatically different behavior depending on the model parameters τp and τn. We further explored this effect by modifying these parameters and observing the output of the model. We quantified the model output using two metrics: the number of steps for the system to reach steady state, and the period length at the steady state, which may either be constant or oscillatory. The outcome metrics are summarized as color maps where each data point corresponds to an outcome metric value of the ABBM corresponding to the model parameters τp and τn on the x- and y-axes, respectively. Simulations at each point on the color maps began at the same initial configuration of nodes being on or off. It is important to hold the initial configuration constant within each color map as different initial configurations can change the time to reach a steady state as well as the steady state period length (see 3.2 on attractors).
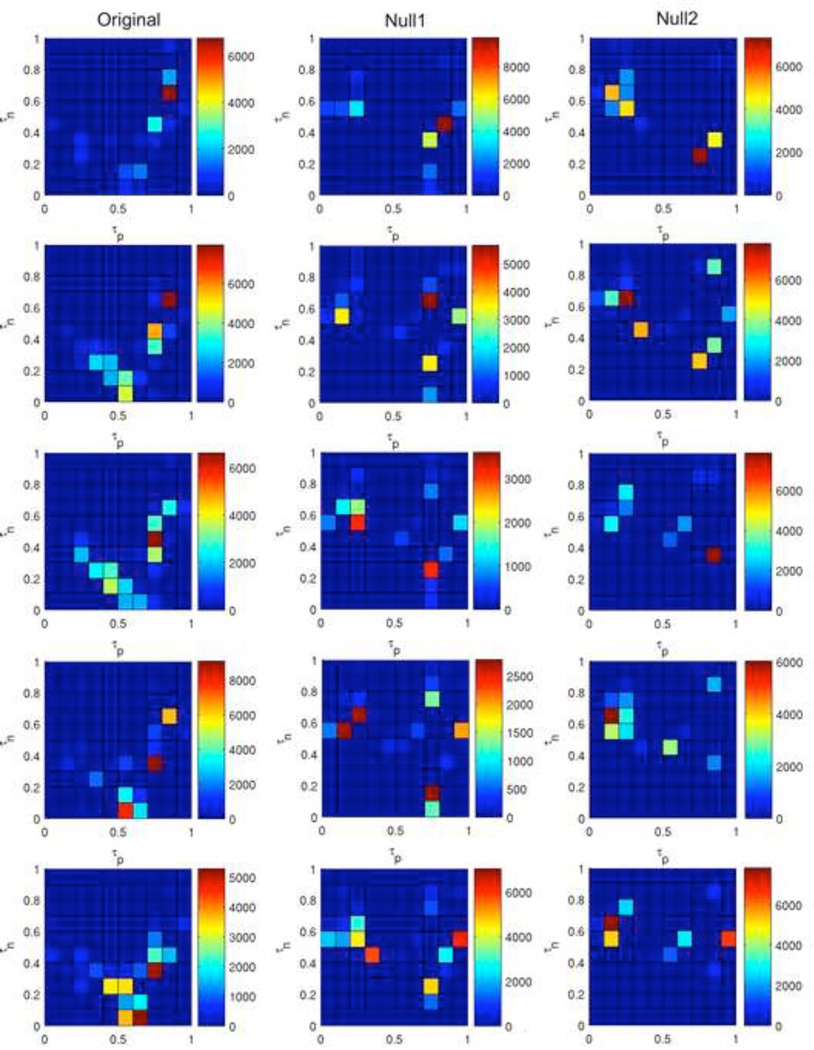
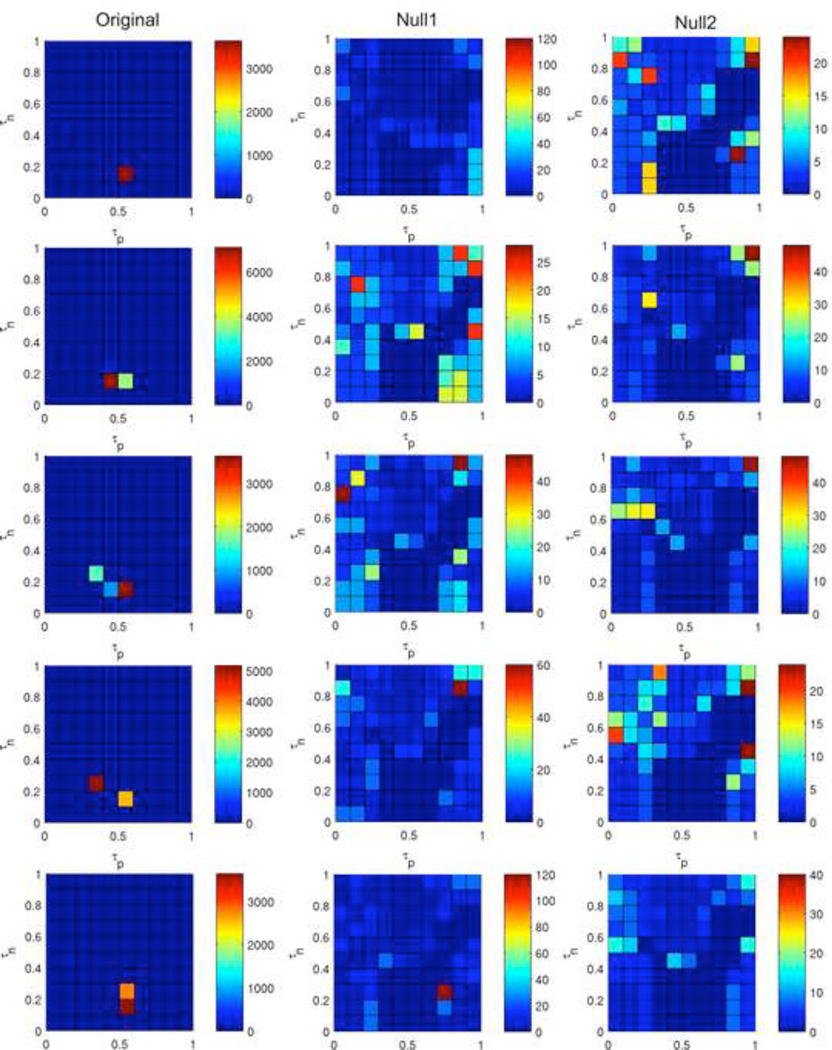
Figure 6 shows the number of steps for the ABBM to reach a steady state, starting from 5 distinct initial states. These results demonstrate a wide range of behaviors that can be elicited by varying just two model parameters, τp, and τn. These results are for just one rule, Rule 41, out of the 256 possible 8-bit rules. Although these color maps reveal a wide range of behaviors, the overall qualitative properties are fairly consistent across initial configurations. There are distinct regions in which the system takes a few thousand steps to settle, regardless of the initial configuration of the system. Importantly, the color maps are not the same for the null models, providing evidence that the network structure shapes the ABBM behavior.
Figure 6. Color maps summarizing the number of steps necessary for the ABBM to reach a steady state using Rule 41.
Each color map displays the number of steps necessary for the system to settle into a steady state behavior starting from 5 initial configurations. The positive and negative bit minima τp and τn are represented on the x- and y-axes, respectively. Maps were generated using the original brain network (left column), the null1 model (middle column), which randomizes connections while preserving degree distribution, or the null2 model (right column), which is a complete randomization of the network.
Figure 7 shows the period length of the steady state behavior resulting from the experiments in Figure 6. For the original brain network, there is a concentrated region where the period of the steady state behavior (i.e. the attractor into which the system has settled) is very long, and the output landscape is qualitatively consistent across initial configurations. The outputs of the null models are very different from those of the original network. There are no regions exhibiting extremely large periods (in excess of 1000 time steps). When the data range of the color bar in the original network is set to match that of the null networks, the detail at lower period ranges is qualitatively similar (Figure 8). While very large periods may be possible in random networks using Rule 41, there are strikingly different results for the brain network versus the null models for the conditions shown here. This further demonstrates that the network structure is vital for determining the behavior of the ABBM.
Figure 7. Color maps summarizing the period length of the steady state behavior of the ABBM using Rule 41.
Each color map displays the period length of the steady state behavior, starting from the same five initial configurations used in Figure 6. Maps were generated using either the original brain network (left column), the null1 model (middle column), which randomizes connections while preserving degree distribution, or the null2 model (right column), which is a complete randomization of the network.
Figure 8. Top row of Figure 7, rescaled so that all color maps have the same color mapping.
When the data range of the color bar in the original network is set to match that of the null networks, the detail at lower period ranges is qualitatively similar.
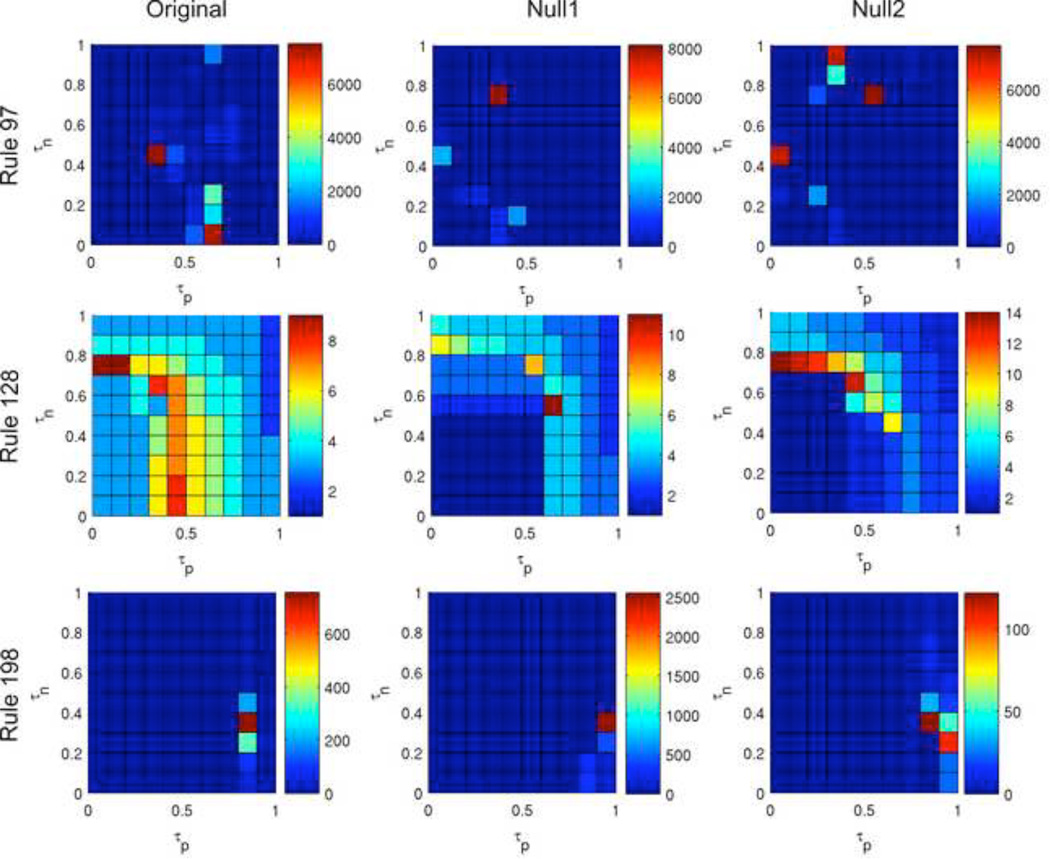
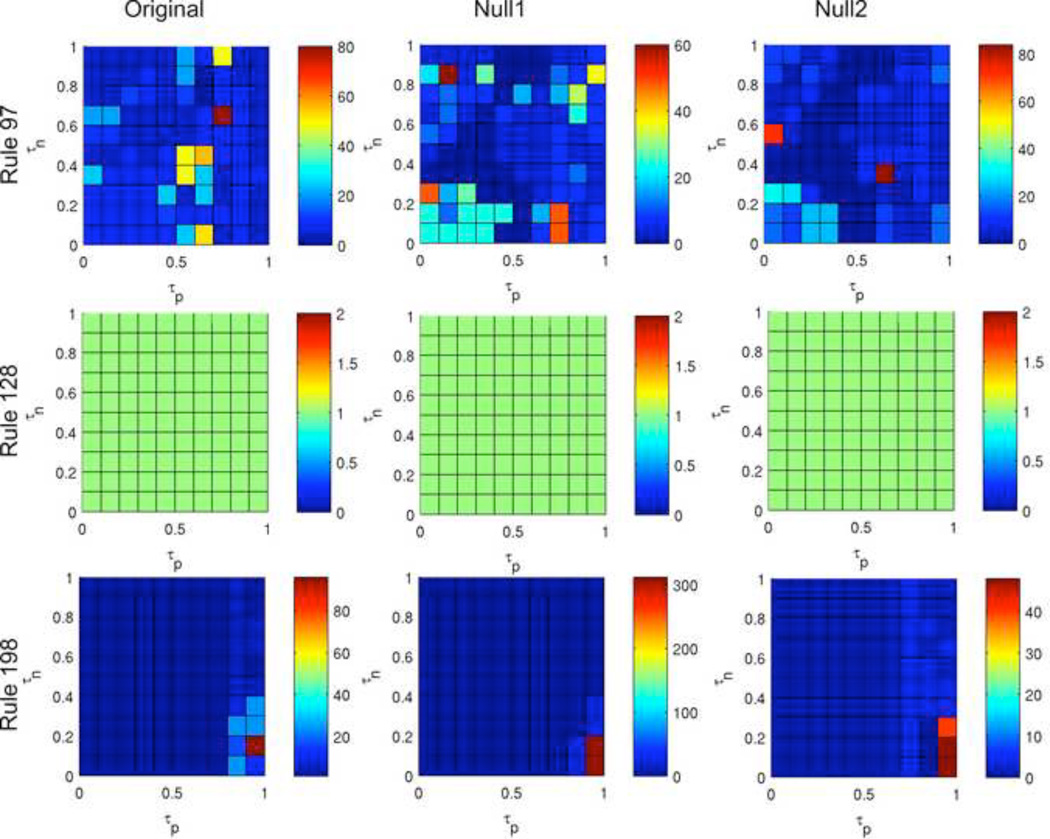
Figure 9 and Figure 10 demonstrate the variability in the ABBM output across rules. While in Rule 41, results using the original network are very different from using the null networks, in Rules 97, 128, and 198, the overall characteristics of the color maps are similar between the original network and the null models (although critical peaks in rules 97 and 198 occur at differing τp and τn values). The network structure appears to be less crucial to ABBM behavior using these rules. Color maps for all rules can be found in Supplemental Material 2.
Figure 9. Color maps summarizing number of steps to reach a steady state for three rules.
Outputs for rules 97 (top row), 128 (middle row), and 198 (bottom row) are shown for the original brain network (left) and the null1 (center) and null2 (right) random models. Each color map was generated using the same initial configuration.
Figure 10. Color maps summarizing period length for three rules.
Outputs for rules 97 (top row), 128 (middle row), and 198 (bottom row) are shown for the original network (left) and the null1 (center) and null2 (right) random models. Each color map was generated using the same initial configuration used in Figure 9.
3.2 Attractors
The size of an attractor can be considered as analogous to the period lengths reported in Figure 7 and Figure 10. Ideally, to visualize the landscape of attractors we would visualize the state diagram as a network as in (Hanson & Crutchfield, 1992; Wuensche, 2002). However, since there are 290 possible states per state diagram in our ABBM, with each rule having a different diagram, there is no simple way to visualize the complete state-space. Current algorithms for visualizing the entire state-space are not designed for such large systems (Wuensche, 2011). An alternative approach to visualizing the attractor landscape is to repeatedly run the model from random initial configurations and track the state changes (i.e. time-space diagram). This methodology is very similar to the statistical approach to exploring state-space that is presented in (Wuensche, 2011). Although the complete state-space is not constructed, this method can reveal instances where there are multiple points of entry into a particular attractor and can also give information about the state-space landscape; some landscapes may be composed of millions of 2-state attractors with just three or four states leading into each one, while others may contain a small number of large attractors containing hundreds of thousands of states or more.
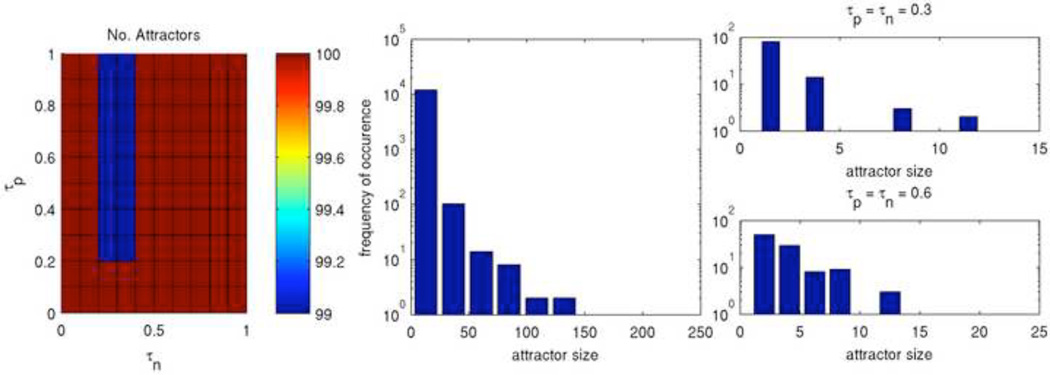
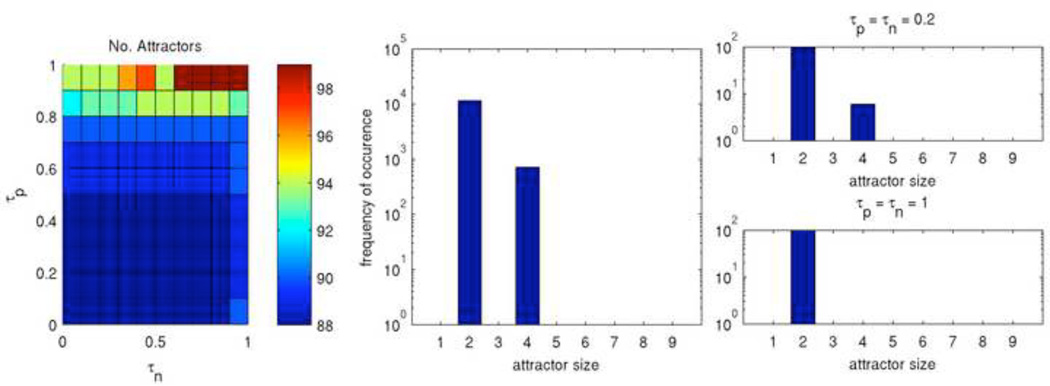
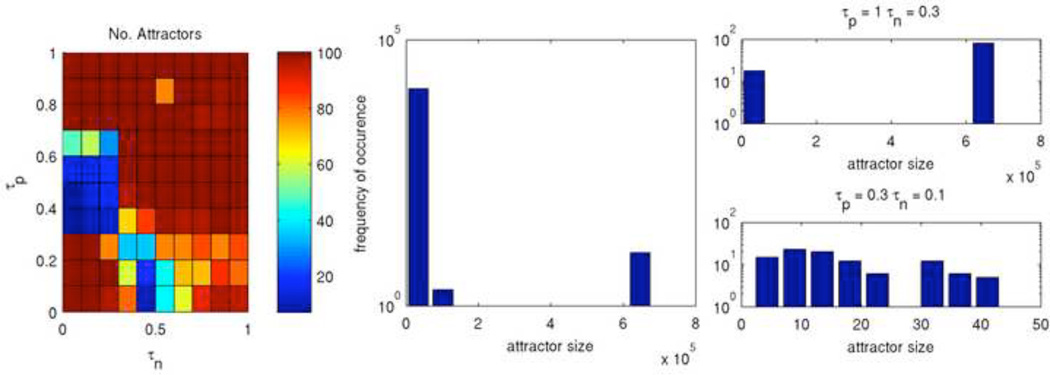
The ABBM was run from 100 different initial configurations and the results are visualized in Figure 11, Figure 12, and Figure 13 for three qualitatively different rules. Figure 11 shows Rule 198 with long times to settle as well as a concentrated region of large attractors. The color map (left) shows the number of unique attractors that were found out of 100 runs at each point in τp – τn space. At each point, with only a few exceptions, unique initial configurations led to unique attractors. The histograms show the frequency of occurance of attractors sorted by their period lengths for the entirety of τp – τn space (middle) and for two selected points (right). Interestingly, the frequency of attractor sizes across all of τp – τn space appears to follow a power law, although only two orders of magnitude are shown. Since the attractor sizes vary greatly, the attractor landscape of Rule 198 is very diverse.
Figure 11. Attractors of Rule 198.
Shown are the number of unique attractors found at each point in τp – τn space (left) as well as the frequency of occurance of attractors sorted by size for the entirety of τp – τn space (middle) and for two selected points (right).
Figure 12. Attractors of Rule 27.
Shown are the number of unique attractors found at each point in τp – τn space (left) as well as the frequency of occurance of attractors sorted by size for the entirety of τp – τn space (middle) and for two selected points (right).
Figure 13. Attractors of Rule 41.
Shown are the number of unique attractors found at each point in τp – τn space (left) as well as the frequency of occurance of attractors sorted by size for the entirety of (middle) and for two selected points in (right) τp – τn space.
Figure 12 shows Rule 27, with both short times to settle and short periods. The color map (left) showing the number of unique attractors demonstrates that typically each initial configuration led to a different attractor, with only a few repeated attractors. The histograms (center, right) show that these attractors are somewhat homogenous in terms of size. Since Rule 27 consistently has a short settle time and a short period, we can conclude that its attractor landscape consists of a very large number of isolated short attractors with just a few states leading to each. We qualitatively classify this as a very simple rule.
Conversely, Rule 41 (Figure 13) demonstrated an impressively diverse landscape. The number of unique attractors is highly variable; in some portions of τp – τn space a different attractor was encountered with each initial configuration, while in other locations the same 10 to 20 attractors occur repeatedly. The two point-of-interest histograms (Figure 13, right) examine specific locations of τp – τn space in greater detail. The upper plot was generated from a location where a different attractor was found for each initial configuration. The lower plot was generated from a location that had many occurrences of a particularly large attractor – one having a period of over 680,000 steps. We conclude that Rule 41 is a very complex rule, as it is difficult to predict the type of behavior the system will elicit. We have examined only three rules here, but the color maps included in Supplemental Material 2 are good indicators of the type of attractor landscape belonging to each rule. Rules that tend to have rapid settle times and short periods are fairly simple rules, while those that have settle times and period lengths that span many orders of magnitude tend to be complex, meaning that their behavior is very difficult to predict.
3.3 Problem-Solving with the ABBM
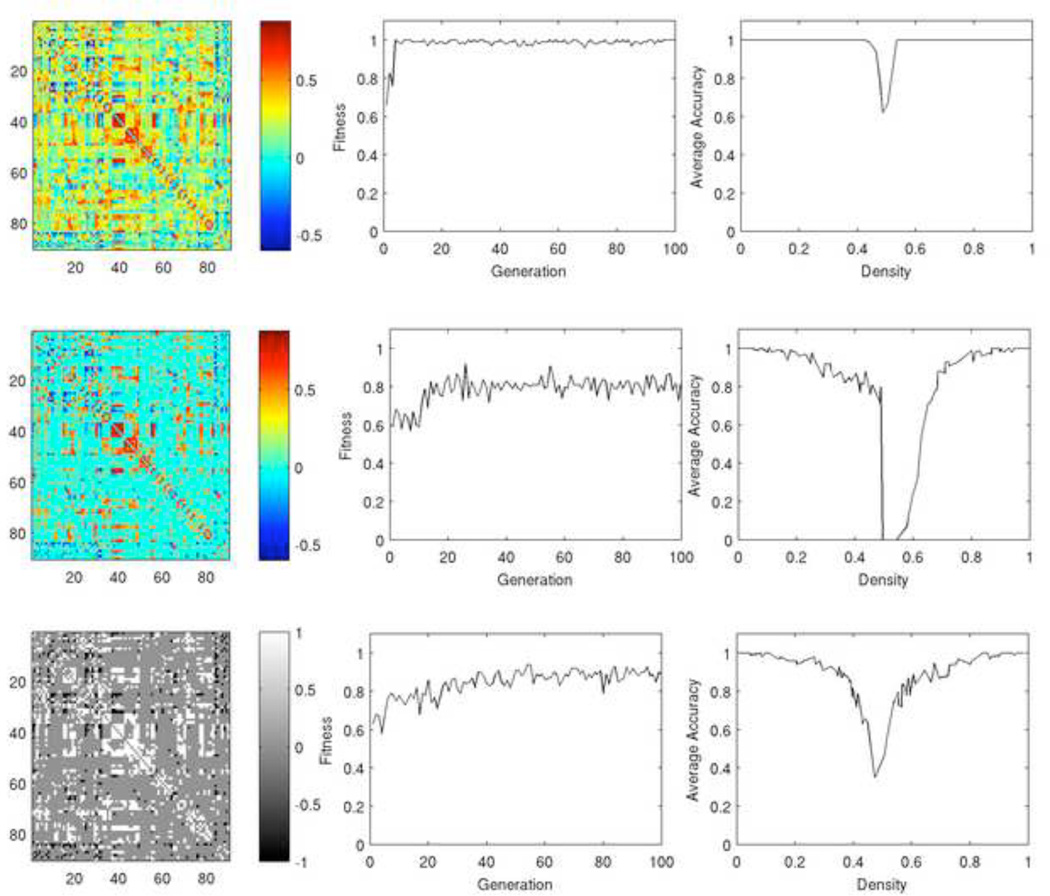
Density classification results for the ABBM are shown in Figure 14. The genetic algorithm was run using the original fully connected network, the thresholded brain network (thresholded such that the average degree was 20.8), and the binary brain network (derived from the thresholded correlation matrix). Their connectivity matrices are shown in Figure 14, left. For these networks, an optimal rule and set of parameters were sought using the GA, and their results were compared. Figure 14 shows the plots of the highest fitness individual in each generation of the GA (middle column) and the performance of the best individual on the density classification task, quantified by average accuracy (right column).
Figure 14. Density classification using the ABBM.
Results are shown for the fully connected network (top), thresholded brain network (middle), and binary brain network (bottom). The fully connected network achieves the highest maximum fitness, does so in the fewest number of GA generations, and has the greatest accuracy in classification over a range of densities.
Using the fully connected network (Figure 14, first row), the ABBM achieved a fitness value of 1 after just 4 generations. In this network, each node obtains information about all other nodes in the network. Although this information is modulated by the connection strength, each node has global information about the state of the system. Such a network is not solving a global problem using limited local information so it is not surprising that the model was able to solve the density problem with high speed and accuracy. Most naturally occurring networks, including the brain, are sparsely connected and each node only has information from its immediate neighbors. The thresholded brain network (Figure 14, second row) and the binary network (third row) are more consistent with the connectivity of the brain. In our model, information at each node is limited to 20.8 nodes out of 90 nodes on average, or about 24% of the network. Furthermore, removing weak links from the network results in groups of nodes that are well interconnected among themselves and less interconnected with the rest of the network, a property known as community structure (Girvan & Newman, 2002). Information is shared within a community, and community nodes likely tend to synchronize states with each other more readily than with other network nodes. Therefore one community that is only weakly connected to the rest of the network may not be consistent with the remainder of the network, as is seen in the time-space diagrams in Supplemental Material 3. Consequently fitness is lower, with the thresholded brain network achieving fitness values of approximately 80%, and the binary network achieving maximum values of approximately 87%.
Accuracy curves (Figure 14, right) are shown for the highest performing individual at the final generation of the GA. These curves plot the percent of correct classifications, averaged over 100 initial configurations, across a range of densities on the x-axis. The trends in accuracy curves follow expectations based on the GA fitness results, with the fully connected network performing the best, followed by the binary network, and finally the thresholded network. In each curve, there is a pronounced dip centered at around 50% density, where classification is most difficult.
There is a notable decrease in fitness and accuracy for the weighted, thresholded network as compared the corresponding binary, thresholded brain network. We speculate that this is due to relatively weak links connecting some modules to the rest of the network. These links may be too weak to convey sufficient information about the rest of the network within our model, causing nodes to behave based largely on limited information. While some links are strong enough to survive the thresholding process, the net signal from multiple weak links may be too weak to allow the signal to exceed the positive or negative bit minima, τp or τn, and pass the signal on. The amount of information available to any one node in the system is greatest in the fully connected weighted network since each node receives some degree of information from each other node. When a threshold is applied to the weighted network, many of these connections are removed and the node relies solely on local information, modulated by connection strength. When this network is binarized, the signal is not modulated by connection strength and is therefore more strongly represented. We reiterate that there is no consensus on network representation. Proponents of binarized networks argue that neuronal firing is a binary event and therefore binary networks are appropriate models. Proponents of weighted brain networks argue that signal correlations indicate the contribution of each node to the information received by a particular node, and therefore weighted networks are most representative of biological processes. We suggest based on the findings in Figure 14 that the binary representation may be most effective for information processing, as each node receives local information about the system, as is true for individual neurons, and this input is strong enough to provide sufficient information for the decision making processes.
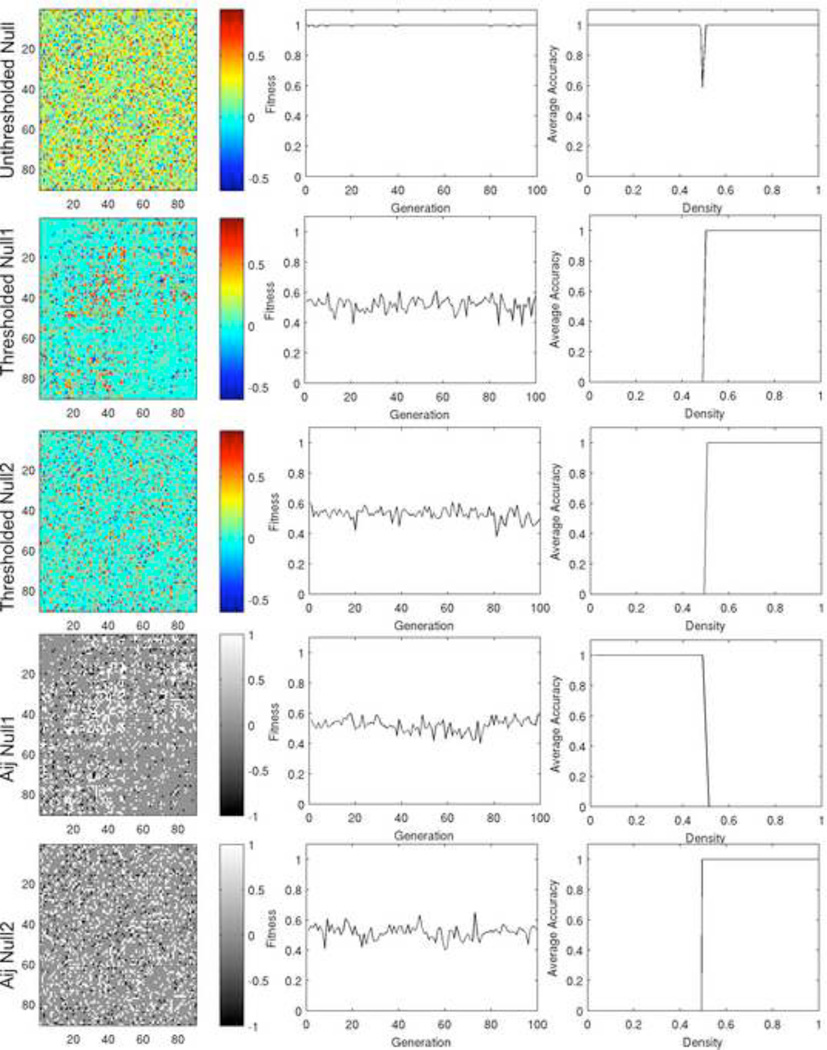
Density classification was also performed using the null networks, (Figure 15) including a fully connected null network, a thresholded null1 and null2 network, and a binary null1 and null2 network. The GA was run on each network as described for the original networks. The fully connected null model was generated by randomly swapping off-diagonal elements of the original correlation matrix, resulting in a network whose connections strengths are random. The thresholded null1 and null2 models were created as described in the methods section. The binarized null models were created from the corresponding thresholded null models by setting links with values greater than zero to 1, and links with values less than zero to -1. As was true in the original networks, the fully connected model performs the best out of all null models because each node receives some degree of information from every other node in the system.
Figure 15. Density classification using null network models.
Results are shown for a fully connected randomized network (row 1), thresholded null1 (row 2) and null2 (row 3) models, and the corresponding binary networks (rows 4 and 5 respectively). The left column shows the connectivity matrix for the null network models. The middle column shows the maximum fitness over generations of the GA. The right column shows the average classification accuracy over a range of densities of on nodes. Only the fully connected null model was able to consistently solve the density-classification problem over a range of densities.
In contrast, the GA was unable to find a rule that was capable of solving the density classification problem for the thresholded and binary null models (Figure 15, rows 2–5). This is true regardless of whether the degree distribution is preserved. The rules evolved by the GA always turn all nodes on or all nodes off. These results indicate that the architecture of the brain network is suited for computation and problem solving, far more so than a random network. The ABBM model parameters used to produce each case in Figure 15 are shown in Table 2. Supplemental Information 3 contains the time-space diagrams at each density.
Table 2.
ABBM parameters for solving the density classification problem.
| Original networks | |||
|---|---|---|---|
| τp | τn | Rule (binary form) | |
| Full Correlation | 0.51 | 0.74 | 250 (11111010) |
| Thresh. Correlation | 0.6 | 0.69 | 250 (11111000) |
| Binary | 0.5 | 0.51 | 248 (11111000) |
| Null models | |||
| Null2 Full Corr. | 0.49 | 0.29 | 160 (10100000) |
| Null1 Thresh. Corr. | 0.93 | 0.9 | 93 (01011101) |
| Null2 Thresh. Corr. | 0.38 | 0.36 | 23 (00010111) |
| Null1 Binary | 0.87 | 0.48 | 10 (00001010) |
| Null2 Binary | 1.0 | 0.16 | 37 (00100101) |
Results for the performance of the ABBM on the synchronization task are shown in Supplemental Information 4. Regardless of the type of functional network used, the population achieved maximal fitness values within the first few generations of the GA. The chromosome at the final generation of the GA was able to perform synchronization from any of the tested initial configurations across densities. The same is true for each of the null models. These findings indicate that the synchronization task is a far easier problem for the ABBM than the density classification problem. In order to solve the synchronization task, the ABBM must first turn all nodes either on or off, and then alternate between all nodes being on and all off. The first and last bit of the rule encodes this alternating behavior, and the middle 6 bits encode the process of getting to one of those two states, with either all on or all off being acceptable regardless of initial density. Thus the encoding in the middle 6 bits may be somewhat flexible. On the other hand, in the density classification task the ABBM must decide whether to turn all nodes on or all nodes off based on the initial state. This more challenging task requires not only memory of the initial configuration, but communication of the global past configuration to all nodes in the system.
Here we compared the ABBM to two null models with randomized connectivity. A third null model, a latticized weighted network, is presented in Supplemental Information 5.
4. Discussion
Here we have presented a new dynamic brain-inspired model that is based on network data constructed from biological information, as well as an expanded classification scheme for model output. Time-space diagrams and color maps characterize the behavior of the model depending on the rule and parameter values. The results presented here demonstrate that the model is capable of producing a wide variety of behavior depending on model inputs. This behavior is largely driven by the rule and location in τp-τn space, and is qualitatively consistent across initial configurations, although different attractors are often reached from different initial states. We further explored the attractor landscape, and discovered that the time to settle and period are good indicators of the type of attractor landscape for each rule. Rules that have settle times and period lengths that span many orders of magnitude tend to have very diverse attractor landscapes, and their behavior is difficult to predict. Finally, we solved two well-described problems, the density classification problem and synchronization problem (Supplemental Information 4). An exciting finding was that the brain network was far more successful in solving density problems than the equivalent null models with randomized connectivity. The ability to solve these tasks demonstrates that the network architecture is amenable to problem solving and the model can support computation. These simple test problems served to exemplify that among all the behaviors that can be produced, some are computationally useful.
We introduced the notion of a complex system as one composed of interconnected components which are typically quite simple, but when assembled as a whole exhibit emergent behavior that would not be predicted based on the behavior of each individual component alone (Mitchell, 2009). We have shown that the ABBM can produce emergent behaviors that cannot be predicted without running the model and observing the behaviors. Recall from earlier Edward Fredkin’s statement on agent based models, that “there is no way to know the future except to watch it unfold”. Each agent follows an extremely simple 8-bit rule. By following these simple rules, very complex and unpredictable behaviors can emerge.
A complex system, as described by Scott Page (Page, 2010), is one that is diverse, adaptive, interconnected, and interdependent. The ABBM is diverse both in its connectivity and its dynamics. Diversity in connectivity arises from the variation in the degrees of nodes and the distribution of link weights. The diversity in dynamics arises from the dependence of the output on the rule, parameters, and initial configuration. The GA allows the ABBM to be adaptive. The goal behavior dictates which rules and parameters are selected by the GA to be used to drive the ABBM. The network structure on which the ABBM is based allows for the interconnectivity of agents. The small-world architecture specifically allows for clustered connectivity so that information is shared among local neighbors and long range connectivity so that information may also spread globally. Finally, the rules of the ABBM necessitate the interdependence in that the behavior of one node is impacted not only by its previous behavior, but also by the behavior of all of its connected neighbors.
The ABBM is distinct from typical applications of artificial neural networks, where the architecture is engineered with a particular problem in mind and therefore these systems typically do not have a biologically relevant structure. The agent-based brain-inspired model utilizes brain connectivity information constructed from human brain imaging data. By using functional brain network connectivity, the ABBM is generalized to solve different tasks without altering the network structure, but instead by altering the dynamics by changing the rule and model parameters. The model uses basic knowledge of how the brain works at the neuronal level, but applies this knowledge on the mesoscale level of brain regions. Since the network structure is based on actual human brain networks, the system dynamics are specific to that architecture.
In widely-used equation based modeling techniques, such as modeling of a disease epidemic or population dynamics in a particular ecosystem, partial differential equations are used to model the behavior of each constituent of the system. On the other hand, in the ABBM, only a set of simple rules is defined for each agent constituting the system, and we simply observe the behavior of the system over time by allowing the agents to interact with each other. Aside from the rules each agent follows, agents’ interactions are constrained only by the underlying brain network structure to model the mesoscale interaction among various brain areas. Simply changing the rule or varying model parameters slightly can result in dramatic changes in the system behavior, from simple synchronization to spatio-temporal chaos.
Genetic algorithms were paired with the agent-based model framework to find a rule and optimized parameters to drive the model. The application of genetic algorithms to the brain network promotes the emergence of behaviors rather than relying on previously learned or programmed responses to specific stimuli. This allows the ABBM to adapt to new and unlearned problems. The parameters determined by the genetic algorithm drive the ABBM to a particular type of attractor. Given a properly defined fitness function, genetic algorithms (or other search optimization techniques) may be used to find a rule and set of parameters that will drive the ABBM to attractors corresponding to functionally relevant states. For example, the model may be able to produce an attractor resembling typical brain activity patterns during rest or under sensory stimulation. A dynamic model that produces biologically relevant behavior would be useful among a range of neurological and artificial intelligence research areas.
As it is presented here, the model utilizes a 90-node functional brain network constructed from resting state data, but any type of network can be used (functional or structural, directed or undirected, weighted or unweighted, and generated from any task). Recently, questions have been raised on the validity of ROI-based data, and it has been suggested that higher resolution voxel-wise networks may be better models (Hayasaka & Laurienti, 2010; Zalesky, et al., 2009). A 90-node parcellation scheme fails to retain information about the relationships between individual neurons. While modeling the network at the neuronal level is both intractable at this time and would limit the ability to study and interpret the model, a 90-node parcellation is indeed very coarse. A more optimal parcellation that reconciles the inaccuracies of the 90-node ROI parcellation scheme and the intractability of a microscale neuronal one would be a voxel-based approach. In such a model, each node would be represented by a single voxel of the fMRI image (approximately 4×4×5 mm of brain tissue). Additionally, although only directly connected neighbors were considered here, an alternate form may include neighbors separated by 2, 3, or n steps in the form of a larger neighborhood size.
The main contribution of this work has been to propose a brain-inspired agent-based model. This model is constructed from a functional brain network, and transforms the topological information in the brain network into simulated system dynamics using agent-based modeling techniques. This agent-based model of the brain satisfies the criteria of a complex system; that is, it is diverse, adaptive, interconnected, and interdependent. This model performs better at the density classification and synchronization tasks than models with randomized topology, providing evidence that this model can support global computation when each agent is provided with only local information. These tasks also demonstrate that GAs can be used to search for optimized model parameters that will produce predefined behaviors. In addition, the model is able to generate emergent behaviors that potentially could be used in the future to solve complex problems. These abilities are essential if this model is ever to produce brain-like dynamics. While the combination of a genetic algorithm and an agent-based model does not replicate the anatomy and physiology of the brain, this model may be capable of producing emergent brain-like behaviors.
Supplementary Material
Acknowledgements
The authors thank Dr. David John for facilitating an independent study on genetic algorithms, and Dr. Andrew Wuensche for correspondence on algorithms for studying attractor basins.
Funding
This work was supported by the National Institute of Neurological Disorders and Stroke (NS070917, URL: http://www.ninds.nih.gov).
Footnotes
Publisher's Disclaimer: This is a PDF file of an unedited manuscript that has been accepted for publication. As a service to our customers we are providing this early version of the manuscript. The manuscript will undergo copyediting, typesetting, and review of the resulting proof before it is published in its final citable form. Please note that during the production process errors may be discovered which could affect the content, and all legal disclaimers that apply to the journal pertain.
References
- Achard S, Salvador R, Whitcher B, Suckling J, Bullmore E. A Resilient, Low-Frequency, Small-World Human Brain Functional Network with Highly Connected Association Cortical Hubs. The Journal of Neuroscience. 2006;26:63–72. doi: 10.1523/JNEUROSCI.3874-05.2006. [DOI] [PMC free article] [PubMed] [Google Scholar]
- Anderson PW. More Is Different. Science. 1972;177:393–396. doi: 10.1126/science.177.4047.393. [DOI] [PubMed] [Google Scholar]
- Back T, Fogel D, Michalewicz Z. Handbook of Evolutionary Computation. Oxford: Oxford University Press; 1997. [Google Scholar]
- Bak P, Chen K, Creutz M. Self-organized criticality in the 'Game of Life'. Nature. 1989;342:780–782. [Google Scholar]
- Bassett DS, Brown JA, Deshpande V, Carlson JM, Grafton ST. Conserved and variable architecture of human white matter connectivity. Neuroimage. 2011;54:1262–1279. doi: 10.1016/j.neuroimage.2010.09.006. [DOI] [PubMed] [Google Scholar]
- Blagus N, Subelj L, Bajec M. Self-similar scaling of density in complex real-world networks. Physica A. 2011;391:2794–2802. [Google Scholar]
- Braga G, Cattaneo G, Flocchini P, Vogliotti CQ. Pattern growth in elementary cellular automata. Theoretical Computer Science. 1995;145:1–26. [Google Scholar]
- Braun U, Plichta MM, Esslinger C, Sauer C, Haddad L, Grimm O, Mier D, Mohnke S, Heinz A, Erk S, Walter H, Seiferth N, Kirsch P, Meyer-Lindenber A. Test-retest reliability of resting-state connectivity network characteristics using fMRI and graph theoretical measures. Neuroimage. 2012;59:1404–1412. doi: 10.1016/j.neuroimage.2011.08.044. [DOI] [PubMed] [Google Scholar]
- Bullmore E, Barnes A, Bassett DS, Fornito A, Kitzbichler M, Meunier D, Suckling J. Generic aspects of complexity in brain imaging data and other biological systems. Neuroimage. 2009;47:1125–1134. doi: 10.1016/j.neuroimage.2009.05.032. [DOI] [PubMed] [Google Scholar]
- Bullmore E, Sporns O. Complex brain networks: graph theoretical analysis of structural and functional systems. Nature Reviews Neuroscience. 2009;10:186–198. doi: 10.1038/nrn2575. [DOI] [PubMed] [Google Scholar]
- Burdette JH, Laurienti PJ, Espeland MA, Morgan A, Telesford Q, Vechlekar CD, Hayasaka S, Jennings JM, Katula JA, Kraft RA, Rejeski WJ. Using network science to evaluate exercise-associated brain changes in older adults. Frontiers in Aging Neuroscience. 2010;2:23. doi: 10.3389/fnagi.2010.00023. [DOI] [PMC free article] [PubMed] [Google Scholar]
- Cook M. Universality in Elementary Cellular Automata. Complex Systems. 2004;15:1–40. [Google Scholar]
- Das R, Crutchfield JP, Mitchell M, Hanson JE. Evolving Globally Synchronized Cellular Automata. In: Eshelman LJ, editor. Proceedings of the Sixth International Conference on Genetic Algorithms. San Mateo, CA: Morgan Kaufmann; 1995. [Google Scholar]
- Foti NJ, Hughes JM, Rockmore DN. Nonparametric Sparsification of Complex Multiscale Networks. PLoS ONE. 2011;6:e16431. doi: 10.1371/journal.pone.0016431. [DOI] [PMC free article] [PubMed] [Google Scholar]
- Fox MD, Snyder AZ, Vincent JL, Corbetta M, Essen DCV, Raichle ME. The human brain is intrinsically organized into dynamic, anticorrelated function networks. Proceedings of the National Academy of Sciences. 2005;102:9673–9678. doi: 10.1073/pnas.0504136102. [DOI] [PMC free article] [PubMed] [Google Scholar]
- Fransson P, Marrelec G. The precuneus/poster cingulate cortex plays a pivotal role in the default mode network: Evidence from a partial correlation network analysis. Neuroimage. 2008;42:1178–1184. doi: 10.1016/j.neuroimage.2008.05.059. [DOI] [PubMed] [Google Scholar]
- Girvan M, Newman MEJ. Community structure in social and biological networks. Proceedings of the National Academy of Sciences. 2002;99:7821–7826. doi: 10.1073/pnas.122653799. [DOI] [PMC free article] [PubMed] [Google Scholar]
- Goltsev AV, Abreu FVd, Dorogovtsev SN, Mendes JFF. Stochastic cellular automata model of neural networks. Physical Review E. 2010;81 doi: 10.1103/PhysRevE.81.061921. 061921. [DOI] [PubMed] [Google Scholar]
- Grinstein G, Linsker R. Synchronous neural activity in scale-free network models versus random network models. Proceedings of the National Academy of Sciences. 2004;102:9948–9953. doi: 10.1073/pnas.0504127102. [DOI] [PMC free article] [PubMed] [Google Scholar]
- Gu M, Weedbrook C, Perales A, Nielsen MA. More really is different. Physica D. 2009;238:835–839. [Google Scholar]
- Hagmann P, Cammoun L, Gigandet X, Meuli R, Honey CJ, Wedeen VJ, Sporns O. Mapping the Structural Core of Human Cerebral Cortex. PLoS Biology. 2008;6:e159. doi: 10.1371/journal.pbio.0060159. [DOI] [PMC free article] [PubMed] [Google Scholar]
- Hanson JE, Crutchfield JP. The Attractor-Basin Portrait of a Cellular Automaton. Journal of Statistical Physics. 1992;66:1415–1462. [Google Scholar]
- Hayasaka S, Laurienti PJ. Comparison of characteristics between region- and voxel-based network analyses in resting-state fMRI data. Neuroimage. 2010;50 doi: 10.1016/j.neuroimage.2009.12.051. [DOI] [PMC free article] [PubMed] [Google Scholar]
- Heuvel MPvd, Stam CJ, Boersma M, Pol HEH. Small-world and scale-free organization of voxel-based resting-state functional connectivity in the human brain. Neuroimage. 2008;43:528–539. doi: 10.1016/j.neuroimage.2008.08.010. [DOI] [PubMed] [Google Scholar]
- Jirsa VK, Sporns O, Breakspear M, Deco G, Mcintosh AR. Towards the virtual brain: network modeling of the intact and the damaged brain. Archives Italiennes de Biologie. 2010;148:189–205. [PubMed] [Google Scholar]
- Joyce KE, Laurienti PJ, Burdette JH, Hayasaka S. A new measure of centrality for brain networks. PLoS ONE. 2010;5:e12200. doi: 10.1371/journal.pone.0012200. [DOI] [PMC free article] [PubMed] [Google Scholar]
- Laurienti PJ, Joyce KE, Telesford QK, Burdette JH, Hayasaka S. Universal fractal scaling of self-organized networks. Physica A. 2011 doi: 10.1016/j.physa.2011.05.011. [DOI] [PMC free article] [PubMed] [Google Scholar]
- Mahajan AV, Gade PM. Transition from clustered state to spatiotemporal chaos in small-world networks. Physical Review E. 2010;81 doi: 10.1103/PhysRevE.81.056211. 056211. [DOI] [PubMed] [Google Scholar]
- Maslov S, Sneppen K. Specificity and Stability in Topology of Protein Networks. Science. 2002;296:910–913. doi: 10.1126/science.1065103. [DOI] [PubMed] [Google Scholar]
- Meunier D, Achard S, Morcom A, Bullmore E. Age-related changes in modular organization of human brain functional networks. Neuroimage. 2008;44:715–723. doi: 10.1016/j.neuroimage.2008.09.062. [DOI] [PubMed] [Google Scholar]
- Meunier D, Lambiotte R, Fornito A, Ershe KD, Bullmore ET. Hierarchical modularity in human brain functional networks. Frontiers in Neuroinformatics. 2009;3:12. doi: 10.3389/neuro.11.037.2009. [DOI] [PMC free article] [PubMed] [Google Scholar]
- Mitchell M. An Introduction to Genetic Algorithms. Cambridge, Massachusetts: MIT Press; 1998. [Google Scholar]
- Mitchell M. Complexity: A Guided Tour. Oxford University Press; 2009. Chapter 1. [Google Scholar]
- Mitchell M, Crutchfield JP, Das R. Computer Science Application: Evolving Cellular Automata. In: Back T, Fogel D, Michalewicz Z, editors. Handbook of Evolutionary Computation. Oxford: Oxford University Press; 1997. [Google Scholar]
- Page SE. Diversity and Complexity. Princeton: Princeton University Press; 2010. Chapter 1. [Google Scholar]
- Parunak HVD, Savit R, Riolo RL. Multi-agent systems and Agent-based Simulation (MABS'98) Paris, France: Springer; 1998. Agent-Based Modeling vs. Equation-Based Modeling: A Case Study and Users' Guide; pp. 10–25. [Google Scholar]
- Percha B, Dzakpasu R, Zochowski M. Transition from local to global phase synchrony in small world neural network and its possible implications for epilepsy. Physical Review E. 2005;72 doi: 10.1103/PhysRevE.72.031909. 031909. [DOI] [PubMed] [Google Scholar]
- Power JD, Cohen AL, Nelson SM, Wig GS, Barnes KA, Church JA, Vogel AC, Laumann TO, Miezin FM, Schlaggar BL, Petersen SE. Functional Network Organization of the Human Brain. Neuron. 2011;72:665–678. doi: 10.1016/j.neuron.2011.09.006. [DOI] [PMC free article] [PubMed] [Google Scholar]
- Reynolds CW. Flocks, Herds, and Schools: A Distributed Behavioral Model, in Computer Graphics. SIGGRAPH 1987 Conference Proceedings. 1987;21:25–34. [Google Scholar]
- Rubinov M, Sporns O. Weight-conserving characterization of complex functional brain networks. Neuroimage. 2011;56:2068–2079. doi: 10.1016/j.neuroimage.2011.03.069. [DOI] [PubMed] [Google Scholar]
- Tzourio-Mazoyer N, Landeau B, Papathanassiou D, Crivello F, Etard O, Delcroix N, Mazoyer B, Joliot M. Automated Anatomical Labeling of Activations in SPM Using a Macroscopic Anatomical Parcellation of the MNI MRI Single-Subject Brain. Neuroimage. 2002;15:273–289. doi: 10.1006/nimg.2001.0978. [DOI] [PubMed] [Google Scholar]
- Wang J, Wang L, Zang Y, Yang H, Tang H, Gong Q, Chen Z, Zhu C, He Y. Parcellation-Dependent Small-World Brain Functional Networks: A Resting-State fMRI Study. Human Brain Mapping. 2009;30:1511–1523. doi: 10.1002/hbm.20623. [DOI] [PMC free article] [PubMed] [Google Scholar]
- Wijk BC, Stam CJ, Daffershofer A. Comparing Brain Networks of Different Size and Connectivity Density Using Graph Theory. PLoS ONE. 2010;5:e13701. doi: 10.1371/journal.pone.0013701. [DOI] [PMC free article] [PubMed] [Google Scholar]
- Wolfram S. A New Kind of Science. Wolfram Media; 2002. [Google Scholar]
- Wright R. Did the Universe Just Happen? The Atlantic Monthly. 1988;Vol. 261:29. [Google Scholar]
- Wuensche A. Exploring Discrete Dynamics; The DDLab Manual. Luniver Press; 2011. [Google Scholar]
- Wuensche A. Basins of Attraction in Network Dynamics: A Conceptual Framework for Biomolecular Networks. In: Schlosser G, Wagner GP, editors. Modularity in Development and Evolution. Chicago University Press; 2002. pp. 288–311. [Google Scholar]
- Zalesky A, Fornito A, Harding IH, Cocchi L, Yucel M, Pantelis C, Bullmore ET. Whole-brain anatomical networks: Does the choice of nodes matter? Neuroimage. 2009;50:970–983. doi: 10.1016/j.neuroimage.2009.12.027. [DOI] [PubMed] [Google Scholar]
Associated Data
This section collects any data citations, data availability statements, or supplementary materials included in this article.


