Abstract
Background
A high degree of non-compacted (trabeculated) myocardium in relationship to compact myocardium (T/M ratio >2.3) has been associated with a diagnosis of left ventricular non-compaction (LVNC). The purpose of this study was to determine the normal range of the T/M ratio in a large population-based study and to examine the relationship to demographic and clinical parameters.
Methods and Results
The thickness of trabeculation and the compact myocardium were measured in eight LV regions on long axis cardiac magnetic resonance (CMR) steady-state free precession cine images in 1000 participants (551 women; 68.1±8.9 years) of the Multi-Ethnic Study of Atherosclerosis cohort. Of 323 participants without cardiac disease or hypertension and with all regions evaluable 140 (43%) had a T/M ratio >2.3 in at least one region; in 20/323 (6%), T/M>2.3 was present in more than two regions. Multivariable linear regression model revealed no association of age, gender, ethnicity, height and weight with maximum T/M ratio in participants without cardiac disease or hypertension (p>0.05). In the entire cohort (n=1000) LVEF (β=−0.02/%; p=0.015), LVEDV (β=0.01/ml; p=<0.0001) and LVESV (β=0.01/ml; p<0.001) were associated with maximum T/M ratio in adjusted models while there was no association with hypertension or myocardial infarction (p>0.05). At the apical level T/M ratios were significantly lower when obtained on short- compared to long-axis images (p=0.017).
Conclusions
A ratio of trabeculated to compact myocardium of more than 2.3 is common in a large population based cohort. These results suggest reevaluation of the current CMR criteria for LVNC may be necessary.
Keywords: cardiovascular magnetic resonance imaging, cardiomyopathy, non-compaction, trabeculation
According to the American Heart Association, left ventricular (LV) non-compaction (LVNC) is classified as primary genetic cardiomyopathy and is characterized by the presence of a thin compact epicardial and a thick non-compacted endocardial myocardial layer in the region of the left ventricle.1, 2 Heart failure, thromboembolism, and arrhythmias are known complications.3 LVNC is considered a congenital disease due to an arrest of the normal compaction process of the developing myocardium. However, it has been postulated that LVNC can also develop postnatally.4
The large increase in publications for LVNC let Oechslin et al. raise the question “…whether advances in non-invasive diagnostic technologies led to better delineation of the morphological appearance of the myocardium or whether LVNC is over diagnosed and the diagnostic criteria are too sensitive.”4 In the interpretation of advanced imaging studies, the question of LVNC arises for patients with prominently trabeculated myocardium without known reason for myocardial dysfunction and/or arrhythmia. Prominent LV trabeculations are known to occur in normal hearts, thus complicating the diagnosis of LVNC.5–7
The magnetic resonance imaging (MRI) criterion of a ratio of non-compacted (trabeculated) versus compacted myocardium (T/M) >2.3 (measured at diastole on long axis images) for LVNC has been suggested by Petersen et al.2 Using this cut-off value to distinguish pathological non-compaction they demonstrated a high sensitivity, specificity, and positive and negative predictive values of 86%, 99%, 75%, and 99%, respectively.
The aims of this study were 1) to determine the specificity of the current MRI criterion for LVNC in a large population-based study and 2) to determine if the T/M ratio and thickness of trabeculation vary with demographics, LV function, and clinical characteristics. We note that the terms “non-compacted myocardium” and “(prominent / hyper-) trabeculation” are used interchangeably in the literature.5, 6, 8, 9 Since the term “non-compacted myocardium” implies LVNC cardiomyopathy while “trabeculation” appears to be a more neutral expression indicating a normal anatomical variant, the latter is used in the discussion that follows.
Methods
Study sample
The Multi-Ethnic Study of Atherosclerosis (MESA) study is a population-based longitudinal study initiated in July 2000. At enrollment, study participants were free of clinically recognized cardiovascular disease including LVNC.10 1000 consecutive participants (characteristics are shown in Table 1), were chosen randomly from the “MESA 5” follow up evaluation of the cohort, initiated in April 2010. The study was approved by the institutional review boards ofeach of the six participating U.S. field sites, and all participants provided written informed consent.
Table 1.
Characteristics of the MESA study cohort
| Characteristic | Entire study cohort (n=1000) | Participants without cardiac disease or hypertension (n=367) |
|---|---|---|
| Female, n(%) | 551(55) | 192(52) |
| Age in years, mean±SD(range) | 68.1±8.9(54–94) | 65.4±8.3(54–91) |
| Ethnicity, n(%) | ||
| Caucasian | 503(50) | 187(51) |
| Chinese | 81(8) | 46(13) |
| African American | 252(25) | 65(18) |
| Hispanic | 164(16) | 69(19) |
| Height in cm, mean±SD | 167±9.6 | 167±9.7 |
| Weight in kg, mean±SD | 78.9±16.3 | 76.6±16.1 |
| Hypertension, n(%) | 439(44) | 0 |
| Participants with evaluation of all 8 regions, n(%) | 827(83) | 323(88) |
| Participants excluded per region*, n(%) | ||
| mid-cavity anterior | 125(13) | 34(9) |
| mid-cavity inferior | 118(12) | 33(9) |
| mid-cavity septal | 32(3) | 5(1) |
| mid-cavity lateral | 36(4) | 5(1) |
| apical anterior | 149(15) | 40(11) |
| apical inferior | 141(14) | 38(10) |
| apical septal | 40(4) | 6(2) |
| apical lateral | 38(4) | 5(1) |
| LVEF in %, mean±SD | 62.1±7.4† | 62.4±5.9 |
| LVEF <50%, n(%) | 42(4)† | 0 |
| LVEDV in ml, mean±SD | 123±33† | 124±31 |
| LVESV in ml, mean±SD | 47±19† | 47±15 |
| Delayed gadolinium CMR performed, n(%) | 665(67) | 367(100) |
| Myocardial infarction‡, n(%) | 36(4) | 0 |
| Non-ischemic scar§, n(%) | 25(4) | 0 |
| Participants with focal myocardial thinningII, n(%) | 7(0.7) | 0 |
| LV hypertrophy, n(%) | 14(1) | 0 |
MGE=myocardial delayed enhancement; LV=left ventricle; LVEF=ejection fraction; LVEDV=left ventricular end-diastolic volume; LVESV=left ventricular end-systolic volume
Participants without cardiac disease or hypertension=participants with a CMR exam including MDE imaging, no history of myocardial infarction, no evidence of an ischemic or non-ischemic scar on CMR
MDE images, left ventricular ejection fraction >50%, systolic blood pressure <140 mmHg and no hypertensive medication, and LV myocardial thickness <15mm at end-diastole
=due to inappropriate image quality or myocardial thinning related to myocardial infarction
=LVEF, LVEDV, LVESV were available for 990 participants only
=based on clinical diagnosis and cardiac MR imaging
=based on cardiac MR imaging only; please note that the presence of a non-ischemic scar could be assessed only in participants whose exam included myocardial delayed enhancement imaging (n=665)
=due to myocardial infarction; thinning of ≥ 50% of the thickness of the compact myocardium compared to adjacent myocardium in the area of measurement
Cardiac MR
Cardiac MR (CMR) exams were performed at the six MESA field centers (Baltimore, Winston-Salem, New York, Minneapolis, Los Angeles, Chicago) on 1.5T MR scanners (Signa Excite, General Electric Medical Systems, Waukesha, Wis and Avanto/ Espree, Siemens, Erlangen, Germany). Retrospectively ECG gated long and short axis cine images were acquired using a steady-state free precession (SSFP) sequence with the following parameters for Siemens (and GE) scanners: TR / TE ≤3.8 (minimize)/ minimized (minimum full); flip angle 70 (45)°; FOV 360 × 360 mm; matrix size 256 × 205 (256 × 192); slice thickness 8mm, interslice gap 2mm; bandwidth 1221 (977) Hz/pixel; parallel imaging GRAPPA: 2 (ASSET); number of segments 18 (16); temporal resolution 49 (48) ms. The presence of myocardial scar was evaluated in 665 participants who consented to contrast administration and without contraindication beginning 15 minutes after administration of 0.15 mmol/kg gadopentetate dimeglumine (Bayer, New Jersey) using an inversion recovery prepared gradient echo sequence.
Image evaluation
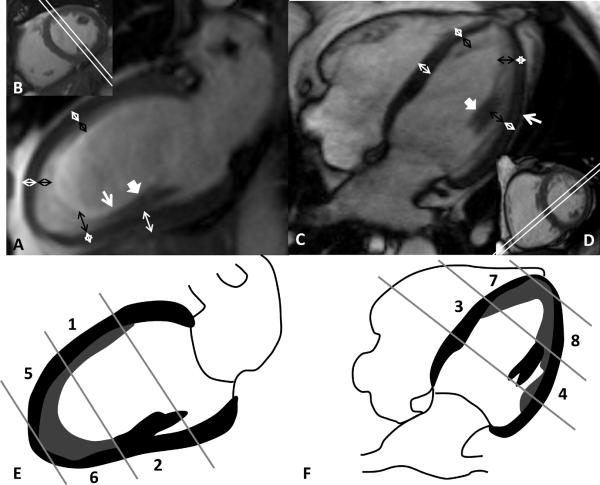
CMR exams were evaluated using WebPAX (Heart Imaging Technologies, LLC, Durham, NC, USA). Horizontal and vertical long axis cine SSFP images were used for measuring the thickness of the compact myocardium and of the trabeculation in the middle of eight LV regions: anterior, inferior, septal and lateral at mid-cavity (MidAnt, MidInf, MidSept, MidLat) and apical level (ApAnt, ApInf, ApSept, ApLat) at end-diastole (Figure 1). Measurements were not performed at the base of the heart because trabeculation was not typically observed in this region or showed only a very thin layer. As per Petersen et al., the apex was also excluded because myocardium is usually very thin and with prominent trabeculation in normal subjects.2, 6 Compact myocardium was defined as myocardial layer of homogeneous medium signal intensity on the SSFP image without inclusion of blood of brighter signal intensity. Trabeculation was defined as a meshwork of the trabeculae carneae of medium signal intensity adjacent to compact myocardium interspersed with blood of bright signal intensity. Measurements of the thickness of the compact myocardium as well as of the adjacent trabeculation were obtained perpendicular to the compact myocardium (Figure 1, A and C). 50% of the thickness of the “black line” on the epicardial surface related to a chemical shift artifact was included in the compact myocardium. Papillary muscles that were clearly observed as compact tubular structures were not included in the measurements. Short axis views and cine mode were used additionally to separate papillary muscles from trabeculation. Regions with inadequate image quality were excluded from further analysis. Regions with focal thinning >50% of the compact myocardium in the area of measurement as assessed visually due to myocardial infarction were also excluded.
Figure 1.
Steady-state free precession (SSFP) cine sequence at end-diastole acquired as vertical (A) and horizontal (C) long axis view showing representative measurements of the thickness of the compact myocardium (white double arrows) and the thickness of trabeculation (black double arrows) in 8 regions: mid-cavity anterior (E1), mid-cavity inferior (E2), mid-cavity septal (F3), mid-cavity lateral (F4), apical anterior (E5), apical inferior (E6), apical septal (F7), and apical lateral (F8). Inserted images (B, D) show the respective corresponding imaging plane on a short axis view (double white line). Transition zone (white arrow in A) between papillary muscle (bold white arrow in A and C) and trabeculation. Chemical shift artifact (white arrow in C).
Measurements were first made by a single primary reader. To assess intra- and inter-observer agreement, measurements were repeated by the primary reader and also by a second reader in 100 (10%) randomly chosen participants. Furthermore, in a subset of 100 (10%) randomly chosen participants measurements obtained on long axis images were compared to measurements on corresponding short axis views. In order to cross-reference short and long-axis views, images were transferred to QMass V.7.2 (Medis Medical Imaging Systems, Netherlands) and measured along a reference line displayed by that software. For those purposes also measurements on long axis images were repeated with QMass software. Since short axis images showed blurring of trabeculation and compact myocardium at the apex, for the comparison measurements were obtained one slice towards the mid-cavity from the middle of the apical level.
LV functional parameters were obtained using CIM software (cardiac image modeler) by two independent readers (Auckland, New Zealand).11 The presence of myocardial delayed enhancement (MDE) was categorized as present or absent as defined by two additional independent readers.
Statistical analysis
The thickness of the trabeculation and the T/M ratio were evaluated. Analysis was performed for the 1000 randomly chosen consecutive MESA participants (in the following referred to as the “entire/whole cohort”) as well as for a subset of these 1000 participants considered to be without cardiac disease or hypertension (in the following referred to as the “participants without cardiac disease or hypertension”). None of the 1000 participants was known to have LVNC. “Participants without cardiac disease or hypertension” (n=367) were defined as participants with a CMR exam including MDE imaging, no history of myocardial infarction, no evidence of an ischemic or non-ischemic scar on CMR MDE images, left ventricular ejection fraction (LVEF) >50%, systolic blood pressure <140 mmHg and no antihypertensive medication, and LV myocardial thickness <15mm at end-diastole.
For multivariable linear regression analysis, T/M ratio and thickness of trabeculation, which were normally distributed, were calculated as maximum of the measurements of all eight regions in those participants only where all eight measurements were obtained (83% of the entire cohort and 88% of the participants without cardiac disease or hypertension). Missing values of one of the independent variables led to exclusion of the participants for the respective model (10/1000 [0.01%] due to missing LV functional parameters).
For participants without cardiac disease or hypertension, multivariable linear regression models were developed to determine the relationship between the dependent variables T/M ratio and thickness of trabeculation and age, gender, ethnicity, height and weight (Model 1). The relationship of T/M ratio and trabeculation thickness to LV function parameters (LVEF, LV end-diastolic volume [LVEDV] and LV end-systolic volume [LVESV]) was individually assessed after adjustment for parameters in Model 1: Model 2a (Model 1 + LVEF), Model 2b (Model 1 + LVEDV) and Model 2c (Model 1 + LVESV). Due to collinearity, LV parameters were not combined in the same model. For the entire cohort, the relationship of T/M ratio and thickness of trabeculation was additionally assessed in relationship to hypertension and myocardial infarction again adjusted for parameters in Model 1.
Intraclass Correlation Coefficient (ICC), Spearman's correlation coefficient, and the Bland Altman method were used to investigate intra- and inter-observer agreement.
Measurements for the thickness of trabeculation, the compact myocardium and the T/M ratio obtained on long and short axis images were compared using a paired t-test for normal distributed variables (thickness of compact myocardium) and a Wilcoxon Signed Rank Test for non normally distributed variables (thickness of trabeculation and T/M ratio) for the mid-cavity level and the apical level separately.
P-values <0.05 were considered statistically significant. All statistical analysis were performed using PASW statistical software (version 19).
Results
Table 1 shows demographic characteristics of the entire cohort and the participants without cardiac disease or hypertension. Compared to the entire cohort, the participants without cardiac disease or hypertension were approximately 3 years younger, had 5 mg smaller LV mass, and were 3% more likely to be male.
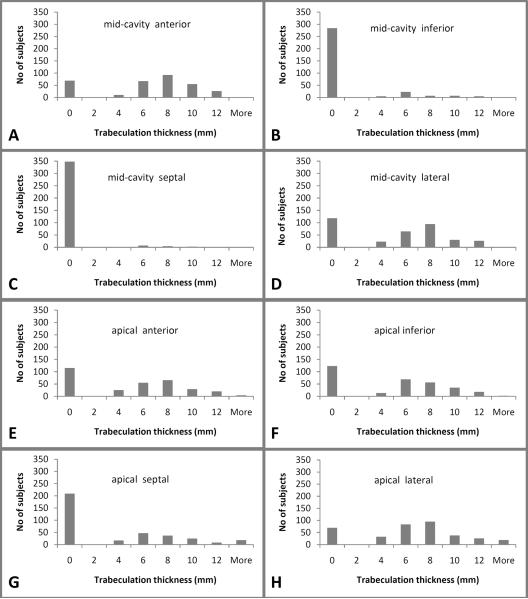
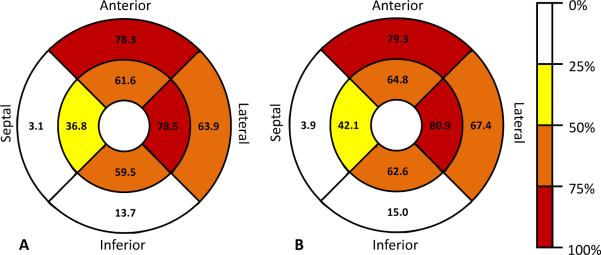
In the whole cohort as well as in participants without cardiac disease or hypertension, trabeculation was most commonly detected and most prominent in the apical lateral (79%, 81%), mid-anterior, (78%, 79%), mid-lateral (64%, 67%), apical anterior, (62%, 65%), and apical inferior (60%, 63%) region, respectively. Trabeculation was least common in the mid-septal (3%, 4%) region. (Figures 2, 3)
Figure 2.
Trabeculation thickness for the subset of participants without cardiac disease or hypertension for the mid-cavity anterior (A), inferior (B), septal (C), lateral (D) and the apical anterior (E), inferior (F), septal (G), and lateral (H) region.
Figure 3.
Percent participants with trabeculation per region at the mid-cavity level (outer circle) and the apical level (inner circle) of the entire cohort (A) and the subset of participants without cardiac disease or hypertension (B).
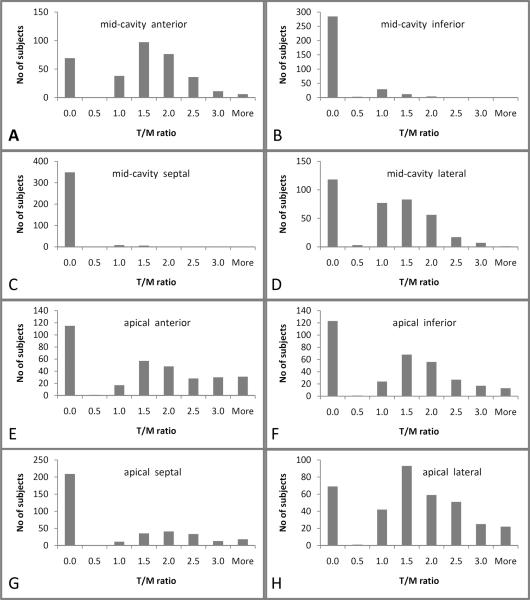
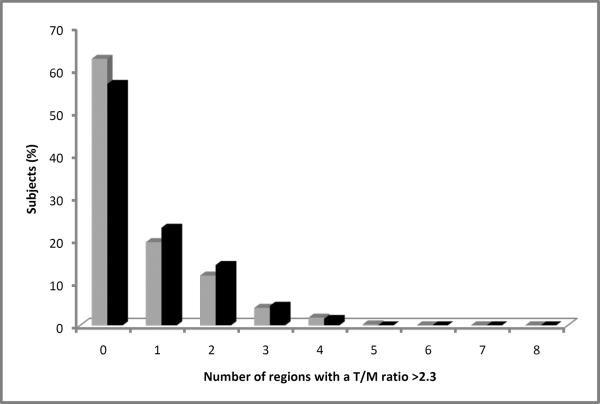
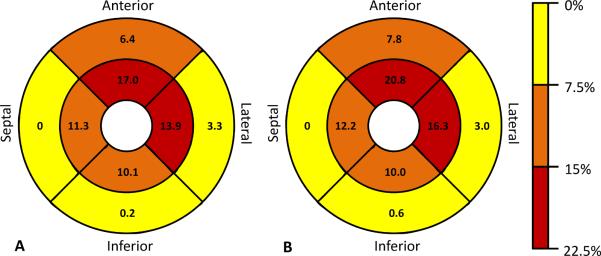
In 564/7321 (8%) evaluable regions in the total cohort, a T/M ratio >2.3 was present. In 243 /2936 (8%) evaluable regions in participants without cardiac disease or hypertension, a T/M ratio >2.3 was present. The distribution of the T/M ratios are shown in Figure 4. For 827 participants with all eight evaluable regions, 309/827 (37%) had a T/M ratio >2.3 in at least one region and 18 (2%) had trabeculation in none of the regions. For 323 participants without cardiac disease or hypertension and with all eight evaluable regions, 140 (43%) had a T/M ratio >2.3 in at least one region. Twenty of these 323 participants (6%) had a T/M ratio >2.3 in more than two regions and five (2%) had trabeculation in none of the regions. Sixty-two (19%) had a T/M ratio >2.9 in one region. Figure 5 shows the percentage of participants who had a T/M ratio >2.3 in 0 to 8 regions per participant. Regions with most frequent T/M ratio >2.3 were apical anterior, apical septal and apical lateral for both, participants without cardiac disease or hypertension and the entire cohort (Figure 6).
Figure 4.
T/M ratio for the subset of participants free of cardiac disease for the mid-cavity anterior (A), inferior (B), septal (C), lateral (D) and the apical anterior (E), inferior (F), septal (G), and lateral (H) region. Please note, that for better visualization scaling of the ordinate varies.
T/M ratio=thickness of trabeculation / thickness of compact myocardium
Figure 5.
Percent of participants of the entire cohort (grey bars) and the subset of participants without cardiac disease or hypertension (black bars) with a T/M ratio >2.3 in 0 to 8 regions per participant.
T/M ratio=thickness of trabeculation / thickness of compact myocardium
Figure 6.
Percent participants with a T/M ratio >2.3 per region at the mid-cavity level (outer circle) and the apical level (inner circle) of the entire cohort (A) and the subset of participants without cardiac disease or hypertension (B).
Association of trabeculation with demographic, clinical and LV parameters
Table 2 shows the 5th, 50th and 95th percentile of the composite measures maximum T/M ratio and maximum trabeculation thickness. For participants without cardiac disease or hypertension, there was no relationship between T/M ratio and age, gender, race/ethnicity, height or weight. Compared to Caucasian, Chinese (mean difference[β]=1.5mm; p=0.02) and African American (β=1.3mm; p=0.01) race were associated with a higher maximum thickness of trabeculation in participants without cardiac disease or hypertension. Maximum thickness of trabeculation was also greater in men than women (β=1.1mm; p=0.04).
Table 2.
Percentiles of maximum values
| Max. T/M ratio | Max. thickness of trabeculation in mm for all (men, women) | |||||
|---|---|---|---|---|---|---|
| 5th | 50th | 95th | 5th | 50th | 95th | |
| Entire cohort (n=827) | 0.9 | 2.0 | 4.5 | 4.5 (4.8, 4.1) | 9.0 (9.4, 8.5) | 15.9 (16.6, 15.5) |
| Participants without cardiac disease or hypertension (n=323) | 1.0 | 2.2 | 4.6 | 4.6 (4.8, 4.1) | 9.0 (9.8, 8.1) | 15.6 (16.3, 14.4) |
T/M ratio=thickness of trabeculation/thickness of compact myocardium
In participants without cardiac disease or hypertension, lower ejection fraction (β=−0.02/%; p=0.044) and higher LVEDV (β=0.01/ml; p<0.0001) were associated with a greater maximum T/M ratio after adjustment for age, gender, ethnicity, height and weight. In addition, higher LVEDV (β=0.03mm/ml; p<0.0001; and higher LVESV (β=0.06mm/ml; p<0.0001) were also associated with maximum thickness of trabeculation in participants without cardiac disease or hypertension after adjustment. Results in the entire cohort paralleled those of the participants without cardiac disease or hypertension for T/M ratio and maximum trabeculation thickness, except greater LV mass was additionally associated with trabeculation thickness in the entire cohort (β=0.02mm/g; p=0.013) and remained significant after additional adjustment for hypertension (β=0.02mm/g; p=0.014). The presence of hypertension or myocardial infarction were not associated with maximum T/M ratio or trabeculation thickness (p>0.05). This result regarding association with myocardial infarction remained unchanged after inclusion of the participants (n=7) that had been excluded previously due to focal thinning of the compact myocardium in the area of measurement related to myocardial infarction.
Short axis versus long axis myocardial assessment
By convention, magnetic resonance imaging (MRI) criterion of a ratio of non-compacted (trabeculated) versus compacted myocardium (T/M) >2.3 has been measured on long-axis images to avoid geometric distortion of the trabecular matrix.2 We additionally assessed short axis measurements from 100 randomly selected participants to assess the degree of variation between long and short axis measurements.
At the apical level, trabeculation thickness and thickness of compact myocardium were significantly greater when obtained on short axis images compared to long axis images (trabeculation thickness, median (interquartile range), 6.0mm (0 to 8.9mm) [short axis] and 5.8mm (0 to 8.1mm) [long axis], respectively, p<0.01; thickness of compact myocardium, mean±SD, 6.2±1.7mm [short axis] and 5.2±1.2mm [long axis], respectively, p<0.0001). At the mid-cavity, there was a significant difference for thickness of compact myocardium (mean ± SD, 7.1±2.0mm [short axis] and 7.3±1.9mm [long axis], p<0.01) while there was no significant difference for thickness of trabeculation (p=0.8).
Correspondingly, the T/M ratios for short axis images at the apical level were less than values obtained on long axis images (median (interquartile range), 1.0 (0 to 1.4) and 1.1 (0 to 1.7), respectively; p=0.02). T/M ratios at the mid-cavity level measured on short axis were not different than long axis measurements (p=0.13).
Intra- and inter-observer agreement
Assessment of the intra-observer agreement revealed a Spearman's correlation coefficient of 0.84 and a p-value of <0.001 for both thickness of trabeculation and T/M ratio and a correlation coefficient of 0.88 (p<0.001) for thickness of compact myocardium. By Bland-Altman method, bias (95% CI) for trabeculation thickness was 0.5mm (0.3mm to 0.6mm) with lower limits of agreement (95% CI) of −3.4mm (−3.7mm to −3.2mm) and upper limits of agreement (95% CI) of 4.4mm (4.1mm to 4.6mm). Bias (95% CI) for thickness of compact myocardium was 0.02mm (−0.04mm to 0.07mm) with lower limits of agreement (95% CI) of −1.5mm (−1.6mm to 1.4mm) and upper limits of agreement (95% CI) of 1.5mm (1.4mm to 1.6mm). Bias (95% CI) for T/M ratio was 0.12 (0.08 to 0.16) with lower limits of agreement (95% CI) of −0.94 (−1.01 to −0.87) and upper limits of agreement (95% CI) of 1.18 (1.11 to 1.25). The intraclass correlation coefficient for trabeculation thickness and T/M ratio was 0.91 and for thickness of compact myocardium it was 0.94.
Assessment of the inter-observer agreement revealed a Spearman's correlation coefficient of 0.74 and a p-value of <0.001 for both, thickness of trabeculation and T/M ratio and a correlation coefficient of 0.77 (p<0.001) for thickness of compact myocardium. By Bland-Altman method, bias (95% CI) for trabeculation thickness was 0.8mm (0.6mm to 1.0mm) with lower limits of agreement (95% CI) of −4.2mm (−4.5mm to −3.9mm) and upper limits of agreement (95% CI) of 5.8mm (5.5mm to 6.1mm). Bias (95% CI) for thickness of compact myocardium was 0.9mm (0.8mm to 1.0mm) with lower limits of agreement (95% CI) of −1.2mm (−1.3mm to −1.0mm) and upper limits of agreement (95% CI) of 3.0mm (−2.9mm to 3.2mm). Bias (95% CI) for T/M ratio was 0.007 (−0.04 to 0.05) with lower limits of agreement (95% CI) of −1.25 (−1.33 to −1.17) and upper limits of agreement (95% CI) of 1.27 (1.18 to 1.35). The intraclass correlation coefficient for trabeculation thickness and T/M ratio was 0.84 and for thickness of compact myocardium it was 0.88.
Discussion
In the current study we demonstrated 1) that 43% of subjects without cardiac disease or hypertension had a T/M ratio >2.3 in at least one myocardial segment; 2) T/M ratio was not associated with age, gender, race/ethnicity, height and weight in subjects without cardiac disease or hypertension and not with hypertension and myocardial infarction in the entire cohort; 3) the maximum thickness of trabeculation was positively associated with Chinese and African American races and with male gender, 4) in both, the entire cohort and the subjects without cardiac disease or hypertension, there was a negative association of LVEF and a positive association of LVEDV and LVESV with the maximum T/M ratio while LVEDV and LVESV were also positively associated with maximum trabeculation thickness and 5) values for thickness of trabeculation and compact myocardium as well as T/M ratio vary with measurement technique.
The MESA study population is a well-characterized population cohort that was enrolled between the years 2000–2002. The study participants have no known diagnoses of left ventricular non-compaction. All study participants were free of clinical cardiovascular disease at baseline enrollment. At the time of this CMR examination (beginning 2010), 367/1000 of this sub-study's participants were free of clinical as well as CMR defined cardiac disease, and without hypertension or hypertension medication use. We focused our results on this “healthy” sub-population of 367 participants to further exclude the potential of occult LVNC. We also noted that in both the “health participants” and the entire sub-population of 1000 participants, lower LVEF, higher LVEDV and higher LVESV were associated with slightly higher values of T/M ratio in adjusted models. In participants without cardiac disease or hypertension, a 10ml higher LVEDV was associated with 0.1 higher T/M ratio. In these same participants, a 10ml higher LVESV was associated with a 0.3 higher T/M ratio. Although these effects are small, clinicians should be aware that slightly higher T/M ratios may be present in participants with elevated LVEDV and LVESV. Alternatively, this could represent a subclinical cardiomyopathy, a hypothesis that may be addressed by the long term outcome of these participants in future studies.
At autopsy in hearts free of cardiac disease, Boyd et al. found prominent LV trabeculae in 323 of 474 (68%) of specimens.5 “Prominent trabeculation” was defined as “discrete muscle bundles, more than 2 mm in diameter” while the thickness of the whole trabeculated layer is not mentioned. In an echocardiography based study Kohli et al. realized that also 8% of subjects free of cardiac disease fulfilled one or more of the echocardiographic criteria to diagnose LVNC. This result led them to the conclusion that the current echocardiographic criteria might be too sensitive.7 Similarly, our results suggest that the current CMR criterion for LVNC shows low specificity, since 43% of participants without cardiac disease or hypertension had a T/M ratio > 2.3 in at least one region. However, only 6% participants without cardiac disease or hypertension in the current study had a maximum T/M ratio >2.3 in more than two regions. Reconsideration of CMR criterion may improve specificity for LVNC diagnosis, but the effect on sensitivity is unknown.
Although according to the literature diagnosis with echocardiography and CMR is based solely on morphologic criteria such as T/M ratio, in routine clinical practice LVNC is usually also based on assessment of function. Dysfunction in addition to prominent trabeculation / non-compacted myocardium adjacent to thinned compact myocardium is suggestive of LVNC. We therefore suggest evaluation of a multifactorial approach to diagnose LVNC in further studies including morphologic criteria such as the T/M ratio, the number of affected regions and assessment of function.
In the current study, trabeculation was most common at the apical lateral (81%) and mid-cavity anterior (79%) regions (Figure 3) and the highest ratios were measured at the apical lateral and anterior lateral regions (Figure 6). This result is similar to previous publications. Petersen et al. realized that in 91% of 45 healthy subjects trabeculation was present at the apical level and in 78% at mid cavity level.9 Dawson et al. also reported that trabeculation was present in 1 or more segments in all of 120 healthy volunteers. Further, 64% had an apical free wall trabecular layer at least as thick as the compact layer.6 We measured trabeculation on long axis images similar to Petersen et al.9, while Dawson et al. evaluated short axis images. The cone-shape of the left ventricular apex particularly tends to overestimate measurements of the thickness of compact myocardium in the short axis view in relationship to the cosine of the ventricular angulation with respect to the axis of the ventricle.12 (Figures 7 and 8). Differences in MRI scanner pulse sequences, study population or measurement technique also account for differences between studies. Papillary muscle separation from trabeculation is particularly challenging and is not described in other manuscripts. We excluded papillary muscles when clearly visible as a tubular compact structure (Figure 1A and C). We realize that there is often a smooth transition between the compact papillary muscle and trabeculation (Figure 1A). It is challenging to clearly delineate between papillary muscle and trabeculation in this transition zone. In order to avoid inclusion of papillary muscles in measurements it is useful to correlate orientation of the long axis images with short axis images. Software that provides a reference line of the acquisition plane is particularly helpful.
Figure 7.
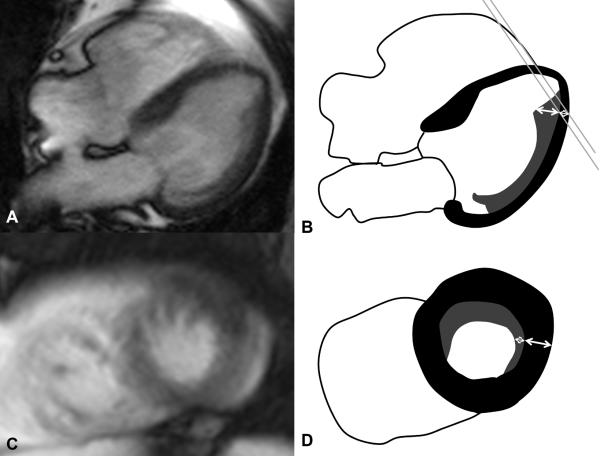
Steady-state free precession (SSFP) cine sequence at end-diastole acquired as vertical long axis (A) and short axis (C) view and the corresponding schematic diagrams (B, D). Example of triangular shaped trabeculation along the lateral left ventricular wall. Measurements of the thickness of trabeculation and the compact myocardium were acquired perpendicular to the compact myocardium on long axis images (double arrows in B). Due to the conical shape of the left ventricle in the apical region and depending on the configuration of the trabeculation, measurements obtained at the corresponding short axis image (D) as indicated by the grey double line (B) reveal a greater thickness of the compact myocardium and a smaller thickness of trabeculation (double arrows in D).
Figure 8.
Steady-state free precession (SSFP) cine sequence at end-diastole acquired as vertical long axis (A) and short axis (C) view and the corresponding schematic diagrams (B, D). Example of a participant with prominent trabeculation, a normal ejection fraction (56.2%) and no history of hard or soft cardiovascular disease events. Measurements of the thickness of trabeculation and the compact myocardium were acquired perpendicular to the compact myocardium on long axis images (double arrows in B). Due to the conical shape of the left ventricle in the apical region, measurements obtained at the corresponding short axis image (D) as indicated by the grey double line (B) reveal a greater thickness of the compact myocardium and equal thickness of trabeculation (when measured till the middle of the left ventricular cavity) (double arrows in D). The resulting T/M ratio is smaller when measurements were obtained on short axis images.
In the current study a thicker maximum trabeculation was significantly associated with Chinese and African American ethnicities while the maximum T/M ratio did not show an association with ethnicity. Kohli et al. demonstrated that more black individuals of their control groups fulfilled echocardiographic criteria for non-compaction compared to white individuals (13.3% versus 3.3%) while in a study by Peters et al. none of 54 control subjects of sub-Saharan African descent fulfilled echocardiographic criteria for LVNC.13 In the current study male gender was also significantly associated with a higher maximum thickness of trabeculation. In another study where the mean thickness of trabeculation was compared for each segment separately there was no statistically significant difference between men and women.6 Both studies did not show a significant association between gender and the T/M ratio.
There was no association of trabeculation thickness or T/M ratio with age in the current study. Dawson et al. did also not find an age-related trend of T/M ratio.6 Only when study participants were divided into two age groups a significantly lower ratio of the older age group compared to younger individuals was present. In the current study only older participants (age range 54 to 94 years) were included. This might explain why no statistical relation between T/M ratio and also trabeculation thickness was detected.
There are several limitations of the current study. No participant was known to have the diagnosis of LVNC but there was no gold standard of reference for the diagnosis of LVNC. However, the prevalence of LVNC in the general population has been estimated at 0.05% which means that in the present cohort of 1000 subjects only 0.5 participants might have non-diagnosed LVNC which would not affect the result.9 The results apply only to measurements made by the techniques described in this study for the long axis analyses. The mean age of study participants was 68 years, although no relationship of age to T/M ratio was present. Although we discuss the potential to understand the specificity of criteria for LVNC, this is hypothetical since LVNC participants were not studied by these methods. Strengths of the study include a large heterogeneous study population that allowed multivariable analysis of associations of trabecular measurements with clinical, left ventricular and demographic characteristics.
In conclusion, T/M ratio >2.3 in at least one myocardial region is common, present in 43% of our study participants. The T/M ratio is dependent on measurement technique and thus dedicated guidelines with respect to measurement techniques are necessary. T/M ratio is a robust and reproducible measure that is independent of age, gender, ethnicity, height and weight in participants without cardiac disease or hypertension.
Clinical perspective.
Diagnosis of left ventricular non-compaction cardiomyopathy (LVNC) remains challenging in daily practice. Using standard morphologic cardiac MR imaging criteria of trabeculated and compacted myocardium (T/M ratio) of >2.3, overdiagnosis of LVNC has been suggested. The present study evaluated T/M ratio in a large population based cohort of 1000 subjects; 323 of these subjects were free of cardiac disease. In the subset of individuals free of cardiac disease, 43% of subjects had at least one region with T/M ratio > 2.3. This suggests that T/M ratio alone for LVNC diagnosis may have low specificity. Measurement of T/M ratio varied using different imaging planes (long axis versus short axis), indicating a standardized measurement is needed. T/M ratio did not vary with age, gender, ethnicity, height and weight; therefore no adjustment to these demographic parameters is required.
Acknowledgements
The authors thank the other investigators, the staff, and the participants of the MESA study for their valuable contributions. A full list of participating MESA investigators and institutions can be found at http://www.mesa-nhlbi.org.
Sources of Funding This research was supported by the intramural research program of the National Institutes of Health and contracts N01-HC-95159 through N01-HC-95169 from the National Heart, Lung, and Blood Institute.
Footnotes
Disclosures Dr. Arai has an US Government Cooperative Research and Development Award with Siemens. Dr. Prince has patent agreements with General Electric, Siemens, Philips, Toshiba and Hitachi and received payment for speakers' bureau appointments from Bayer.
Publisher's Disclaimer: This is a PDF file of an unedited manuscript that has been accepted for publication. As a service to our customers we are providing this early version of the manuscript. The manuscript will undergo copyediting, typesetting, and review of the resulting proof before it is published in its final citable form. Please note that during the production process errors may be discovered which could affect the content, and all legal disclaimers that apply to the journal pertain.
References
- 1.Maron BJ, Towbin JA, Thiene G, Antzelevitch C, Corrado D, Arnett D, Moss AJ, Seidman CE, Young JB. Contemporary definitions and classification of the cardiomyopathies: An american heart association scientific statement from the council on clinical cardiology, heart failure and transplantation committee; quality of care and outcomes research and functional genomics and translational biology interdisciplinary working groups; and council on epidemiology and prevention. Circulation. 2006;113:1807–1816. doi: 10.1161/CIRCULATIONAHA.106.174287. [DOI] [PubMed] [Google Scholar]
- 2.Petersen SE, Selvanayagam JB, Wiesmann F, Robson MD, Francis JM, Anderson RH, Watkins H, Neubauer S. Left ventricular non-compaction: Insights from cardiovascular magnetic resonance imaging. J Am Coll Cardiol. 2005;46:101–105. doi: 10.1016/j.jacc.2005.03.045. [DOI] [PubMed] [Google Scholar]
- 3.Oechslin EN, Attenhofer Jost CH, Rojas JR, Kaufmann PA, Jenni R. Long-term follow-up of 34 adults with isolated left ventricular noncompaction: A distinct cardiomyopathy with poor prognosis. J Am Coll Cardiol. 2000;36:493–500. doi: 10.1016/s0735-1097(00)00755-5. [DOI] [PubMed] [Google Scholar]
- 4.Oechslin E, Jenni R. Left ventricular non-compaction revisited: A distinct phenotype with genetic heterogeneity? Eur Heart J. 2011;32:1446–1456. doi: 10.1093/eurheartj/ehq508. [DOI] [PubMed] [Google Scholar]
- 5.Boyd MT, Seward JB, Tajik AJ, Edwards WD. Frequency and location of prominent left ventricular trabeculations at autopsy in 474 normal human hearts: Implications for evaluation of mural thrombi by two-dimensional echocardiography. J Am Coll Cardiol. 1987;9:323–326. doi: 10.1016/s0735-1097(87)80383-2. [DOI] [PubMed] [Google Scholar]
- 6.Dawson DK, Maceira AM, Raj VJ, Graham C, Pennell DJ, Kilner PJ. Regional thicknesses and thickening of compacted and trabeculated myocardial layers of the normal left ventricle studied by cardiovascular magnetic resonance. Circ Cardiovasc Imaging. 2011;4:139–146. doi: 10.1161/CIRCIMAGING.110.960229. [DOI] [PMC free article] [PubMed] [Google Scholar]
- 7.Kohli SK, Pantazis AA, Shah JS, Adeyemi B, Jackson G, McKenna WJ, Sharma S, Elliott PM. Diagnosis of left-ventricular non-compaction in patients with left-ventricular systolic dysfunction: Time for a reappraisal of diagnostic criteria? Eur Heart J. 2008;29:89–95. doi: 10.1093/eurheartj/ehm481. [DOI] [PubMed] [Google Scholar]
- 8.Jacquier A, Thuny F, Jop B, Giorgi R, Cohen F, Gaubert JY, Vidal V, Bartoli JM, Habib G, Moulin G. Measurement of trabeculated left ventricular mass using cardiac magnetic resonance imaging in the diagnosis of left ventricular non-compaction. Eur Heart J. 2010;31:1098–1104. doi: 10.1093/eurheartj/ehp595. [DOI] [PubMed] [Google Scholar]
- 9.Petersen SE, Selvanayagam JB, Wiesmann F, Robson MD, Francis JM, Anderson RH, Watkins H, Neubauer S. Left ventricular non-compaction. Journal of the American College of Cardiology. 2005;46:101–105. doi: 10.1016/j.jacc.2005.03.045. [DOI] [PubMed] [Google Scholar]
- 10.Bild DE, Bluemke DA, Burke GL, Detrano R, Diez Roux AV, Folsom AR, Greenland P, Jacob DR, Jr., Kronmal R, Liu K, Nelson JC, O'Leary D, Saad MF, Shea S, Szklo M, Tracy RP. Multi-ethnic study of atherosclerosis: Objectives and design. Am J Epidemiol. 2002;156:871–881. doi: 10.1093/aje/kwf113. [DOI] [PubMed] [Google Scholar]
- 11.Young AA, Cowan BR, Thrupp SF, Hedley WJ, Dell'Italia LJ. Left ventricular mass and volume: Fast calculation with guide-point modeling on mr images. Radiology. 2000;216:597–602. doi: 10.1148/radiology.216.2.r00au14597. [DOI] [PubMed] [Google Scholar]
- 12.Beyar R, Shapiro EP, Graves WL, Rogers WJ, Guier WH, Carey GA, Soulen RL, Zerhouni EA, Weisfeldt ML, Weiss JL. Quantification and validation of left ventricular wall thickening by a three-dimensional volume element magnetic resonance imaging approach. Circulation. 1990;81:297–307. doi: 10.1161/01.cir.81.1.297. [DOI] [PubMed] [Google Scholar]
- 13.Peters F, Khandheria BK, Dos Santos C, Matioda H, Maharaj N, Libhaber E, Mamdoo F, Essop MR. Isolated left ventricular noncompaction in sub-saharan africa: A clinical and echocardiographic perspective. Circ Cardiovasc Imaging. 2012;5:187–93. doi: 10.1161/CIRCIMAGING.111.966937. [DOI] [PubMed] [Google Scholar]


