Abstract
First-principles quantum mechanical/molecular mechanical free energy calculations have been performed to provide the first detailed computational study on the possible mechanisms for reaction of proteasome with a representative peptide inhibitor, Epoxomicin (EPX). The calculated results reveal that the most favorable reaction pathway consists of five steps. The first is a proton transfer process, activating Thr1-Oγ directly by Thr1-Nz to form a zwitterionic intermediate. The next step is nucleophilic attack on the carbonyl carbon of EPX by the negatively charged Thr1-Oγ atom followed by a proton transfer from Thr1-Nz to the carbonyl oxygen of EPX (third step). Then, Thr1-Nz attacks on the carbon of the epoxide group of EPX, accompanied by the epoxide ring opening (SN2 nucleophilic substitution) such that a zwitterionic morpholino ring is formed between residue Thr1 and EPX. Finally, the product of morpholino ring is generated via another proton transfer. Noteworthy, Thr1-Oγ can be activated directly by Thr1-Nz to form the zwitterionic intermediate (with a free energy barrier of only 9.9 kcal/mol), and water cannot assist the rate-determining step, which is remarkably different from the previous perception that a water molecule should mediate the activation process. The fourth reaction step has the highest free energy barrier (23.6 kcal/mol) which is reasonably close to the activation free energy (~21 – 22 kcal/mol) derived from experimental kinetic data. The obtained novel mechanistic insights should be valuable for not only future rational design of more efficient proteasome inhibitors, but also understanding the general reaction mechanism of proteasome with a peptide or protein.
Introduction
Principles of intracellular protein synthesis and protein degradation remain to be among the most challenging questions in modern cell biology and biochemistry. The major component of the nonlysosomal protein degradation pathway is the proteasome, which is found in eukaryotes as well as in prokaryotes.1 The proteasome plays a central role in maintaining cellular homeostasis, in controlling the cell cycle, removing misfolded proteins that can be toxic, and regulating the immune system.2 Considering its central role in maintaining cellular homeostasis, it is not surprising to note that proteasome has been implicated as an important drug target in the development of many human diseases. For example, the Food and Drug Administration (FDA) has approved the use of the proteasome inhibitor bortezomib in the treatment of multiple myeloma in 2003.3 The chemical structures identified in some of the early proteasome inhibitors have led to the development of new anticancer drugs (CEP-18770, Carfilzomib, and NPI-0052).4 Although it remains less clear why these proteasome inhibitions are more toxic to tumor cells than to normal cells, the anticancer activity of proteasome inhibitors has led to an increased level of interest in novel components that interfere with proteasome function.5 In fact, proteasome has emerged as a significant target in the search for novel cancer therapeutics.4, 6–8 Noteworthy, there is a new strategy to use HIV protease-mediated activation of sterically capped proteasome inhibitor for selectively killing the HIV-infected cells recently, which demonstrates that certain proteasome inhibitors could be useful in the development of new tools for chemical biology and future therapeutics.9 Notably, majority of currently known inhibitors of proteasome are peptides. The peptide inhibitors are expected to form covalent bonds with proteasome, which is similar to the initial reaction steps of proteasome with various proteins (see below for the detailed discussion).
The X-ray crystal structure of the mammalian constitutive (or regular) 20S proteasome has revealed that it is composed of 28 subunits arranged in a unit as four homoheptameric rings (α7β7β7α7), and each homoheptameric ring contains seven different subunits.10 Moreover, there are three proteasome β-type subunits (β1, β2, and β5) with the catalytic activity (the active sites of proteasome), and all of them have an N-terminal threonine residue (Thr1) which can initiate nucleophilic attack on the peptides (proteins or peptide inhibitors). The three catalytically active sites are β1, β2, and β5 with caspase-like (C-L), trypsin like (T-L), and chymotrypsin-like (CT-L) activities, respectively. Remarkably, the X-ray structure of proteasome shows that the binding cavity in catalytic sites is usually formed between two proteasome subunits.11 For example, the epoxide group of EPX binds to the active site of subunit β5 through covalent interaction, and residues from the subunit β6 form a part of the binding cavity and interact with the other end of EPX.12 So far, many X-ray crystal structures of proteasome complexes with the various inhibitors have been reported.12–20 However, these X-ray crystallization studies could not accurately determine the details of the reaction process, but only detect the non-covalent binding mode of cyclic peptide inhibitor,20 or the covalent binding mode of the final product of epoxyketone inhibitor,12 boronic acid inhibitor,13 peptide aldehyde inhibitor,14, 15 β-lactone inhibitor,16, 17 vinyl sulfone inhibitor,18 and vinyl ketone inhibitor.19 Thus, the understanding of the detailed inhibition process (reaction pathway) remains incomplete.
The development of proteasome inhibitors has been paid much attention, given its critical role in intracellular processes such as cell cycle progression, antigen presentation, and cytokine-stimulated signal transduction.21 Thus far, there have been many types of proteasome inhibitors reported including peptide aldehydes,14, 22, 23 arecoline oxide tripeptides,24, 25 retro hydrazino-azapeptoids,26 proline- and arginine-rich peptides,27 dipeptidyl boronates,28 dipeptidyl boronic acids,29–31 β-lactones,16, 17, 32, 33 epoxyketones,34–37 vinyl sulfones,38–40 vinyl ketones,19 α,β-unsaturated N-acylpyrrole peptidyl derivatives,41 cyclic peptides,20 and so on.42–45 These proteasome inhibitors can be mainly grouped into several classes according to their chemical properties, such as peptide aldehydes, boronic acid inhibitors, β-lactones, epoxyketones, vinyl sulfones, vinyl ketones, and cyclic peptides etc.1, 46–49 Different types of inhibitors may have different binding modes in the active sites of proteasome. For example, the peptide aldehyde inhibitors (such as Ac-LLnL-al) form hemiacetal bonds between the aldehyde group and Thr1-Oγ of the active site (Scheme S1A of Supporting Information).14, 15, 46 The inhibition of boronic acid inhibitors (such as bortezomib) is mediated by the boron atom that binds covalently to the nucleophilic oxygen Thr1-Oγ (Scheme S1B of Supporting Information).13, 46 The carbonyl group of β-lactone inhibitors (such as NPI-0047) can also react with Thr1-Oγ to form a covalent bond (Scheme S1C of Supporting Information).17, 50 For vinyl surfone inhibitors (such as Z-L3VS)18, 38, 39 and vinyl ketone inhibitors (such as syringolin A),19 both of them are the Michael-attacked on the olefin carbon18, 19 by Thr1-Oγ to form a covalent bond and, thus, they should share a similar inhibition reaction mechanism (Scheme S1D and S1E of Supporting Information). Moreover, the crystal structure revealed the formation of a morpholino ring between Thr1 residue and EPX which is a kind of epoxyketone inhibitors (Scheme S1F of Supporting Information).12 In addition, another class of cyclic peptides (TMC-95 and its analogues) is the proteasome inhibitors that do not readily form a covalent bond with the Thr1 residue in the active site.20 From the above examples (Scheme S1A–F of Supporting Information), it can be concluded that Thr1-Oγ should be activated, and the activated Thr1-Oγ will form a covalent bond with the peptide inhibitor. In particular, the carbonyl carbon of peptide aldehyde inhibitors, β-lactone inhibitors, and epoxyketone inhibitors can form a covalent bond with the activated Thr1-Oγ in the active site. Thus, their inhibition mechanisms should be all similar to the catalytic mechanism of proteasome (Scheme 1). Among all of these inhibitors, epoxomicin (EPX) is particularly interesting, as it is a representative peptide inhibitor of proteasome.34, 51 Unlike many other proteasome inhibitors, EPX is specific for proteasome. It can irreversibly inhibit proteasome without inhibiting other proteases such as calpain, papain, cathepsin B, chymotrypsin, trypsin and so on. Hence, EPX was chosen as a representative peptide inhibitor in our study on the fundamental mechanism for reaction of proteasome with a peptide inhibitor.
Scheme 1.
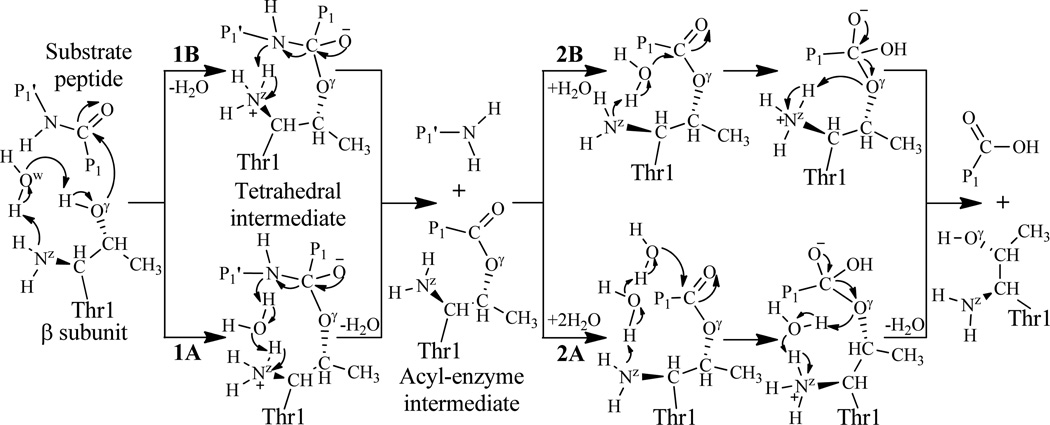
The previously proposed mechanisms leading to substrate peptide bond hydrolysis by the N-terminal Thr1 residue of proteasome. The Pn or Pn′ represents an amino acid residue, and the number n (n=1) refers to the nth residue to the cleavage site: P1 providing the carbonyl and P1′ the amino component.
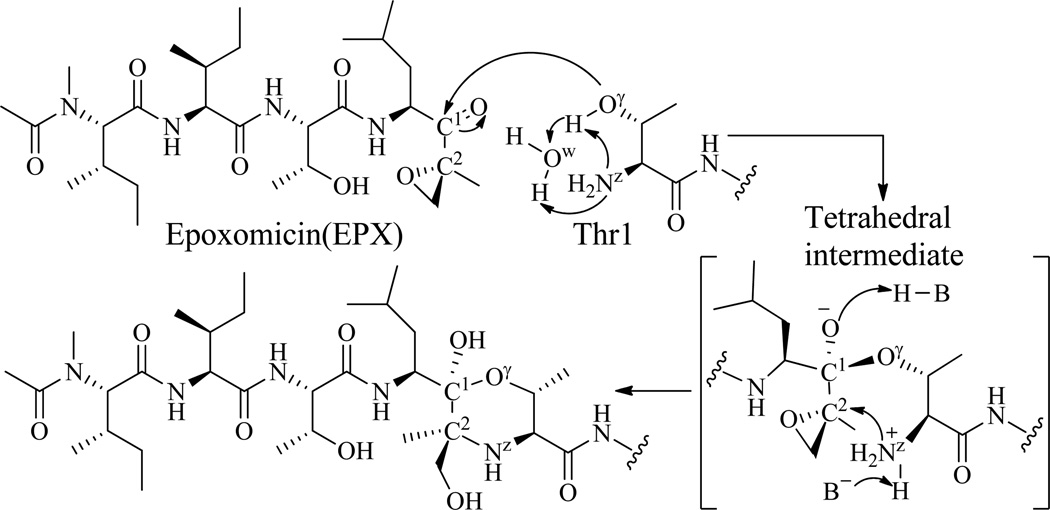
During the past decades, it was unclear how proteasome reacts with a peptide bond of a protein and how the covalent inhibition of proteasome occurs. Depicted in Scheme 1 is proteasome-catalyzed proteolysis mechanisms suggested in literature.4, 17, 18, 46, 52, 53 According to the suggested mechanisms, for the initial step of the reaction, a water molecule should be present to mediate the proton transfer between Thr1-Oγ and Thr1-Nz, resulting in the formation of a tetrahedral intermediate.4, 17, 18, 46, 52, 53 However, it has been unclear whether the nucleophile Thr1-Oγ is activated by its N-terminal amino group (Thr1-NzH2), directly or via a water molecule nearby. The other reaction steps also involve proton transfer which may or may not be assisted by an additional water molecule. Hence, there are several possible reaction pathways (depicted in Scheme 1), depending on whether each proton-transfer process is also assisted by an additional water molecule or not. Specifically, the water-assisted proton-transfer processes 1A4, 17, 52, 53 and 2A52, 53 depicted in Scheme 1 were well-recognized for the acylation and deacylation stages, respectively, whereas the direct proton-transfer process 1B or 2B depicted in Scheme 1 was also considered possible for the acylation46 or deacylation4, 17 stage. For comparison, depicted in Scheme 2 is the suggested inhibition reaction mechanism of proteasome with EPX.12 According to the suggested inhibition reaction mechanism, a water molecule is also expected to mediate the proton transfer between Thr1-Oγ and Thr1-Nz, and there might be alternative pathways for the subsequent reaction steps concerning the formation of the morpholino ring, as shown in Scheme 2. In fact, there is no enough evidence in both experiment and theory to show what the actual catalytic or inhibition mechanism should be. How proteasome actually reacts with peptides (peptide inhibitors or proteins) remains a challenging question.
Scheme 2.
The previously proposed mechanism for the reaction of proteasome with EPX. Nucleophilic attack by Thr1-Oγ on EPX results in hemiacetal formation, followed by subsequent cyclization of Thr1-Nz onto the epoxide, resulting in formation of the morpholino adduct. Candidate residues for H-B and B− are the Thr1 amino terminus, a bound water molecule, and invariant Ser130.
In particular, how Thr1-Oγ is activated and then reacts with peptides (proteins or peptide inhibitors) has been mysterious in the past decades. The mechanistic similarity between the proteins and peptide inhibitors in their reactions with proteasome makes more interesting the detailed studies on the fundamental reaction pathway for proteasome with a peptide inhibitor like EPX, as understanding the detailed reaction pathway for proteasome with a peptide inhibitor like EPX should also shed light on the fundamental mechanism for proteasome with other peptides (peptide inhibitors or proteins). The mechanistic insights should also be valuable for future rational design of novel, more potent proteasome inhibitors.
Concerning the interaction of proteasome with EPX, our previous molecular dynamics (MD) simulations54 have predicted the favorable binding mode of EPX with proteasome in the β5 catalytic site, but we did not study the subsequent structural transformation or reaction after the initial proteasome-EPX binding. In the present computational study, we have further explored the possible reaction pathways for subsequent chemical reaction of EPX with proteasome in the β5 catalytic site by performing further MD simulations and first-principles quantum mechanical/molecular mechanical (QM/MM)-free energy (QM/MM-FE) calculations. In these QM/MM-FE calculations, first-principles QM/MM reaction-coordinate calculations were followed by free energy perturbation (FEP) calculations to account for the dynamic effects of the protein environment on the free energy profile for the inhibition reaction process. Our QM/MM calculations are based on the pseudobond first-principles QM/MM approach.55–57 The computational results clearly reveal the most favorable reaction pathway and the corresponding free energy profile. Based on the calculated free energy profile for the reaction process, the rate-determining step is identified, and the roles of essential residues are discussed on the basis of the QM/MM-optimized geometries.
Computational Methods
Preparation of Initial Structure of the Reaction System
The initial structure of the enzyme reaction system in the reactant state (ER) was obtained from the X-ray crystal structure of proteasome-EPX complex (PDB ID: 1G65)12 and our previously performed MD simulation on EPX binding with proteasome in the β5 catalytic site.54 The atomic charges of the EPX atoms used in the MD simulation and subsequent QM/MM calculations were the restrained electrostatic potential (RESP) charges. These RESP charges were determined by performing ab initio electrostatic potential calculations at the HF/6-31G* level using Gaussian03 program,58 followed by fitting with the standard RESP procedure implemented in the Antechamber module of the AMBER11 program.59 As noted above, structurally, proteasome is composed of 28 subunits (α7β7β7α7) and contains six active sites (three types), i.e. two β1 sites, two β2 sites, and two β5 sites, that are functionally independent. Each active site exists in the interface of two neighboring subunits. All of these active sites are very similar, including the reactive residue Thr1, and share the same reaction mechanism. Based on the X-ray crystal structure of proteasome-EPX complex, the β5 active site exists in the interface of the subunits β5 and β6. Thus, the initial structure of the proteasome-EPX complex was constructed by retaining only two subunits (β5 and β6) and EPX.12, 54 The other subunits are far away from the β5 active site and, therefore, are not expected to significantly affect the reaction in the β5 active site. The protein-EPX binding complex was neutralized by adding four chloride ions and was solvated in an orthorhombic box of TIP3P water molecules60 with a minimum solute-wall distance of 10 Å. The solvated system was refined by performing a ~48 ns MD simulation, and more details of MD simulations can be found in our previous work.54 A residue-based cutoff of 12 Å was utilized for the noncovalent interactions. The final snapshot being close to the average structure of the MD simulation was used as the initial structure for the QM/MM reaction-coordinate calculations. As we are mainly interested in the reaction center, the water molecules beyond 50 Å of the C* atom (Scheme 3) in EPX were removed and, thus, the QM/MM system for enzyme-EPX complex has 7,130 water molecules and a total of 27,875 atoms. The QM/MM interface was treated by using a pseudobond approach.55–57 The used boundary of the QM-MM system for the whole reaction is indicated in the figures to be discussed below. Prior to the QM/MM geometry optimization, the initial structure of the reaction system was energy-minimized with the MM method by using the AMBER11 program,59 and the convergence criterion for energy gradient of 0.1 kcal·mol−1·Å−1 was achieved.
Scheme 3.
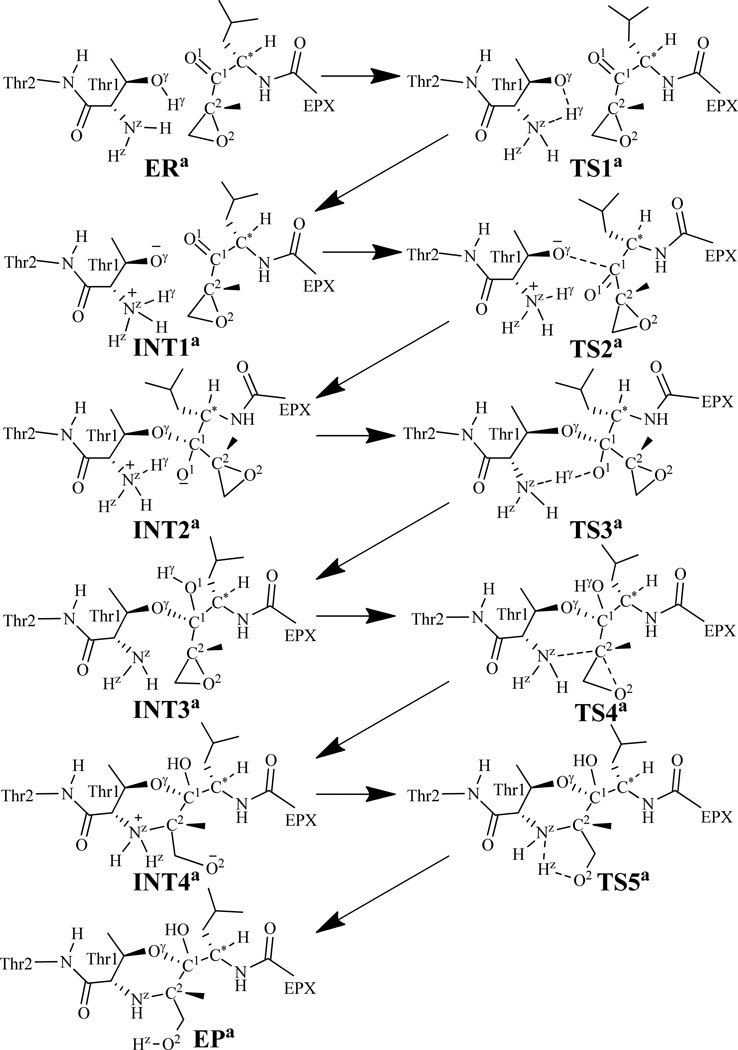
Possible pathway for the reaction of proteasome with EPX.
Minimum-Energy Path of the Reaction
With a reaction-coordinate driving method and an iterative energy minimization procedure,55 the enzyme reaction path was determined by the pseudobond QM/MM calculations at the B3LYP/6-31G*:AMBER level, in which the QM calculations were performed at the B3LYP/6-31G* level of theory by using a modified version61 of Gaussian03 program58 and the MM calculations were performed by using a modified version61 of the AMBER8 program.62 Normal mode analyses were performed to characterize the reactant, intermediates, transition sates, and the final product of the reaction process. In addition, single-point energy calculations were carried out at the QM/MM(B3LYP/6-31++G**:AMBER) level on the QM/MM-optimized geometries. Additional single-point QM/MM energy calculations using other QM methods, including the MP2,63, 64 B3P86,65 B3PW91,66 and recently developed M05-2X,67, 68 were also carried out with the same 6-31++G** basis set for comparison. Throughout the QM/MM calculations, the boundary carbon atoms were treated with improved pseudobond parameters.56 No cutoff for non-bonded interactions was used in the QM/MM calculations; the aforementioned residue-based cutoff of 12 Å was used only in the MD simulation prior to the QM/MM calculations. For the QM subsystem, the convergence criterion for geometry optimizations followed the original Gaussian03 defaults. For the MM subsystem, the geometry optimization convergence criterion was when the root-mean-square deviation (rmsd) of energy gradient is ≤ 0.1 kcal·mol−1·Å−1. The atoms within 20 Å of C* atom of EPX (Scheme 3) were allowed to move while all the other atoms outside this range were frozen in all QM/MM calculations. During the QM/MM geometry optimization, the QM and MM subsystems were energy-minimized iteratively. For each step of the iteration, the MM subsystem was energy-minimized when the QM subsystem was kept frozen, whereas the QM subsystem was energy-minimized when the MM subsystem was kept frozen.
Free Energy Perturbation
Free energy perturbation (FEP) can be performed to evaluate free energy change caused by a small structural change.69–71 The FEP method, in combination with the MD or Monte Carlo (MC) simulation, has been used to study organic reactions,71–73 protein-ligand interaction,71, 74–79 and protein stability.80, 81 After the minimum-energy path was determined by the QM/MM calculations, the free energy changes associated with the QM-MM interactions were determined by using the free energy perturbation (FEP) method.55 In the FEP calculations, sampling of the MM subsystem was carried out with the QM subsystem frozen at each state along the reaction path. The point charges on the frozen QM atoms used in the FEP calculations were determined by fitting the electrostatic potential (ESP) in the QM part of the QM/MM single-point calculations. The total free energy difference between the transition state and the reactant was calculated with the same procedure as used in our previous work on other reaction systems.61, 82–89 The FEP calculations enabled us to more reasonably determine the relative free energy changes due to the QM-MM interactions. Technically, the final (relative) free energy determined by the QM/MM-FE calculations was the QM part of the QM/MM energy (excluding the Coulumbic interaction energy between the point charges of the MM atoms and the ESP charges of the QM atoms) plus the relative free energy change determined by the FEP calculations. In the FEP calculations, the used time step was 2 fs, and bond lengths involving hydrogen atoms were constrained. In sampling of the MM subsystem by MD simulations, the temperature was maintained at 298.15 K. Each FEP calculation consisted of 50 ps of equilibration and 300 ps of sampling.
Most of the MD simulations were performed on a supercomputer (i.e. the Dell X-series Cluster with 384 nodes or 4,768 processors) at University of Kentucky’s Computer Center. Some other modeling and computations were carried out on SGI Fuel workstations in our own laboratory at University of Kentucky.
Results and Discussion
We have examined various possible reaction pathways by carrying out extensive QM/MM-FE calculations following the MD simulations. The MD simulations provide initial structures of the reaction system for the QM/MM reaction-coordinate calculations. In this section, below we first discuss the mechanistic insights obtained from the MD simulations and then the QM/MM results. Within the results obtained from QM/MM reaction-coordinate calculations, we first discuss the identified fundamental reaction pathway without accounting for the possibility of water-assisted proton transfer for any reaction step. Then, we discuss possible alternative reaction pathways in comparison the fundamental reaction pathway. Finally, we discuss the free energy profiles for the identified reaction pathways, and identify the most favorable reaction pathway and the rate-determining step.
Mechanistic insights from MD simulations
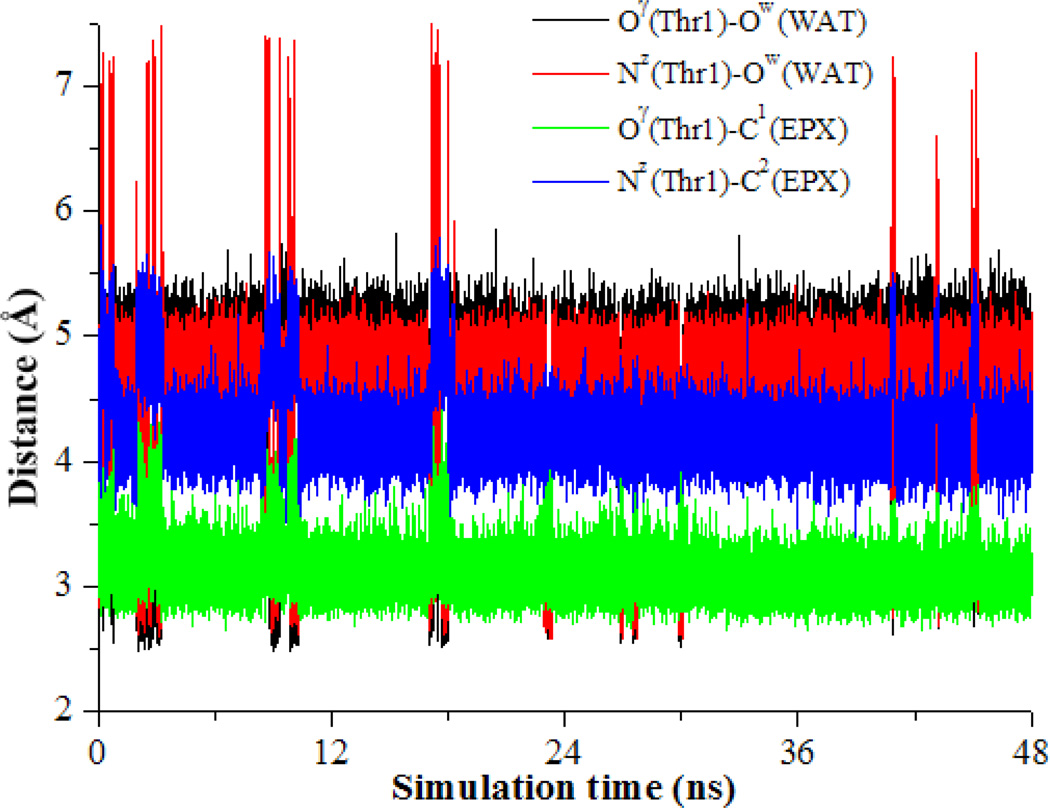
Based on the previously proposed reaction mechanism,4, 12, 17, 18, 46, 52, 53 a water molecule should exist in the reaction between the Thr1-Oγ atom and the Thr1-NzH2 group to meditate the proton transfer process (see Schemes 1 and 2). To verify whether a water molecule could exist between them, a ~48 ns MD simulation was performed on the ER structure. Based on the MD simulation results, only one water molecule could be close to both the Thr1-Nz and Thr1-Oγ atoms. As seen in Figure 1, we tracked the changes (time courses) of two key internuclear distances, i.e. Nz(Thr1)–Ow(WAT) distance (between the Thr1-Nz atom and the oxygen atom of the water molecule) and Oγ(Thr1)–Ow(WAT) distance (between the Thr1-Oγ atom and the oxygen atom of the water molecule). In addition, as the new covalent bonds C1-Oγ and C2-Nz will be formed during the inhibition reaction, we also tracked the changes of the Oγ(Thr1)–C1(EPX) distance (between the Thr1-Oγ atom and the C1 atom of EPX) and the Nz(Thr1)–C2(EPX) distance (between the Thr1-Nz atom and the C2 atom of EPX) in Figure 1.
Figure 1.
Key internuclear distances vs the simulation time in the MD-simulated ER structure.
As depicted in Figure 1, the average Nz(Thr1)–Ow(WAT), Oγ(Thr1)–Ow(WAT), Oγ(Thr1)–C1(EPX), and Nz(Thr1)–C2(EPX) distances are ~4.58, ~4.68, ~3.10, and ~4.27 Å, respectively. Overall, the average Oγ(Thr1)–C1(EPX) and Nz(Thr1)–C2(EPX) distances are significantly shorter than the corresponding average Nz(Thr1)–Ow(WAT) and Oγ(Thr1)–Ow(WAT) distances, which suggests that the water molecule was not in a favorable position to assist the proton transfer. Checking the distances in all of 48,000 snapshots depicted in Figure 1, only 2,603 snapshots (~5.4%) were suitable for the water-assisted proton-transfer when the Nz(Thr1)–Ow(WAT) and Oγ(Thr1)–Ow(WAT) distances were significantly shorter than the corresponding Oγ(Thr1)–C1(EPX) and Nz(Thr1)–C2(EPX) distances. In the remaining 45,397 snapshots (~94.6%), the Nz(Thr1)–Ow(WAT) and Oγ(Thr1)–Ow(WAT) distances were too long for the water-assisted proton-transfer. So, ~94.6% snapshots favor the pathway of activating Thr1-Oγ directly by Thr1-Nz to form a zwitterionic intermediate. This pathway is associated with a direct proton transfer from Thr1-Oγ to Thr1-Nz. Based on the insights obtained from the MD simulation, we examined both the direct proton-transfer and water-assisted proton-transfer pathways that might be competing. For convenience of the discussion below (including all Schemes and Figures), we use superscript “a” to represent the stationary states associated with the direct proton-transfer reaction pathway and superscript “b” the stationary states corresponding to the water-assisted proton-transfer reaction pathway.
Fundamental reaction pathway associated with the direct proton transfer
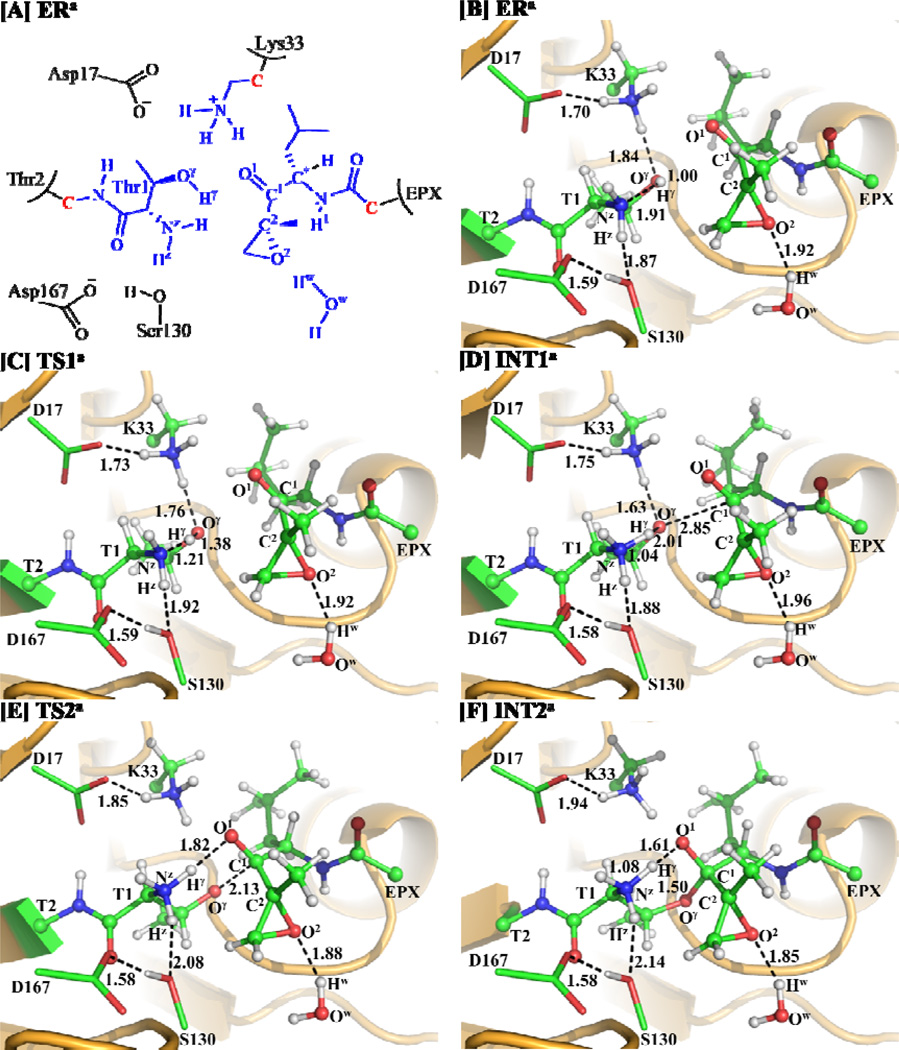
In light of the results obtained from the MD simulation, we may first reasonably assume in the present study that Thr1-Oγ might be activated directly by its N-terminal amino group (Thr1-NzH2). Further, combining the computational insights with available structural information of the inhibition,12 we have proposed a new hypothesis of the possible reaction pathway of the inhibition reaction of EPX with proteasome, as depicted in Scheme 3. The possible reaction pathway depicted in Scheme 3 has been confirmed by our QM/MM reaction-coordinate calculations discussed below. During the QM/MM calculations, as shown in Figure 2A, the atoms colored in blue were treated by QM method, the boundary atoms colored red in Figure 2A were treated with the improved pseudobond parameters,56 and the other atoms of the reaction system were considered as the MM subsystem.
Figure 2.
(A) Division of the QM/MM system. Atoms in blue color were treated as QM part. The boundary carbon atoms colored in red were treated with the improved pseudobond parameters. All of the other atoms were considered as the MM subsystem. (B–F) Optimized geometries for the key states during the reaction process for the inhibition of proteasome (β5 active site) by EPX. The geometries were optimized at the QM/MM(B3LYP/6-31G*:AMBER) level. The key distances in the figures are in Å. Carbon, oxygen, nitrogen, and hydrogen atoms are colored in green, red, blue, and white, respectively. The backbone of the protein is rendered as ribbon and colored orange. The QM atoms are represented as balls and sticks and the surrounding residues are rendered as sticks or lines. Figures to be discussed below are represented using the same method.
As shown in Scheme 3, the inhibition process of proteasome by EPX consists of five steps. Our QM/MM reaction-coordinate calculations were performed in order to demonstrate the reaction mechanism for the inhibition of proteasome by EPX. Below we describe the details of the uncovered reaction pathway and the obtained free energy profile.
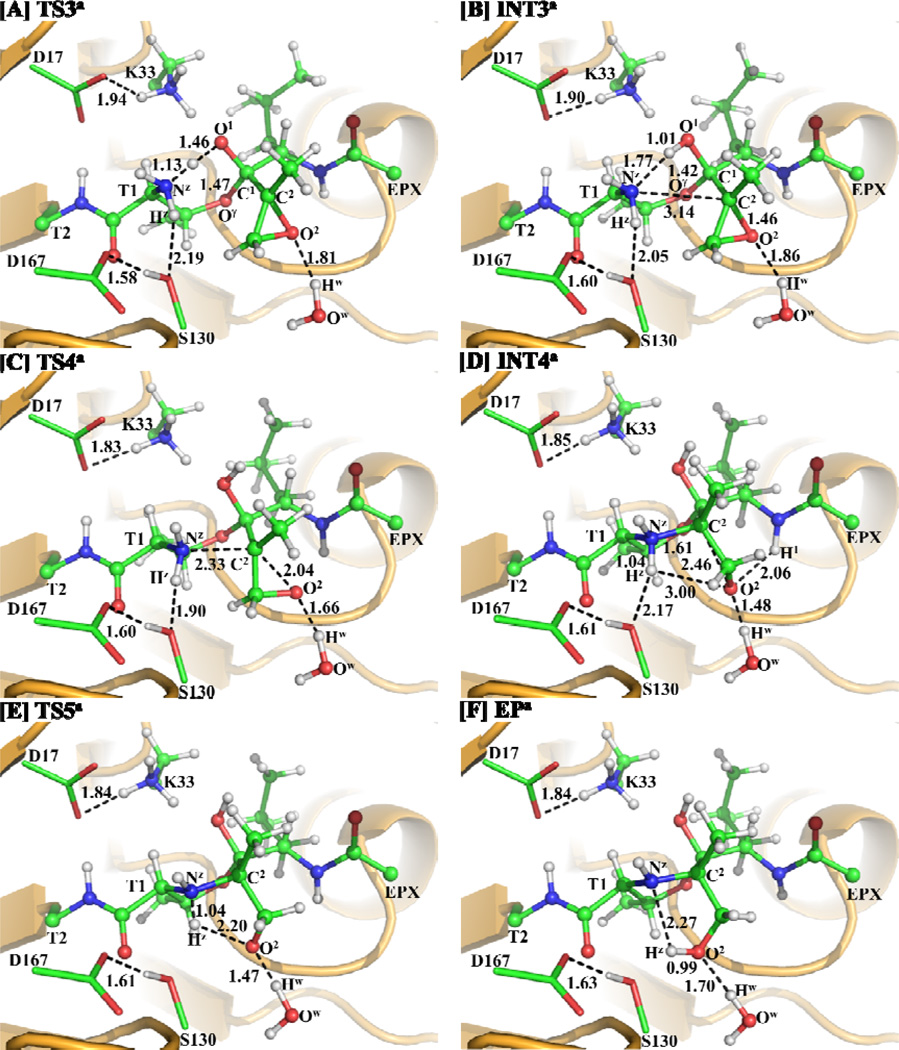
Starting from our QM/MM-optimized ERa structure of the enzyme-EPX reaction system, we performed QM/MM reaction-coordinate calculations at the B3LYP/6-31G*:AMBER level. The results obtained from the QM/MM calculations revealed that the inhibition of proteasome by EPX indeed consists of five reaction steps as depicted in Scheme 3. The first reaction step is a direct proton (Hγ) transfer from the Thr1-Oγ atom to the Thr1-Nz atom, forming a zwitterionic intermediate INT1a via transition state TS1a. The second reaction step is the nucleophilic attack on the EPX-C1 atom by the activated Thr1-Oγ via transition state TS2a. The third reaction step is the proton (Hγ) transfer from Thr1-Nz to EPX-O1 via transition state TS3a. The fourth reaction step is a concerted process, i.e. nucleophilic attack of Thr1-Nz on EPX-C2, accompanied with the breaking of the C2–O2 bond, resulting in the formation of another zwitterionic intermediate INT4a via transition state TS4a. The fifth reaction step is a proton (Hz) transfer from Thr1-Nz to EPX-O2, which proceeds from intermediate INT4a to product EPa via transition state TS5a. Figures 2 and 3 depict the QM/MM-optimized geometries of the reactant, intermediates, transition states, and product of the reaction process.
Figure 3.
Optimized geometries for the key states for the reaction process of the EPX inhibition. The geometries were optimized at QM/MM(B3LYP/6-31G*:AMBER) level. The color scheme is the same as that of Figure 2.
Step 1: Proton Hγ Transfers Directly from Thr1-Oγ to Thr1-Nz
As shown in Figure 2B for the QM/MM-optimized ERa structure, both the hydrogen bond distance between the Thr1-Oγ atom and the closest hydrogen atom of the Lys33-NH3+ group and the hydrogen-bond distance between the Thr1-Hz and Ser130-O atoms are shorter than 1.90 Å. The hydrogen-bond distance between the Lys33-NH3+ hydrogen and Asp17-CO2− oxygen atoms is 1.70 Å, while the hydrogen-bond distance between the Ser130-H (hydroxyl hydrogen) and the Asp167-CO2− oxygen is 1.59 Å, showing a hydrogen-bond network in the reaction center. Moreover, a water molecule nearby EPX is hydrogen-bonded with the EPX-O2 atom with a distance of 1.92 Å between the hydrogen and oxygen atoms.
As shown in Scheme 3, the reaction step 1 involves the breaking of the Hγ–Oγ bond and the formation of the Hγ–Nz bond. So, the changes in the Hγ–Oγ distance (RHγ-Oγ) and Hγ–Nz distance (RHγ-Nz) can reflect the nature of reaction step 1. Therefore, RHγ-Oγ–RHγ-Nz was set as the reaction coordinate for reaction step 1. As shown in the QM/MM-optimized geometries (Figure 2B to 2D), the RHγ-Oγ elongates from 1.00 Å in ERa (Figure 2B) to 1.38 Å in TS1a (Figure 2C), while the RHγ-Nz shortens from 1.91 Å in ERa (Figure 2B) to 1.21 Å in TS1a (Figure 2C) and then to 1.04 Å in INT1a (Figure 2D). Remarkably, the intermediate INT1a is a very active zwitterion, and it can react with the carbonyl group of EPX readily. Noteworthy, during this reaction step, the hydrogen bond between the Thr1-Oγ atom and Lys33-NH3+ group is strengthened, which helps to stabilize the zwitterionic intermediate INT1a.
Step 2: Nucleophilic Attack on EPX-C1 by Thr1-Oγ
In this step, the negatively charged Thr1-Oγ atom initiates nucleophilic attack on EPX-C1 atom and the Oγ–C1 bond is formed. This reaction step involves the formation of the Oγ–C1 bond. The nature of such process can be represented by the change of the Oγ–C1 distance (ROγ-C1). Thus the reaction coordinate for this step was chosen as −ROγ-C1. The distance ROγ-C1 is shortened from 2.85 Å in INT1a (Figure 2D) to 2.13 Å in TS2a (Figure 2E) and then to 1.50 Å in a charged tetrahedral intermediate INT2a (Figure 2F).
Step 3: Proton Transfer from Thr1-Nz to EPX-O1
In this step, the proton (Hγ) transfers from Thr1-Nz to EPX-O1. This reaction step involves the breaking of the Nz–Hγ bond and the formation of the O1–Hγ bond. The nature of the process can be represented by the changes of the Nz–Hγ distance (RNz-Hγ) and O1–Hγ distance (RO1-Hγ). Thus, the reaction coordinate for this step was chosen as RNz-Hγ–RO1-Hγ. During this reaction step, the distance RO1-Hγ is shortened from 1.61 Å in INT2a (Figure 2F) to 1.46 Å in TS3a (Figure 3A) and then to 1.01 Å in an uncharged tetrahedral intermediate INT3a (Figure 3B). Meanwhile, RNz-Hγ changes from 1.08 Å in INT2a to 1.13 Å in TS3a and then to 1.77 Å in INT3a.
Step 4: Nucleophilic Attack on EPX-C2 by Thr1-Nz and Breaking of the C2–O2 Bond
Along with the nucleophilic attack on the EPX-C2 atom by the Thr1-Nz atom, the C2–O2 bond is broken at the same time to generate an intermediate with a zwitterionic morpholino ring between Thr1 residue and EPX. This process is a SN2 nucleophilic substitution. The six-membered ring shows that the bonds between Thr1 residue and EPX might be too strong to break, but the zwitterion will make the intermediate INT4a very active, which facilitates the next reaction step. Such concerted process involves the breaking of the C2–O2 bond and the formation of the Nz–C2 bond (Scheme 3). Thus, the distances RC2-O2 and RNz-C2 were chosen to represent the reaction coordinate as RC2-O2–RNz-C2 for the current reaction step. In TS4a (Figure 3C), the distances RC2-O2 and RNz-C2 are 2.04 and 2.33 Å, respectively. Meanwhile, the hydrogen-bond distance between the water hydrogen and the O2 atom is 1.66 Å, and the hydrogen-bond distance between the Ser130-O and Thr1-Hz atoms is shortened to 1.90 Å, which should help to stabilize the transition state TS4a.
Step 5: Proton Transfer from the Nz Atom to the O2 Atom
As seen from Scheme 3, starting from intermediate INT4a, the negatively charged O2 atom abstracts a proton (Hz) from the positively charged Nz atom. The zwitterionic intermediate INT4a is expected to be rather unstable and active, but the negatively charged O2 atom in INT4a is stabilized by two hydrogen bonds: one is associated with a distance of 2.06 Å between the EPX-H1 and O2 atoms, and the other is associated with a distance of 1.48 Å between the water Hw and O2 atoms (see Figure 3D). Moreover, the hydrogen-bond distance between the Thr1-Hz and Ser130-O atoms increases to 2.17 Å in INT4a. This weakened hydrogen bonding interaction should be helpful for the proton (Hz) transfer process starting from INT4a.
Accompanied by the breaking of the Nz–Hz bond in the Thr1 side chain, the Hz–O2 bond is formed. The changes in distances RNz-Hz and RHz-O2 reflect the nature of the current reaction step. Thus, the reaction coordinate for the current reaction step was expressed as RNz-Hz–RHz-O2. While the distance RNz-Hz is 1.04 Å in both INT4a and TS5a (Figure 3E), and then changes to 2.27 Å in EPa (Figure 3F), the distance RHz-O2 shortens from 3.00 Å in INT4a to 2.20 Å in TS5a, and then to 0.99 Å in EPa. As depicted in Figure 3, while the Thr1-Hz atom approaches the O2 atom during the structural transformation from INT4a to TS5a, one hydrogen bond (with a water molecule) weakens and two hydrogen bonds (between the Thr1-Hz and Ser130-O and between the EPX-H1 and O2 atoms) are broken. One of the two broken hydrogen bonds is between the QM region (Thr1-Hz) and MM region (Ser130-O) and, thus, the calculated energy of this transition state is relatively less reliable. In addition, the C–C bond on the epoxide group of EPX rotates while the proton (Hz) transfers from the Nz atom to the O2 atom.
Other possible transition states associated with the direct proton transfer
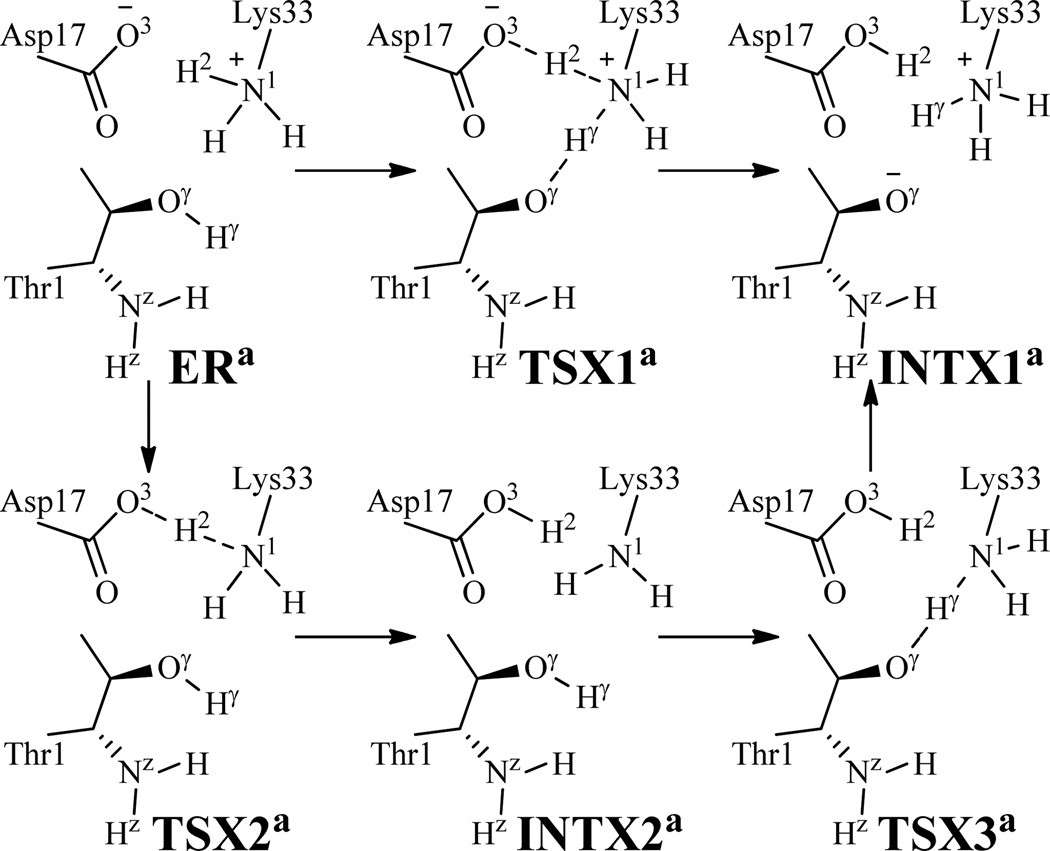
As shown in ERa (Figure 2B), the cationic head of Lys33 side chain (Lys33-NH3+) is very close to Thr1-Oγ. We tried to examine the possibilities of Lys33-NH3+ participating in the reaction along with the carboxylate group of Asp17 side chain (Asp17-CO2−) to activate Thr1-Oγ. To examine these possibilities, both Asp17 and Lys33 are included in the QM part for additional QM/MM reaction-coordinate calculations. Based on the ERa structure, Lys33-NH3+ and Asp17-CO2− could participate in the reaction in two possible ways (Scheme 4). One is a concerted double proton transfer from Lys33-N1 to Asp17-O3 (H2) and from Thr1-Oγ to Lys33-N1 (Hγ) for the structural transformation from ERa to the speculated INTX1a via the speculated transition state TSX1a. The reaction coordinate used in the QM/MM reaction-coordinate calculations for this possible pathway was RHγ-Oγ–RHγ-N1+RH2-N1–RH2-O3. It turned out that the energy of the reaction system always became higher and higher when the RHγ-Oγ–RHγ-N1+RH2-N1–RH2-O3 value became larger and larger; there was no intermediate (INTX1a) or transition state (TSX1a) along this reaction coordinate. The full geometry optimization starting from any point along this speculated reaction coordinate always went to ERa. In other words, on the potential energy surface, there was no local minimum associated with INTX1a and there was no first-order saddle point associated with TSX1a. The other possible pathway is the stepwise proton transfer, i.e. the proton (H2) transfer from Lys33-N1 to Asp17-O3 for the structural transformation from ERa to INTX2a via transition state TSX2a, followed by the proton (Hγ) transfer from Thr1-Oγ to Lys33-N1 for the structural transformation from INTX2a to INTX1a via transition state TSX3a. The reaction coordinate used in the QM/MM reaction-coordinate calculations for the first step of the possible stepwise proton transfer was RH2-N1–RH2-O3. The reaction-coordinate calculations revealed that the energy of the reaction system always became higher and higher when the RH2-N1–RH2-O3 value became larger and larger. Clearly, there was no intermediate (INTX2a) or transition state (TSX2a) along this reaction coordinate. These additional QM/MM reactioncoordinate calculations suggest that Asp17-CO2− and Lys33-NH3+ do not participate in the reaction process.
Scheme 4.
Two possible reaction pathways for the structural transformation from ERa to INTX1a examined in this study.
We also considered whether ERa can directly change to INT2a via a concerted process. The concerted process from ERa to INT2a involves the breaking of the Hγ–Oγ bond and the formation of the Hγ–Nz and C1–Oγ bonds. Hence, RHγ-Oγ–RHγ-Nz–RC1-Oγ was used as the reaction coordinate in the QM/MM reaction-coordinate calculations for this possible pathway. However, the reaction-coordinate calculations actually led to the same transition state (TS1a) and intermediate (INT1a) depicted in Figure 2, suggesting that the proposed concerted process from ERa to INT2a does not exist.
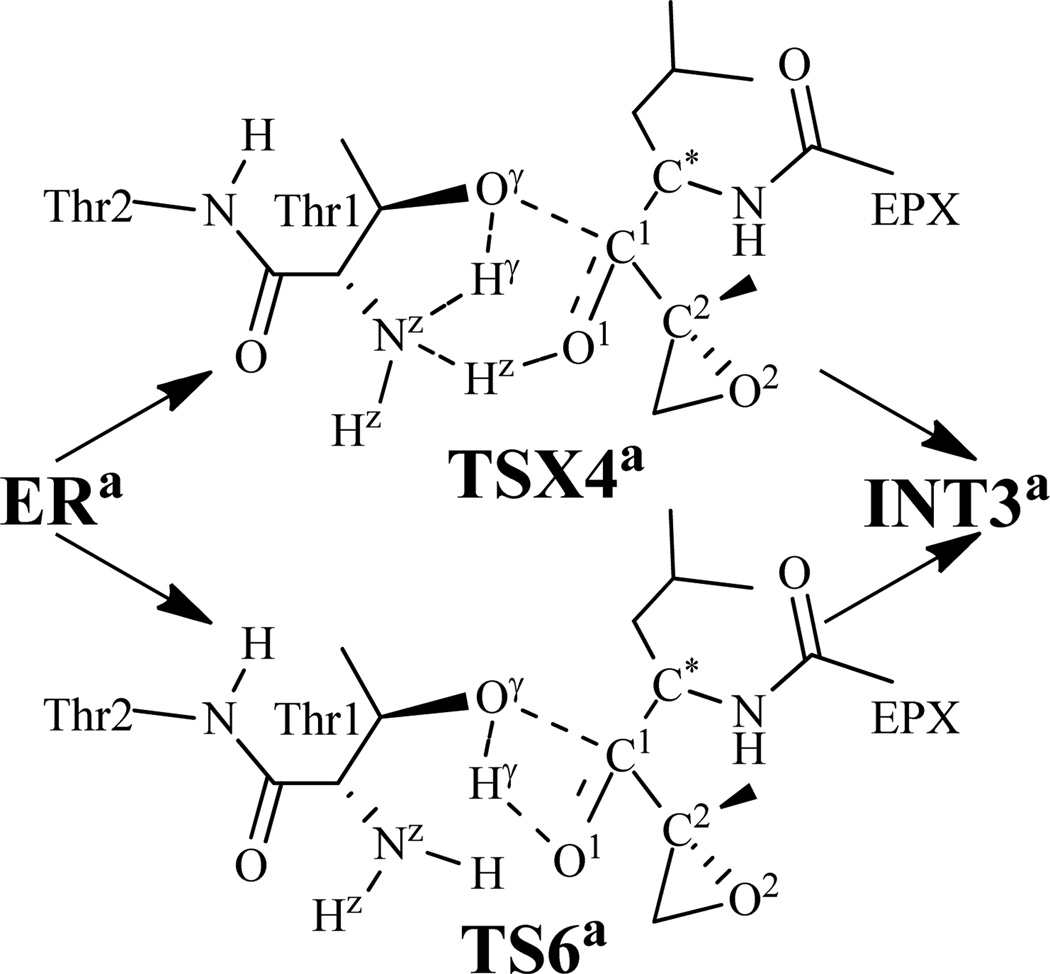
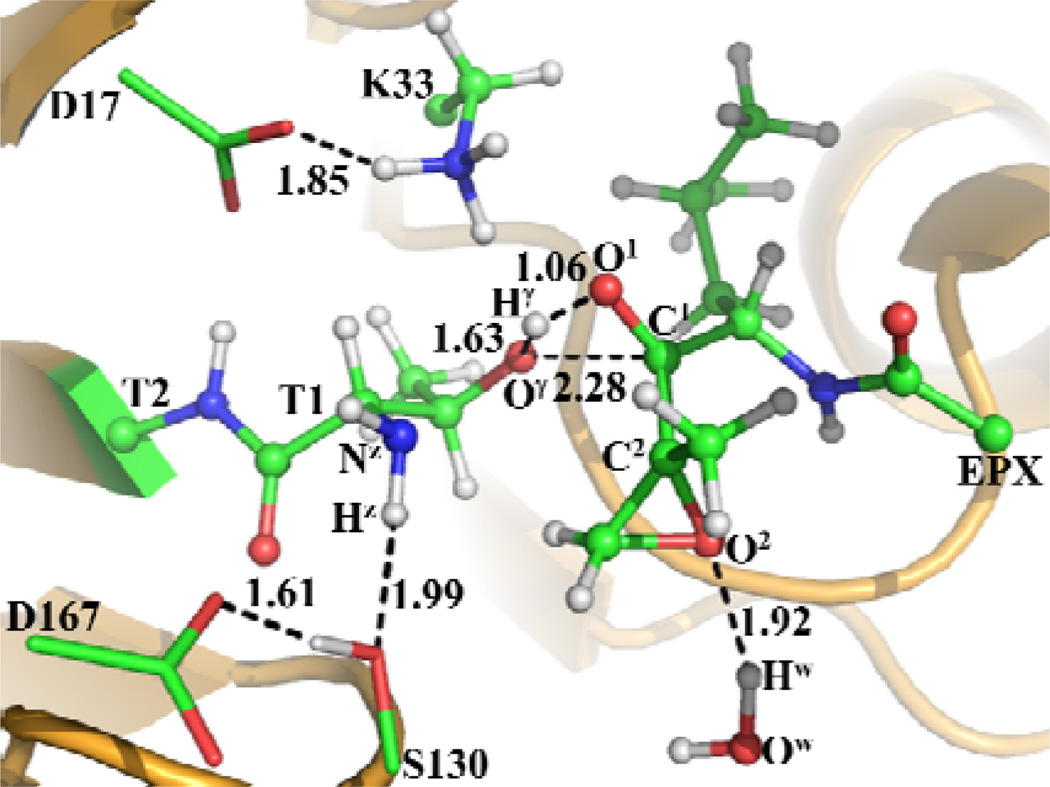
The other possible reaction pathways that we also accounted for are associated with the direct transformation from ERa to INT3a via transition state TSX4a or TS6a depicted in Scheme 5. The transition state TSX4a involves the breaking of the Hγ–Oγ and Hz–Nz bonds and the formation of the Hγ–Nz, Hz–O1, and C1–Oγ bonds. Hence, RHγ-Oγ–RHγ-Nz+RHz-Nz–RHz-O1–RC1-Oγ was used as the reaction coordinate for the QM/MM reaction-coordinate calculations on the pathway associated with TSX4a. However, the reaction-coordinate calculations still led to the same transition state (TS1a) and intermediate (INT1a) depicted in Figure 2, suggesting that the proposed reaction process from ERa to INT3a does not exist. On the other hand, the QM/MM reaction-coordinate calculations using RHγ-Oγ–RHγ-O1–RC1-Oγ as the reaction coordinate indeed led to the transition state TS6a connected to INT3a. In the optimized TS6a geometry, the Hγ–Oγ, Hγ–O1, and C1–Oγ distances are 1.63, 1.06, and 2.28 Å, respectively (Figure 4).
Scheme 5.
Two possible transition states for the structural transformation from ERa to INT3a examined in this study.
Figure 4.
Optimized geometry of transition state TS6a. The geometry was optimized at QM/MM(B3LYP/6-31G*:AMBER) level. The color scheme is the same as that of Figure 2.
Similarly, for the structural transformation from INT3a to EPa, we also accounted for another possible concerted reaction pathway in which the transition state involves the breaking of the C2–O2 and Nz–Hz bonds and the formation of the Nz–C2 and Hz–O2 bonds. Hence, RC2-O2–RNz-C2+RNz-Hz–RHz-O2 was used as the reaction coordinate for the QM/MM reaction-coordinate calculations for this possible concerted reaction pathway. However, the reaction-coordinate calculations actually led to the transition state (TS4a) and intermediate (INT4a) depicted in Figure 3. So, the QM/MM reaction-coordinate calculations do not support the hypothesis of the concerted reaction pathway.
Fundamental reaction pathway associated with the water-assisted proton transfer
As shown in Scheme 1, an additional water molecule may mediate the proton transfer processes of the reaction between the peptide and proteasome and, therefore, we also accounted for the possibility of the water-assisted proton-transfer pathway for each of the relevant reaction steps corresponding to the first, third, and fifth steps of the fundamental reaction pathway (associated with the direct proton transfer) depicted in Scheme 3. Depicted in Schemes 6 to 8 are the possible water-assisted proton-transfer pathways for these steps.
Scheme 6.
The possible water-mediated proton transfer during the structural transformation from ERb to INT1b via transition state TS1b examined in this study.
Scheme 8.
The possible water-mediated proton transfer during the structural transformation from INT4b to EPb via transition state TS5b examined in this study.
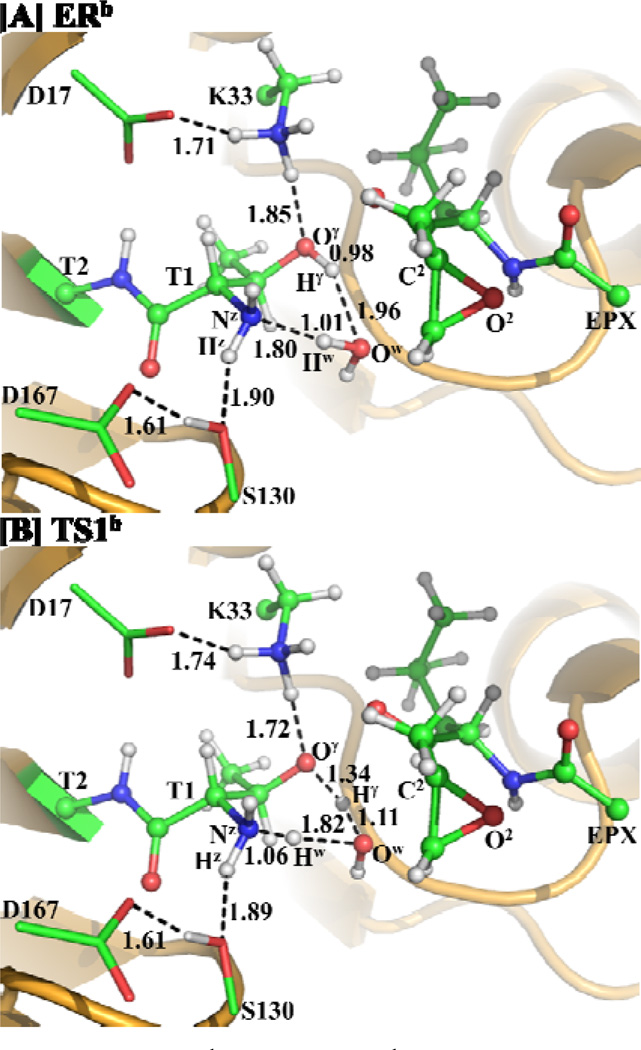
The possible water-mediated proton transfer depicted in Scheme 6 involves the breaking of the Oγ–Hγ and Ow–Hw bonds and the formation of the Ow–Hγ and Nz–Hw bonds. Thus, the distances ROγ-Hγ, ROw-Hw, ROw-Hγ, and RNz-Hw were chosen to represent the reaction coordinate as ROγ-Hγ+ROw-Hw–ROw-Hγ–RNz-Hw for the QM/MM reaction-coordinate calculations. The QM/MM reaction-coordinate calculations confirmed this water-assisted proton-transfer pathway. According to the reaction-coordinate calculations, the distances ROw-Hγ and RNz-Hw are shortened respectively from 1.96 and 1.80 Å in ERb (Figure 5A) to 1.11 and 1.06 Å in TS1b (Figure 5B). Meanwhile, the corresponding distances ROγ-Hγ and ROw-Hw are elongated from 0.98 and 1.01 Å in ERb to 1.34 and 1.82 Å in TS1b.
Figure 5.
Optimized geometries of ERb and TS1b. The geometries were optimized at QM/MM(B3LYP/6-31G*:AMBER) level. The color scheme is the same as that of Figure 2.
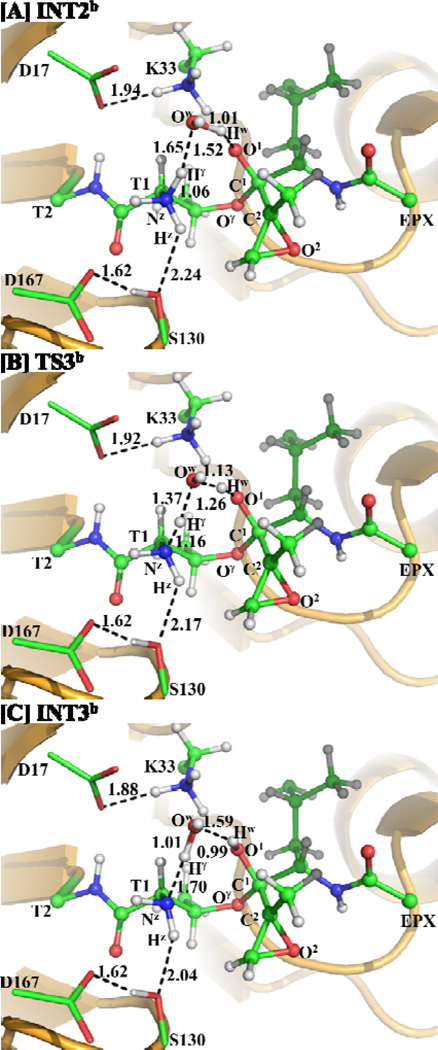
Similarly, a water molecule may also mediate the proton transfer during the transformation from INT2b to INT3b via transition state TS3b, as depicted in Scheme 7. This possible water-mediated proton-transfer pathway involves the breaking of the Nz–Hγ and Ow–Hw bonds and the formation of the Ow–Hγ and O1–Hw bonds. Thus, the distances RNz-Hγ, ROw-Hw, ROw-Hγ, and RO1-Hw were chosen to represent the reaction coordinate as RNz-Hγ+ROw-Hw–ROw-Hγ–RO1-Hw in the QM/MM reaction-coordinate calculations. According to the reaction-coordinate calculations, the distances ROw-Hγ and RO1-Hw are shortened respectively from 1.65 and 1.52 Å in INT2b (Figure 6A) to 1.37 and 1.26 Å in TS3b (Figure 6B), and then to 1.01 and 0.99 Å in INT3b (Figure 6C), while the corresponding distances RNz-Hγ and ROw-Hw are elongated from 1.06 and 1.01 Å in INT2b to 1.16 and 1.13 Å in TS3b and then to 1.70 and 1.59 Å in INT3b.
Scheme 7.
The possible water-mediated proton transfer during the structural transformation from INT2b to INT3b via transition state TS3b examined in this study.
Figure 6.
Optimized geometries of INT2b, TS3b, and INT3b. The geometries were optimized at QM/MM(B3LYP/6-31G*:AMBER) level. The color scheme is the same as that of Figure 2.
In addition, we also examined the possibility that a water molecule mediates the proton transfer during the last step of the reaction (corresponding to that depicted in Scheme 3), i.e. the possible structural transformation from INT4b to EPb via transition state TS5b depicted in Scheme 8. This possible proton-transfer pathway would involve the breaking of the Nz–Hz and Ow–Hw bonds and the formation of the Ow–Hz and O2–Hw bonds. A necessary condition for this possible structural transformation to occur is the existence of an intermediate, denoted by INT4b in Scheme 8, in which a water molecule is close to both the Hz and O2 atoms (see Scheme 8) within the hydrogen-bond distances. However, we were unable to obtain such an INT4b structure after many trials (using various possible initial geometries in the QM/MM geometry optimization of the possible INT4b structure) and, thus, we finally concluded that one cannot have a water molecule being close to both the Hz and O2 atoms suitable for the water-assisted proton-transfer reaction depicted in Scheme 8.
It should be noted that, so far, we have discussed the possible alternative (water-assisted proton transfer) pathways for the first, third, and fifth steps of the reaction. This is because the second and fourth reaction steps do not involve a proton transfer and there is no water-assisted proton transfer for these two steps.
Other possible transition states associated with the water-assisted proton transfer
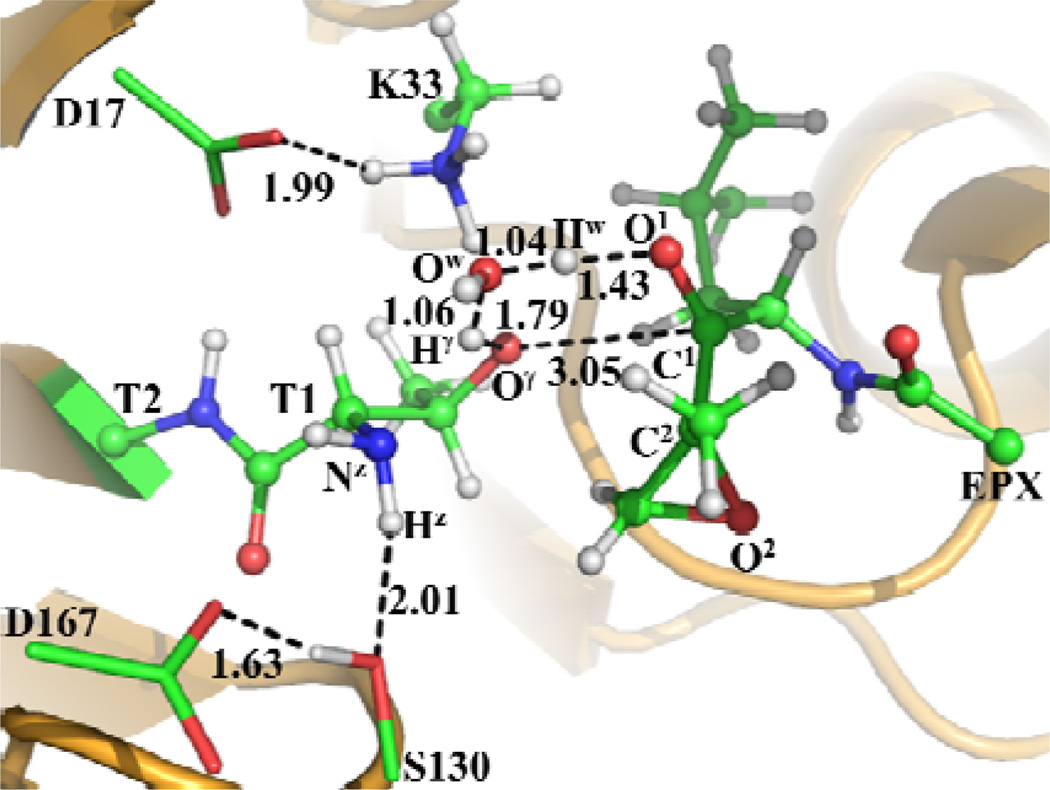
As discussed above, we found a proton-transfer transition state (TS6a depicted in Scheme 5) for the direct transformation from ERa to INT3a. Further accounting for the possible water-assisted proton transfer, the QM/MM reaction-coordinate calculations led to the identification of the corresponding transition state (TS6b depicted in Figure 7) for the water-assisted proton-transfer pathway during the direct transformation from ERb to INT3b. The transition state TS6b involves the breaking of the Hγ–Oγ and Hw–Ow bonds and the formation of the Hγ–Ow, Hw–O1, and Oγ–C1 bonds. Hence, RHγ-Oγ–RHγ-OwRHw-Ow–RHw-O1–RC1-Oγ was used as the reaction coordinate for the QM/MM reaction-coordinate calculations on the transformation from ERb to INT3b. As shown in Figure 7, the Hγ–Oγ, Hγ–Ow, Hw–Ow, Hw–O1, and Oγ–C1 distances in the optimized TS6b geometry are 1.79, 1.06, 1.04, 1.43, and 3.05 Å, respectively.
Figure 7.
Optimized geometry of transition state TS6b for the direct transformation from ERb to INT3b The geometry was optimized at QM/MM(B3LYP/6-31G*:AMBER) level. The color scheme is the same as that of Figure 2.
Free energy profiles
As described above, the QM/MM reaction-coordinate calculations at the B3LYP/6-31G*:AMBER level have revealed that there are five reaction steps in the fundamental reaction pathway of proteasome with EPX. Further, to determine the free energy profile of the reaction pathway, we performed QM/MM single-point energy calculations at the B3LYP/6-31++G**:AMBER level for each QM/MM optimized geometry along the minimum-energy path. For each geometry along the reaction path, the ESP charges determined in the QM part of the QM/MM single-point energy calculation were used in the subsequent FEP simulations to estimate the free energy changes. Depicted in Figures 8 and 9 are the free energy profiles for the main reaction pathways, associated with the direct and water-mediated proton-transfer processes, that are determined by the QM/MM-FE calculations first without the zero-point and thermal corrections for the QM subsystem, and then with the zero-point and thermal corrections for the QM subsystem (values given in parentheses). The curves of the calculated free energy profiles for the other two possible pathways via transition state TS6a or TS6b are provided as Supporting Information (Figures S1 and S2).
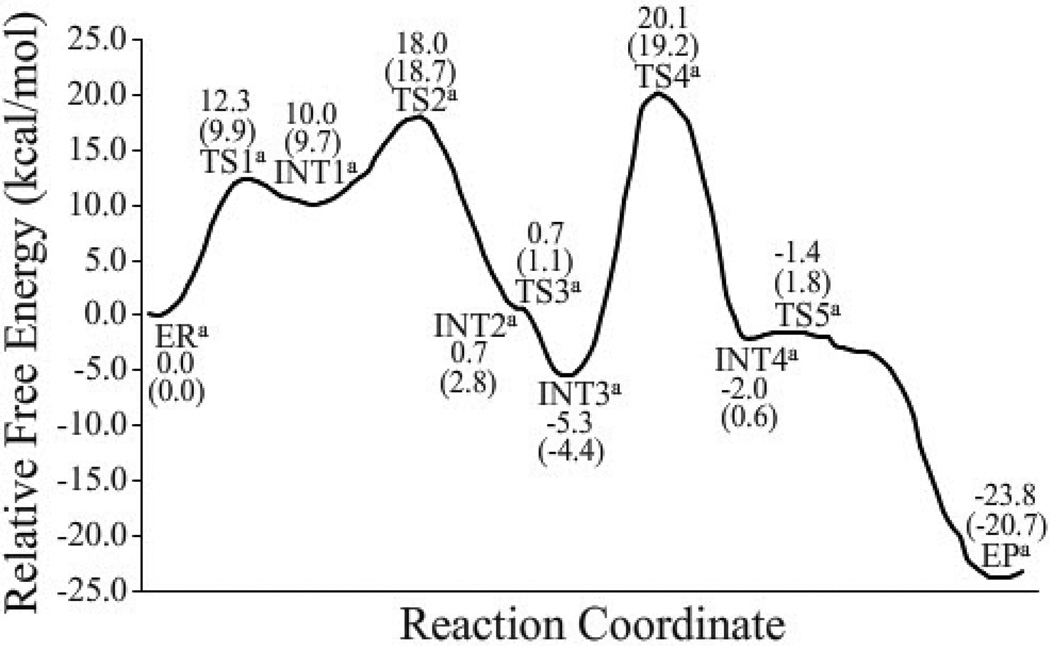
Figure 8.
Free energy profile determined by the QM/MM-FE calculations for the most favorable inhibition reaction pathway associated with the direct proton transfer. There were 113 points (structures) along the reaction coordinate used in the FEP calculations. The relative free energies were determined first without zero-point and thermal corrections, and then corrected with the zero-point and thermal corrections for the QM subsystem (values in parentheses). The QM/MM-FE calculations were performed at the B3LYP/6-31++G**:AMBER level for each QM/MM optimized geometry along the reaction path.
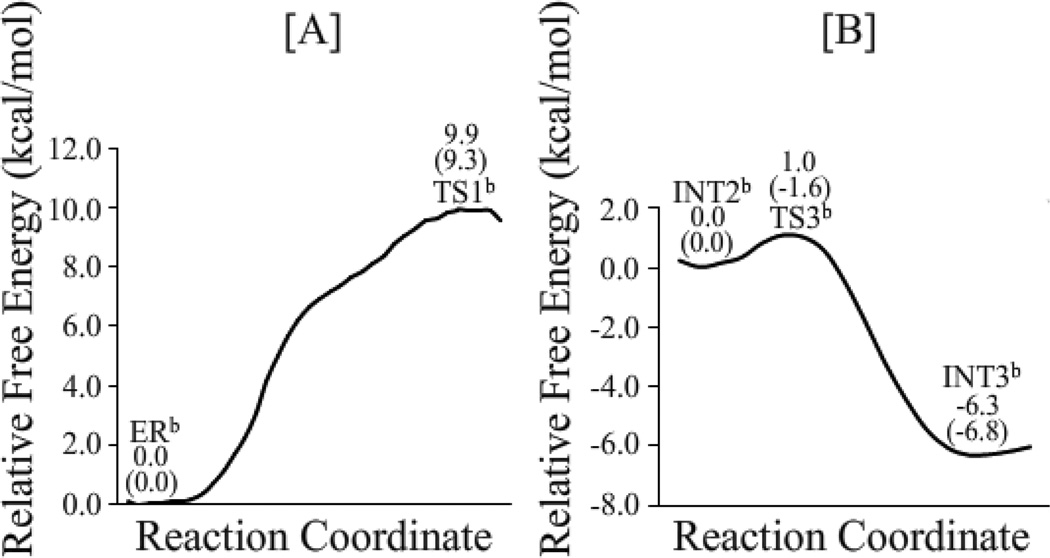
Figure 9.
Free energy profile determined by the QM/MM-FE calculations for the (A) first and (B) third steps of the reaction pathway associated with the water-assisted proton transfer. There were 36 structures in (A) and 18 structures in (B) along the reaction coordinate used in the FEP calculations. The relative free energies were determined first without the zero-point and thermal corrections, and then corrected with the zero-point and thermal corrections for the QM subsystem (values in parentheses). The QM/MM-FE calculations were performed at the B3LYP/6-31++G**:AMBER level for each QM/MM optimized geometry along the reaction path.
As shown in Figure 8, without the zero-point and thermal corrections for the QM subsystem, the free energy barriers calculated for the first to fifth reaction steps for the fundamental reaction pathway associated with the direct proton transfer are 12.3, 8.0, 0.0, 25.4, and 0.6 kcal/mol, respectively. It should be noted that the third reaction step is barrierless according to the finally obtained free energy profile based on the FEP corrections, although the QM/MM energy of TS3a is ~0.8 kcal/mol higher than that of INT2a on the QM/MM potential energy surface (without the zero-point and thermal corrections). With the zero-point and thermal corrections for the QM subsystem, the free energy barriers calculated for the first, second, fourth, and fifth reaction steps for the fundamental reaction pathway associated with the direct proton transfer become 9.9, 9.0, 23.6, and 1.2 kcal/mol, respectively. Notably, the free energy change from INT2a to TS3a is a negative value (−1.7 kcal/mol) after the zero-point and thermal corrections are accounted for. The free energy profile suggests that the zwitterionic intermediate INT2a is very unstable and does not really exist. Another zwitterionic intermediate INT4a is also very unstable, as the free energy barrier calculated for the fifth step (associated with TS5a) is as low as 1.2 kcal/mol. The overall free energy profile shown in Figure 8 indicates that the rate-determining step should be the fourth step (associated with transition state TS4a) for the fundamental reaction pathway associated with the direct proton transfer, and water cannot assist the rate-determining step. It is remarkably to note that the free energy barrier of 9.9 kcal/mol calculated for the first step (associated with TS1a) of the direct proton-transfer pathway is much lower than that for the rate-determining step (the fourth step associated with TS4a). So, the Thr1-NzH2 group can readily activate Thr1-Oγ directly. Further, according to the free energy profile depicted in Figure 8, the reaction product EPa has a free energy lower than TS4a by 39.9 kcal/mol, indicating that the reverse reaction process (from EPa to INT4a) should be extremely slow (with a free energy barrier of 39.9 kcal/mol) and, thus, the SN2 nucleophilic attack of Thr1-Nz on the epoxide should be irreversible at the room temperature, which is qualitatively consistent with the experimental observation.12
Depicted in Figure 9 are the free energy profiles calculated for the first and third steps of the reaction pathway associated with the water-assisted proton transfer. The difference between the direct proton-transfer and water-assisted proton-transfer pathways exists only in the first and third steps. As seen in Figure 9, without the zero-point and thermal corrections, the free energy barriers calculated for the first and third steps of the water-assisted proton-transfer pathway are 9.9 and 1.0 kcal/mol, respectively. With the zero-point and thermal corrections, the free energy barrier calculated for the first reaction step (associated with TS1b) becomes 9.3 kcal/mol, about 0.6 kcal/mol lower than that (9.9 kcal/mol) calculated for the first reaction step (associated with TS1a) of the direct proton-transfer reaction pathway. On the other hand, the aforementioned MD simulations have demonstrated that ~94.6% snapshots may be considered as ERa and ~5.4% snapshots may be considered as ERb, suggesting that the Gibbs free energy of ERb is about ~1.7 kcal/mol higher than that of ERa, i.e. ΔΔG = ΔG(ERb) – ΔG(ERa) = ~1.7 kcal/mol, according to the well-known Boltzmann distribution. Accounting for the free energy difference between ERa and ERb, the actual free energy barrier associated with TS1b should be ~(1.7 + 9.3) = ~11.0 kcal/mol, which is ~1.1 kcal/mol higher than that associated with TS1a. Overall, the reaction pathway of the direct proton transfer is more favorable compared to that of the water-assisted proton transfer. It should be pointed out that the calculated free-energy barrier difference of 1.1 kcal/mol is insignificant in consideration of the possible computational error. Thus, we cannot completely exclude the possibility of the contribution from the water-assisted proton transfer based on these computational data. Nevertheless, the computational data clearly reveal that the direct proton transfer pathway is at least as important as the water-assisted proton transfer pathway.
Concerning the third step of the reaction, with the zero-point and thermal corrections for the QM subsystem, the calculated free energy change from INT2b to TS3b is a negative value (−1.6 kcal/mol) and, therefore, the third reaction step (associated with TS3b) is actually barrierless after the zero-point and thermal corrections are accounted for. The free energy profile suggests that the zwitterionic intermediate INT2b is very unstable and cannot really exist, similar to the aforementioned situation of the direct proton-transfer pathway.
In addition, the free energy barriers calculated for the other alternative reaction pathways associated with TS6a and TS6b are 44.4 and 29.8 kcal/mol, respectively, as depicted in Figures S1 and S2 of the Supporting Information. These free energy barriers are all significantly higher than that for the reaction pathway associated with the direct proton transfer. All of the energetic results suggest that the most favorable reaction pathway should be associated with the direct proton transfer as depicted in Scheme 3.
Based on the free energy profile depicted in Figure 8 for the most favorable reaction pathway, the free energy barrier for the entire reaction process is determined by that (23.6 kcal/mol) for the fourth reaction step (the rate-determining step) associated with transition state TS4a. We wanted to know whether the calculated free energy barrier of 23.6 kcal/mol is reasonably consistent with the available experimental reaction rate constant (kobs) or not. According to the reported experimental data,54 kobs/[I] = 44,510 ± 7,000 M−1s−1 when [I] = 25 – 75 nM) in which [I] represents the concentration of inhibitor EPX (For the details, see U.S. Patent 7642369). Thus, kobs = 0.9 – 3.9×10⁻³ s−1, which is associated with an activation free energy of ~21 – 22 kcal/mol at room temperature (25°C) according to the conventional transition state theory.90 Our calculated free energy barrier of 23.6 kcal/mol is reasonably close to the experimentally derived activation free energy of ~21 – 22 kcal/mol, suggesting that the computational results are reasonable.
In recent years, more and more reports have indicated that the B3LYP functional might be unable to accurately describe the medium-range correlation, nonbonding, and long-range interactions and, therefore, some newer functionals have been developed.67, 68 In order to examine the reliability of B3LYP results discussed above, we also carried out additional single-point QM/MM calculations in which the B3LYP was replaced by the MP2, B3P86, B3PW91, or M05-2X with the same basis set (6-31++G**). The calculated free energy barriers are provided as the Supporting Information (Table S1) showing that the QM/MM energy calculations using different QM methods/functionals led to the similar results. All of the energetic data consistently suggest that the most favorable reaction pathway should be the direct proton transfer depicted in Scheme 3 and that the fourth reaction step associated with transition state TS4a is rate-determining.
Conclusion
The first-principles QM/MM-FE calculations carried out in this study have demonstrated the detailed mechanism for the inhibition reaction of proteasome with peptide EPX. Based on the results from the QM/MM calculations, the most favorable reaction pathway is associated with the direct proton transfer, rather than the water-assisted proton transfer, and consists of five reaction steps. The reaction is initiated by a direct proton (Hγ) transfer from the Thr1-Oγ atom to the Thr1-Nz atom to activate the Thr1-Oγ. Subsequently, the negatively charged Thr1-Oγ atom initiates the nucleophilic attack on the carbonyl carbon of EPX. Then, the proton (Hγ) transfers from the Thr1-Nz atom to the carbonyl oxygen of EPX. The fourth step is also a concerted process, i.e. the nucleophilic attack on the EPX-C2 atom by the Thr1-Nz, which is coupled with the breaking of the C2–O2 bond in EPX (SN2 nucleophilic substitution). The final step is a proton (Hz) transfer from the Thr1-Nz to the negatively charged O2 atom of EPX.
The calculated free energy profile of the most favorable reaction pathway associated with the direct proton transfer indicates that the free energy barriers for the first, second, fourth, and fifth reaction steps are 9.9, 9.0, 23.6, and 1.2 kcal/mol, respectively. The third step of the reaction associated with the direct proton transfer is barrierless. The fourth step associated with transition state TS4a has the highest free energy barrier and should be the rate-determining step of the inhibition reaction process, and water cannot assist the rate-determining step. The calculated free energy barrier of 23.6 kcal/mol for the rate-determining step is reasonably close to the experimentally derived activation free energy of ~21 – 22 kcal/mol, suggesting that the calculated results are reasonable.
In addition, the novel, general mechanistic insights obtained in this study should also be valuable for studying/examining possible reaction pathways for other enzyme reactions involving such mechanistic questions as the water-assisted proton transfer versus direct proton transfer and the concerted reaction process versus stepwise reaction process etc.
Supplementary Material
Acknowledgments
This work was supported in part by the NIH (grants R01 DA032910, R01 DA013930 and R01 DA025100 to Zhan) and the NSF (grant CHE-1111761 to Zhan). Wei worked in Zhan’s laboratory for this project at University of Kentucky as an exchange graduate student (from Zhengzhou University) supported by the China Scholarship Council. The authors also acknowledge the Computer Center at University of Kentucky for supercomputing time on a Dell X-series Cluster with 384 nodes or 4,768 processors.
Footnotes
Supporting Information Available. Molecular structures of selected inhibitors bound to Thr1 residue in the active sites of proteasome; the free energy profiles determined by the QM/MM-FE calculations for the pathways via transition state TS6a or TS6b; the free energy barriers and absolute QM/MM energies calculated at the QM/MM (Method/6-31++G**:AMBER; Method = B3LYP, MP2, M052X, B3PW91, or B3P86) level; coordinates of QM part of the geometries optimized at the QM/MM(B3LYP/6-31G*:AMBER) level. This information is available free of charge via the Internet at http://pubs.acs.org/.
References
- 1.Borissenko L, Groll M. Chem. Rev. 2007;107(3):687–717. doi: 10.1021/cr0502504. [DOI] [PubMed] [Google Scholar]
- 2.Goldberg AL. Nature. 2003;426(6968):895–899. doi: 10.1038/nature02263. [DOI] [PubMed] [Google Scholar]
- 3.Richardson PG, Sonneveld P, Schuster MW, Irwin D, Stadtmauer EA, Facon T, Harousseau JL, Ben-Yehuda D, Lonial S, Goldschmidt H, Reece D, San-Miguel JF, Blade J, Boccadoro M, Cavenagh J, Dalton WS, Boral AL, Esseltine DL, Porter JB, Schenkein D, Anderson KC, Investigators A. New Engl. J. Med. 2005;352(24):2487–2498. doi: 10.1056/NEJMoa043445. [DOI] [PubMed] [Google Scholar]
- 4.Genin E, Reboud-Ravaux M, Vidal J. Curr. Top. Med. Chem. 2010;10(3):232–256. doi: 10.2174/156802610790725515. [DOI] [PubMed] [Google Scholar]
- 5.Sprangers R, Li X, Mao X, Rubinstein JL, Schimmer AD, Kay LE. Biochemistry. 2008;47(26):6727–6734. doi: 10.1021/bi8005913. [DOI] [PubMed] [Google Scholar]
- 6.Adams J. Nat. Rev. Canc. 2004;4(5):349–360. doi: 10.1038/nrc1361. [DOI] [PubMed] [Google Scholar]
- 7.Goldberg AL, Rock K. Nat. Med. 2002;8(4):338–340. doi: 10.1038/nm0402-338. [DOI] [PubMed] [Google Scholar]
- 8.Richardson PG, Mitsiades C, Hideshima T, Anderson KC. Annu. Rev. Med. 2006;57:33–47. doi: 10.1146/annurev.med.57.042905.122625. [DOI] [PubMed] [Google Scholar]
- 9.Buckley DL, Corson TW, Aberle N, Crews CM. J. Am. Chem. Soc. 2011;133(4):698–700. doi: 10.1021/ja109377p. [DOI] [PubMed] [Google Scholar]
- 10.Unno M, Mizushima T, Morimoto Y, Tomisugi Y, Tanaka K, Yasuoka N, Tsukihara T. Structure. 2002;10(5):609–618. doi: 10.1016/s0969-2126(02)00748-7. [DOI] [PubMed] [Google Scholar]
- 11.Groll M, Ditzel L, Lowe J, Stock D, Bochtler M, Bartunik HD, Huber R. Nature. 1997;386(6624):463–471. doi: 10.1038/386463a0. [DOI] [PubMed] [Google Scholar]
- 12.Groll M, Kim KB, Kairies N, Huber R, Crews CM. J. Am. Chem. Soc. 2000;122(6):1237–1238. [Google Scholar]
- 13.Groll M, Berkers CR, Ploegh HL, Ovaa H. Structure. 2006;14(3):451–456. doi: 10.1016/j.str.2005.11.019. [DOI] [PubMed] [Google Scholar]
- 14.Lowe J, Stock D, Jap B, Zwickl P, Baumeister W, Huber R. Science. 1995;268(5210):533–539. doi: 10.1126/science.7725097. [DOI] [PubMed] [Google Scholar]
- 15.Hines J, Groll M, Fahnestock M, Crews CM. Chem. Biol. 2008;15(5):501–512. doi: 10.1016/j.chembiol.2008.03.020. [DOI] [PMC free article] [PubMed] [Google Scholar]
- 16.Groll M, Balskus EP, Jacobsen EN. J. Am. Chem. Soc. 2008;130(45):14981–14983. doi: 10.1021/ja806059t. [DOI] [PMC free article] [PubMed] [Google Scholar]
- 17.Groll M, Huber R, Potts BC. J. Am. Chem. Soc. 2006;128(15):5136–5141. doi: 10.1021/ja058320b. [DOI] [PubMed] [Google Scholar]
- 18.Groll M, Nazif T, Huber R, Bogyo M. Chem. Biol. 2002;9(5):655–662. doi: 10.1016/s1074-5521(02)00144-8. [DOI] [PubMed] [Google Scholar]
- 19.Groll M, Schellenberg B, Bachmann AS, Archer CR, Huber R, Powell TK, Lindow S, Kaiser M, Dudler R. Nature. 2008;452(7188):755–758. doi: 10.1038/nature06782. [DOI] [PubMed] [Google Scholar]
- 20.Groll M, Koguchi Y, Huber R, Kohno J. J. Mol. Biol. 2001;311(3):543–548. doi: 10.1006/jmbi.2001.4869. [DOI] [PubMed] [Google Scholar]
- 21.Peters JM. Trends Biochem. Sci. 1994;19(9):377–382. doi: 10.1016/0968-0004(94)90115-5. [DOI] [PubMed] [Google Scholar]
- 22.Vinitsky A, Michaud C, Powers JC, Orlowski M. Biochemistry. 1992;31(39):9421–9428. doi: 10.1021/bi00154a014. [DOI] [PubMed] [Google Scholar]
- 23.Vivier M, Rapp M, Papon J, Labarre P, Galmier MJ, Sauziere J, Madelmont JC. J. Med. Chem. 2008;51(4):1043–1047. doi: 10.1021/jm701419g. [DOI] [PubMed] [Google Scholar]
- 24.Marastoni M, McDonald J, Baldisserotto A, Canella A, De Risi C, Pollini GP, Tomatis R. Bioorg. Med. Chem. Lett. 2004;14(8):1965–1968. doi: 10.1016/j.bmcl.2004.01.081. [DOI] [PubMed] [Google Scholar]
- 25.Marastoni M, Baldisserotto A, Canella A, Gavioli R, De Risi C, Pollini GP, Tomatis R. J. Med. Chem. 2004;47(6):1587–1590. doi: 10.1021/jm0309102. [DOI] [PubMed] [Google Scholar]
- 26.Aubin S, Martin B, Delcros JG, Arlot-Bonnemains Y, Baudy-Floc'h M. J. Med. Chem. 2005;48(1):330–334. doi: 10.1021/jm049455f. [DOI] [PubMed] [Google Scholar]
- 27.Gaczynska M, Osmulski PA, Gao Y, Post MJ, Simons M. Biochemistry. 2003;42(29):8663–8670. doi: 10.1021/bi034784f. [DOI] [PubMed] [Google Scholar]
- 28.Zhu YQ, Zhao X, Zhu XR, Wu G, Li YJ, Ma YH, Yuan YX, Yang J, Hu Y, Ai L, Gao QZ. J. Med. Chem. 2009;52(14):4192–4199. doi: 10.1021/jm9005093. [DOI] [PubMed] [Google Scholar]
- 29.Berkers CR, Verdoes M, Lichtman E, Fiebiger E, Kessler BM, Anderson KC, Ploegh HL, Ovaa H, Galardy PJ. Nat. Meth. 2005;2(5):357–362. doi: 10.1038/nmeth759. [DOI] [PubMed] [Google Scholar]
- 30.Zhu YQ, Wu G, Zhu XR, Ma YH, Zhao X, Li YJ, Yuan YX, Yang J, Yu S, Shao F, Lei M. J. Med. Chem. 2010;53(24):8619–8626. doi: 10.1021/jm1009742. [DOI] [PubMed] [Google Scholar]
- 31.Milo LJ, Lai JH, Wu WG, Liu YX, Maw H, Li YH, Jin ZP, Shu Y, Poplawski SE, Wu Y, Sanford DG, Sudmeier JL, Bachovchin WW. J. Med. Chem. 2011;54(13):4365–4377. doi: 10.1021/jm200460q. [DOI] [PubMed] [Google Scholar]
- 32.Fenteany G, Standaert RF, Lane WS, Choi S, Corey EJ, Schreiber SL. Science. 1995;268(5211):726–731. doi: 10.1126/science.7732382. [DOI] [PubMed] [Google Scholar]
- 33.Nett M, Gulder TA, Kale AJ, Hughes CC, Moore BS. J. Med. Chem. 2009;52(19):6163–6167. doi: 10.1021/jm901098m. [DOI] [PMC free article] [PubMed] [Google Scholar]
- 34.Meng LH, Mohan R, Kwok BHB, Elofsson M, Sin N, Crews CM. Proc. Natl. Acad. Sci. USA. 1999;96(18):10403–10408. doi: 10.1073/pnas.96.18.10403. [DOI] [PMC free article] [PubMed] [Google Scholar]
- 35.Meng L, Kwok BH, Sin N, Crews CM. Canc. Res. 1999;59(12):2798–2801. [PubMed] [Google Scholar]
- 36.Demo SD, Kirk CJ, Aujay MA, Buchholz TJ, Dajee M, Ho MN, Jiang J, Laidig GJ, Lewis ER, Parlati F, Shenk KD, Smyth MS, Sun CM, Vallone MK, Woo TM, Molineaux CJ, Bennett MK. Canc. Res. 2007;67(13):6383–6391. doi: 10.1158/0008-5472.CAN-06-4086. [DOI] [PubMed] [Google Scholar]
- 37.Kuhn DJ, Chen Q, Voorhees PM, Strader JS, Shenk KD, Sun CM, Demo SD, Bennett MK, van Leeuwen FW, Chanan-Khan AA, Orlowski RZ. Blood. 2007;110(9):3281–3290. doi: 10.1182/blood-2007-01-065888. [DOI] [PMC free article] [PubMed] [Google Scholar]
- 38.Bogyo M, McMaster JS, Gaczynska M, Tortorella D, Goldberg AL, Ploegh H. Proc. Natl. Acad. Sci. USA. 1997;94(13):6629–6634. doi: 10.1073/pnas.94.13.6629. [DOI] [PMC free article] [PubMed] [Google Scholar]
- 39.Nazif T, Bogyo M. Proc. Natl. Acad. Sci. USA. 2001;98(6):2967–2972. doi: 10.1073/pnas.061028898. [DOI] [PMC free article] [PubMed] [Google Scholar]
- 40.Rydzewski RM, Burrill L, Mendonca R, Palmer JT, Rice M, Tahilramani R, Bass KE, Leung L, Gjerstad E, Janc JW, Pan L. J. Med. Chem. 2006;49(10):2953–2968. doi: 10.1021/jm058289o. [DOI] [PubMed] [Google Scholar]
- 41.Baldisserotto A, Ferretti V, Destro F, Franceschini C, Marastoni M, Gavioli R, Tomatis R. J. Med. Chem. 2010;53(17):6511–6515. doi: 10.1021/jm100122e. [DOI] [PubMed] [Google Scholar]
- 42.Vivier M, Jarrousse AS, Bouchon B, Galmier MJ, Auzeloux P, Sauzieres J, Madelmont JC. J. Med. Chem. 2005;48(21):6731–6740. doi: 10.1021/jm050181l. [DOI] [PubMed] [Google Scholar]
- 43.Basse N, Montes M, Marechal X, Qin L, Bouvier-Durand M, Genin E, Vidal J, Villoutreix BO, Reboud-Ravaux M. J. Med. Chem. 2010;53(1):509–513. doi: 10.1021/jm9011092. [DOI] [PubMed] [Google Scholar]
- 44.Furet P, Imbach P, Noorani M, Koeppler J, Laumen K, Lang M, Guagnano V, Fuerst P, Roesel J, Zimmermann J, Garcia-Echeverria C. J. Med. Chem. 2004;47(20):4810–4813. doi: 10.1021/jm049660v. [DOI] [PubMed] [Google Scholar]
- 45.Adsule S, Barve V, Chen D, Ahmed F, Dou QP, Padhye S, Sarkar FH. J. Med. Chem. 2006;49(24):7242–7246. doi: 10.1021/jm060712l. [DOI] [PubMed] [Google Scholar]
- 46.Marques AJ, Palanimurugan R, Matias AC, Ramos PC, Dohmen RJ. Chem. Rev. 2009;109(4):1509–1536. doi: 10.1021/cr8004857. [DOI] [PubMed] [Google Scholar]
- 47.Voorhees PM, Orlowski RZ. Annu. Rev. Pharmacol. Toxicol. 2006;46:189–213. doi: 10.1146/annurev.pharmtox.46.120604.141300. [DOI] [PubMed] [Google Scholar]
- 48.Orlowski RZ, Kuhn DJ. Clin. Canc. Res. 2008;14(6):1649–1657. doi: 10.1158/1078-0432.CCR-07-2218. [DOI] [PubMed] [Google Scholar]
- 49.Kisselev AF. Chem. Biol. 2008;15(5):419–421. doi: 10.1016/j.chembiol.2008.04.010. [DOI] [PubMed] [Google Scholar]
- 50.Groll M, McArthur KA, Macherla VR, Manam RR, Potts BC. J. Med. Chem. 2009;52(17):5420–5428. doi: 10.1021/jm900559x. [DOI] [PubMed] [Google Scholar]
- 51.Sin N, Kim KB, Elofsson M, Meng LH, Auth H, Kwok BHB, Crews CM. Bioorg. Med. Chem. Lett. 1999;9(15):2283–2288. doi: 10.1016/s0960-894x(99)00376-5. [DOI] [PubMed] [Google Scholar]
- 52.Duggleby HJ, Tolley SP, Hill CP, Dodson EJ, Dodson G, Moody PC. Nature. 1995;373(6511):264–268. doi: 10.1038/373264a0. [DOI] [PubMed] [Google Scholar]
- 53.Myung J, Kim KB, Crews CM. Med. Res. Rev. 2001;21(4):245–273. doi: 10.1002/med.1009. [DOI] [PMC free article] [PubMed] [Google Scholar]
- 54.Lei B, Abdul Hameed MD, Hamza A, Wehenkel M, Muzyka JL, Yao XJ, Kim KB, Zhan CG. J. Phys. Chem. B. 2010;114(38):12333–12339. doi: 10.1021/jp1058098. [DOI] [PMC free article] [PubMed] [Google Scholar]
- 55.Zhang YK, Liu HY, Yang WT. J. Chem. Phys. 2000;112(8):3483–3492. [Google Scholar]
- 56.Zhang YK. J. Chem. Phys. 2005;122(2) doi: 10.1063/1.1834899. 024114. [DOI] [PubMed] [Google Scholar]
- 57.Zhang YK. Theor. Chem. Acc. 2006;116(1–3):43–50. [Google Scholar]
- 58.Frisch MJ, Trucks GW, Schlegel HB, Scuseria GE, Robb MA, Cheeseman JR, Montgomery JJA, Vreven T, udin KN, Burant JC, Millam JM, yengar SS, Tomasi J, Barone V, Mennucci B, Cossi M, Scalmani G, Rega N, Petersson GA, Nakatsuji H, Hada M, Ehara M, Toyota K, Fukuda R, Hasegawa J, shida M, Nakajima T, Honda Y, Kitao O, Nakai H, Klene M, Li X, Knox JE, Hratchian HP, Cross JB, Bakken V, Adamo C, Jaramillo J, Gomperts R, Stratmann RE, Yazyev O, Austin AJ, Cammi R, Pomelli C, Ochterski JW, Ayala PY, Morokuma K, Voth GA, Salvador P, Dannenberg JJ, Zakrzewski VG, Dapprich S, Daniels AD, Strain MC, Farkas O, Malick DK, Rabuck AD, Raghavachari K, Foresman JB, Ortiz JV, Cui Q, Baboul AG, Clifford S, Cioslowski J, Stefanov BB, Liu G, Liashenko A, Piskorz P, Komaromi I, Martin RL, Fox DJ, Keith T, Al-Laham MA, Peng CY, Nanayakkara A, Challacombe M, Gill PMW, Johnson B, Chen W, Wong MW, Gonzalez C, Pople JA. Gaussian 03, Version C.02. Wallingford, CT: Gaussian, Inc.; 2004. [Google Scholar]
- 59.Case DA, Darden TA, Cheatham TE, Simmerling CL, Wang J, Duke RE, Luo R, Merz KM, Wang B, Pearlman DA, Crowley M, Brozell S, Tsui V, Gohlke H, Mongan J, Hornak V, Cui G, Beroza P, Schafmeister C, Caldwell JW, Ross WS, Kollman PA. AMBER11. San Francisco: University of California; 2010. [Google Scholar]
- 60.Jorgensen WL, Chandrasekhar J, Madura JD, Impey RW, Klein ML. J. Chem. Phys. 1983;79(2):926–935. [Google Scholar]
- 61.Zheng F, Yang WC, Ko MC, Liu JJ, Cho H, Gao DQ, Tong M, Tai HH, Woods JH, Zhan CG. J. Am. Chem. Soc. 2008;130(36):12148–12155. doi: 10.1021/ja803646t. [DOI] [PMC free article] [PubMed] [Google Scholar]
- 62.Case DA, Darden TA, Cheatham TE, Simmerling CL, Wang J, Duke RE, Luo R, Merz KM, Wang B, Pearlman DA, Crowley M, Brozell S, Tsui V, Gohlke H, Mongan J, Hornak V, Cui G, Beroza P, Schafmeister C, Caldwell JW, Ross WS, Kollman PA. AMBER8. San Francisco: University of California; 2004. [Google Scholar]
- 63.Headgordon M, Pople JA, Frisch MJ. Chem. Phys. Lett. 1988;153(6):503–506. [Google Scholar]
- 64.Frisch MJ, Headgordon M, Pople JA. Chem. Phys. Lett. 1990;166(3):281–289. [Google Scholar]
- 65.Perdew JP. Phys. Rev. B. 1986;33(12):8822–8824. doi: 10.1103/physrevb.33.8822. [DOI] [PubMed] [Google Scholar]
- 66.Perdew JP, Wang Y. Phys. Rev. B. 1992;45(23):13244–13249. doi: 10.1103/physrevb.45.13244. [DOI] [PubMed] [Google Scholar]
- 67.Zhao Y, Schultz NE, Truhlar DG. J. Chem. Theory Comput. 2006;2(2):364–382. doi: 10.1021/ct0502763. [DOI] [PubMed] [Google Scholar]
- 68.Zhao Y, Truhlar DG. Acc. Chem. Res. 2008;41(2):157–167. doi: 10.1021/ar700111a. [DOI] [PubMed] [Google Scholar]
- 69.Kollman P. Chem. Rev. 1993;93(7):2395–2417. [Google Scholar]
- 70.Beveridge DL, DiCapua FM. Annu. Rev. Biophys. Biophys. Chem. 1989;18:431–492. doi: 10.1146/annurev.bb.18.060189.002243. [DOI] [PubMed] [Google Scholar]
- 71.(a) Chandrasekhar J, Smitt SF, Jorgensen WL. J. Am. Chem. Soc. 1984;106:3049–3050. [Google Scholar]; (b) Acevedo O, Jorgensen WL. Acc. Chem. Res. 2010;43(1):142–151. doi: 10.1021/ar900171c. [DOI] [PMC free article] [PubMed] [Google Scholar]
- 72.Acevedo O, Jorgensen WL. J. Am. Chem. Soc. 2006;128(18):6141–6146. doi: 10.1021/ja057523x. [DOI] [PubMed] [Google Scholar]
- 73.Acevedo O, Jorgensen WL. J. Am. Chem. Soc. 2005;127(24):8829–8834. doi: 10.1021/ja051793y. [DOI] [PubMed] [Google Scholar]
- 74.Jarmula A, Cieplak P, Les A, Rode W. J. Comput. Aided Mol. Des. 2003;17(10):699–710. doi: 10.1023/b:jcam.0000017377.07094.2e. [DOI] [PubMed] [Google Scholar]
- 75.Udier-Blagovic M, Tirado-Rives J, Jorgensen WL. J. Med. Chem. 2004;47(9):2389–2392. doi: 10.1021/jm0303507. [DOI] [PubMed] [Google Scholar]
- 76.Zhang W, Hou TJ, Qiao XB, Huai S, Xu XJ. J. Mol. Mod. 2004;10(2):112–120. doi: 10.1007/s00894-004-0181-1. [DOI] [PubMed] [Google Scholar]
- 77.Alexandrova AN, Rothlisberger D, Baker D, Jorgensen WL. J. Am. Chem. Soc. 2008;130(47):15907–15915. doi: 10.1021/ja804040s. [DOI] [PMC free article] [PubMed] [Google Scholar]
- 78.Guimaraes CR, Boger DL, Jorgensen WL. J. Am. Chem. Soc. 2005;127(49):17377–17384. doi: 10.1021/ja055438j. [DOI] [PubMed] [Google Scholar]
- 79.Guimaraes CR, Udier-Blagovic M, Jorgensen WL. J. Am. Chem. Soc. 2005;127(10):3577–3588. doi: 10.1021/ja043905b. [DOI] [PubMed] [Google Scholar]
- 80.Danciulescu C, Nick B, Wortmann FJ. Biomacromolecules. 2004;5(6):2165–2175. doi: 10.1021/bm049788u. [DOI] [PubMed] [Google Scholar]
- 81.Funahashi J, Sugita Y, Kitao A, Yutani K. Protein Eng. 2003;16(9):665–671. doi: 10.1093/protein/gzg083. [DOI] [PubMed] [Google Scholar]
- 82.Liu JJ, Hamza A, Zhan CG. J. Am. Chem. Soc. 2009;131(33):11964–11975. doi: 10.1021/ja903990p. [DOI] [PMC free article] [PubMed] [Google Scholar]
- 83.Liu JJ, Zhang YK, Zhan CG. J. Phys. Chem. B. 2009;113(50):16226–16236. doi: 10.1021/jp9055335. [DOI] [PMC free article] [PubMed] [Google Scholar]
- 84.Chen X, Fang L, Liu J, Zhan CG. J. Phys. Chem. B. 2011;115(5):1315–1322. doi: 10.1021/jp110709a. [DOI] [PMC free article] [PubMed] [Google Scholar]
- 85.Liu JJ, Zhao XY, Yang WC, Zhan CG. J. Phys. Chem. B. 2011;115(17):5017–5025. doi: 10.1021/jp200975v. [DOI] [PMC free article] [PubMed] [Google Scholar]
- 86.Li D, Huang X, Han K, Zhan CG. J. Am. Chem. Soc. 2011;133(19):7416–7427. doi: 10.1021/ja111657j. [DOI] [PMC free article] [PubMed] [Google Scholar]
- 87.Chen X, Zhao X, Xiong Y, Liu J, Zhan CG. J. Phys. Chem. B. 2011;115(42):12208–12219. doi: 10.1021/jp205509w. [DOI] [PMC free article] [PubMed] [Google Scholar]
- 88.Chen X, Fang L, Liu J, Zhan CG. Biochemistry. 2012;51(6):1297–1305. doi: 10.1021/bi201786s. [DOI] [PMC free article] [PubMed] [Google Scholar]
- 89.Liu J, Zhan CG. J. Chem. Theory Comput. 2012;8(4):1426–1435. doi: 10.1021/ct200810d. [DOI] [PMC free article] [PubMed] [Google Scholar]
- 90.Alvarez-Idaboy JR, Galano A, Bravo-Perez G, Ruiz ME. J. Am. Chem. Soc. 2001;123(34):8387–8395. doi: 10.1021/ja010693z. [DOI] [PubMed] [Google Scholar]
Associated Data
This section collects any data citations, data availability statements, or supplementary materials included in this article.


