Abstract
Relatively little is known regarding how energetic demand during cell proliferation is sensed or coordinated with mitochondrial metabolism. Here we demonstrate that cell cycle progression through is associated with a significant increase in mitochon-G1 drial membrane potential (ΔΨ m) and respiration. We used this with low and high change in metabolic rate to isolate cells in G1 levels of mitochondrial membrane potential (ΔΨmL and ΔΨmH). Biochemical and functional studies demonstrate that ΔΨmL and ΔΨmH cells display the distinct characteristics of early and late phase, respectively. We further demonstrate that the metabolic G1 rate in reflects levels of the mTOR-raptor complex as well as G1 susceptibility to rapamycin-induced cell cycle delay. In conclusion, our data suggests a coupling of mitochondrial bioenergetics and progression and points to the mTOR signaling pathway as a G1 potential molecular coordinator of these two processes.
Keywords: cell cycle, mitochondria, mTOR
Introduction
Cellular proliferation and the concomitant DNA replication and translational processes represent significant energetic commitments and presumably require an increase in energy supply to meet this large ATP-dependent synthetic demand. The orchestration of the cell cycle machinery and cellular metabolism, therefore, seems to be an phase indispensable prerequisite for cell division. It is during the G1 of the cell cycle that the cell must integrate external stimuli such as growth signals and intrinsic conditions such as genomic integrity. Based on these various parameters, a decision must be made whether to proceed to S phase or to undergo cell cycle arrest.
There is growing evidence that the G1/S transition during the cell cycle is also regulated by metabolic events suggesting the possible existence of a metabolic or energetic checkpoint. In Drosophila, a mutation in the gene tenured that encodes a cytochrome oxidase subunit, results in lower ATP levels and cell cycle arrest at the G1/S boundary.1 In mammalian cells, it has been shown that the availability of small nutrients such as glucose and amino acids2 as well as oxygen levels3 affect cell cycle progression. Glucose limitation and depletion of ATP can also lead to p53-dependent G1 by AMP-activated kinase.4
The concept of a metabolic checkpoint not only implies the integration of external growth stimuli and nutrient availability but also the potential synchronization of intrinsic mitochondrial metabolism with cell cycle progression. However, relatively little is known regarding any linkage between mitochondrial bioenergetics and cell cycle progression. We therefore sought to characterize mitochondrial function during the cell cycle with a particular focus on the G1 phase. Here we describe the use of fluorescence activated cell sorting (FACS) to purify populations of cells based on the simultaneous measurement of mitochondrial membrane potential and cell cycle distribution.
Results and Discussion
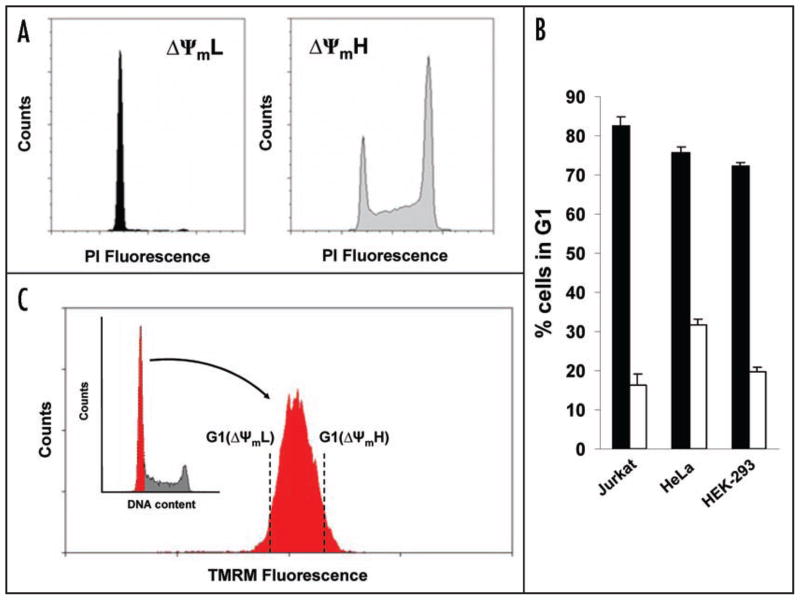
Jurkat T cells were initially loaded with the mitochondrial potential sensitive dye tetramethyl rhodamine methyl ester (TMRM). We then analyzed the cell cycle distribution of exponentially growing cells spontaneously exhibiting either low (ΔΨmL) or high (ΔΨmH) mitochondrial membrane potential. Such sorted populations respectively represented the 5% most leftward or rightward portion of the bell shaped distribution of mitochondrial membrane potential observed in exponentially dividing cultures. If membrane potential was invariant over the cell cycle, then the cell cycle distribution of the ΔΨmL or ΔΨmH cells would be predicted to mirror the usual cell cycle distribution (see inset Fig. 1C). As seen in Figure 1A that was not the case. What we routinely observed was that Jurkat cells obtained in the ΔΨmL fraction were almost exclusively in the G1 phase. In contrast, cells obtained from the ΔΨmH fraction were in all phases of the cell cycle but appeared to be particularly enriched for cells in S and G2/M (Fig. 1A). Similar results were obtained in other cell types in addition to Jurkat cells, suggesting a more general nature of the phenomenon (Fig. 1B).
Figure 1.
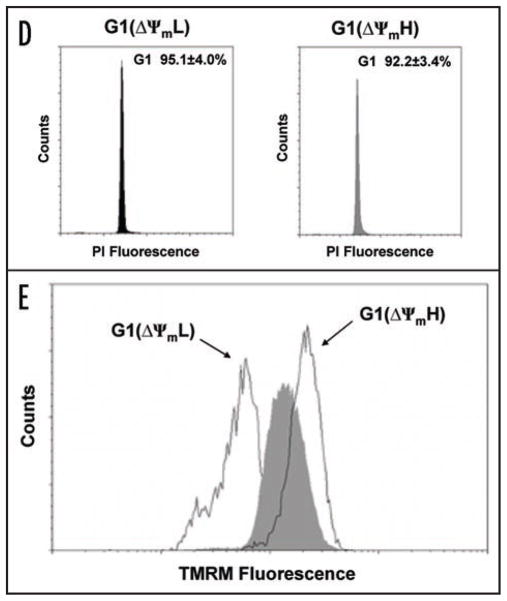
Variation of mitochondrial membrane potential during cell cycle progression. (A) Cell cycle distribution as assessed by propidium iodide (PI) fluorescence of Jurkat cells sorted initially for low (ΔΨmL) or high (ΔΨmH) mitochondrial membrane potential using TMRM. (B) Exponentially growing cultures from three different established cell lines were sorted based on TMRM fluorescence. Shown is the percentage of the sorted ΔΨmL (shaded bars) or ΔΨmH (open bars) cells that were in the G1 phase. (C) Sorting strategy for G1 cells with low and high ΔΨm. G1 purified cells denoted in red, were subsequently analyzed for mitochondrial membrane potential as assessed by TMRM fluorescence. (D) Cell cycle analysis of G1 cells sorted for low and high ΔΨm with quantitative post-sort purity derived from four independent experiments (mean ± SD). (E) Post-sort analysis of ΔΨm of G1 cells sorted for low and high membrane potential compared to unsorted G1 cells (shaded area).
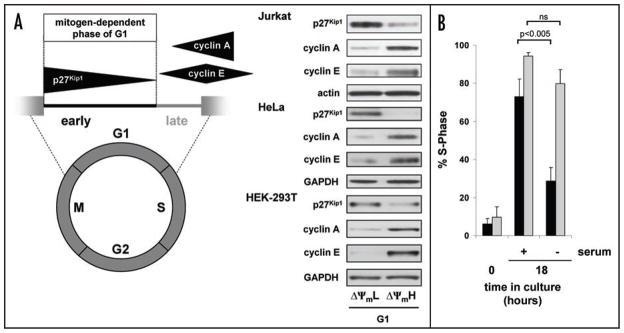
To further analyze these results we concentrated on G1 progression since our results suggested this cell cycle phase contained cells that spontaneously exhibited both ΔΨmL and ΔΨmH. We loaded cells with both TMRM and the DNA dye Hoechst 33342 and sorted cells exhibiting either low or high mitochondrial membrane for G1 potential (Fig. 1C). After FACS purification, post-sort analysis phase (Fig. 1D) and confirmed that these cells were indeed in the G1 still maintained their differences in TMRM fluorescence (Fig. 1E). Although both populations of cells were in G1 by DNA content, as noted in Figure 2A, biochemical analysis revealed that cells with low mitochondrial membrane potential exhibited characteristics of early G1 (high p27Kip1 with low cyclin A and E) while cells in G1 isolated with high mitochondrial membrane potential exhibited (low p27Kip1 with increasing levels characteristics of cells in late G1 of cyclin E and A). This phenomenon was again not confined to only Jurkat cells, as a similar sorting strategy using either HEK-293T or HeLa cells revealed a similar relationship between mitochondrial status (Fig. 2A). membrane potential and G1
Figure 2.
G1 cells with low and high ΔΨm correspond to early and late G1 phase. (A) Schematic representation of G1 progression with corresponding Western blot analysis of G1 cells sorted for low and high ΔΨm in either Jurkat T cells, HeLa cells or HEK-293T cells. (B) Mitochondrial membrane potential and the G1 restriction point. S-phase entry of G1 cells with low (black bars) or high (grey bars) ΔΨm immediately after sorting (time 0) or after being maintained in serum-free conditions for 18 hours or after a similar time following serum stimulation. Results are from three independent experiments (mean ± SD).
The physiological demarcation between early and late G1 is where termed the restriction point and is defined as the point in G1 progression into S phase is no longer dependent on external mitogen stimulation.5 We therefore sought to assess whether sorting G1 cells based on mitochondrial membrane potential allowed for the purification of cell populations on either side of the restriction point. As demonstrated in Figure 2B, in the presence of serum, ΔΨmL or ΔΨmH G1 cells both progressed into S phase at nearly similar levels, thus demonstrating the overall viability of both cell populations. In contrast, in serum-free, mitogen-free conditions, the ΔΨmL cells were predominantly maintained in G1, while under these conditions, the ΔΨmH cells progressed to S phase entry. These observations are consistent with the ΔΨmL cells being proximal to the restriction point, while the ΔΨmH cells behave as if they are distal to this barrier. Interestingly, to our knowledge, the use of this double sorting strategy based on both DNA content and mitochondrial membrane potential provides the first method in an unsynchronized population of cells for the rapid and simple purification of early versus late G1 cells. Taken together, these results are consistent with the notion that mitochondrial membrane potential rises as cells progress from early to late G1.
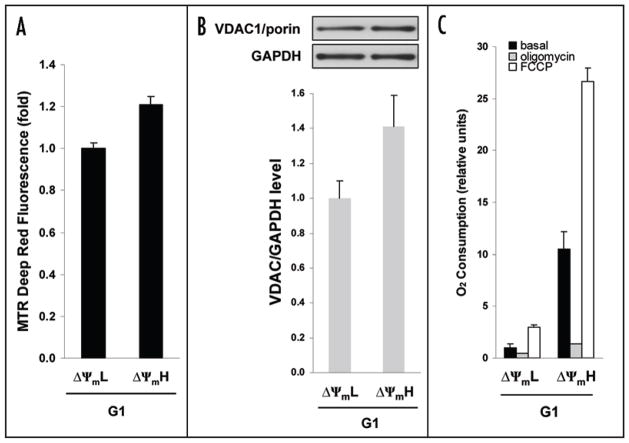
We next sought to more fully characterize the basis for differences in mitochondrial properties between cells in either early or late G1. Observed differences in TMRM fluorescence could potentially reflect differences in mitochondrial potential, overall mitochondrial number/mass or a combination of both membrane potential and mass. We therefore sought to directly characterize mitochondrial populations. Using a fluorescent probe mass in our two different G1 that localizes to the mitochondria but that is independent of mitochondrial membrane potential, we observed a small approximate 1.2 fold increase in mitochondrial mass in the ΔΨmH cells (Fig. 3A). This small difference was also supported by a similar magnitude change in the ratio of expression of the mitochondrial specific protein VDAC1 to the housekeeping gene GAPDH in these two different cell populations (Fig. 3B).
Figure 3.
Oxygen consumption and oxidative capacity during G1 progression. (A) Mitochondrial mass determination from an equal number of cells using Mitotracker (MTR) Deep Red fluorescence (relative scale) of G1 cells sorted for low (ΔΨmL) or high (ΔΨmH) mitochondrial membrane potential using TMRM fluorescence (mean ± SD, n = 3). (B) Expression level of the mitochondrial protein VDAC1/porin detected from equal amount of protein lysate of G1 cells sorted for low (ΔΨmL) or high (ΔΨmH) mitochondrial membrane potential. A representative Western blot is shown as is the quantification from three separate experiments. (C) Corresponding levels of oxygen consumption under basal growth conditions (black bars), in the presence of oligomycin (respiratory leak, grey bars), and FCCP (maximal oxidative capacity, open bars). Data represents means ± SD from three independent experiments.
We next used a miniaturized assay to measure oxygen consumption.6 Approximately 1x 10⁶ FACS sorted ΔΨmL or ΔΨmH cells were aliquoted into individual microtiter wells and the oxygen consumption of intact cells was measured under basal growth conditions or in the presence of oligomycin (to assess respiratory leak) or FCCP (to measure maximal oxidative capacity). As demonstrated in Figure 3C, G1 cells isolated with the lowest and highest mitochondrial membrane potential representing cells in early versus late G1 had substantial differences in overall oxygen consumption. In particular, cells displaying late G1 phase characteristics had significantly higher levels of respiration. The basal levels of ATP were also slightly higher in the late G1 cells (relative increase: 24.1 ± 8.3%, p < 0.01). As noted in Figure 3C, in both cell populations, essentially all of the measured respiration was sensitive to the addition of oligomycin, demonstrating that these observed differences were not a reflection of alterations in mitochondrial uncoupling. Similarly, measurement of respiration in the presence of FCCP revealed that ΔΨmH cells had a substantially higher level of total oxidative capacity progression appears to be (Fig. 3C). As such, in our sorted cells, G1 accompanied by a modest (1.2–1.4 fold) increase in mitochondrial mass but a substantial (5–10 fold) increase in both mitochondrial oxygen consumption and oxidative capacity.
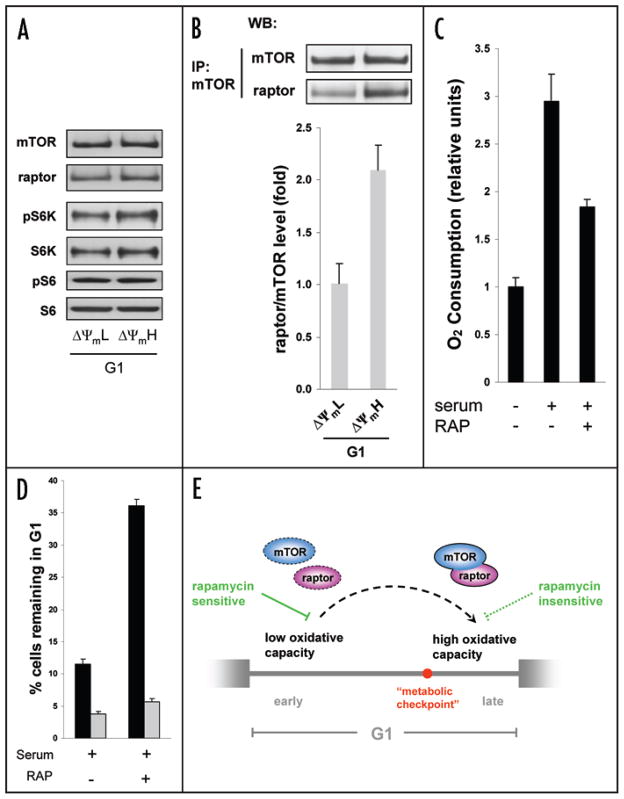
We next asked what mediated the changes in mitochondrial membrane potential and metabolism during the G1 phase. We hypothesized a potential role for mTOR in this regulation for several reasons. Previous studies have clearly demonstrated that mTOR signaling regulates cell cycle progression and its inhibition by progression.7–12 Similarly, we and rapamycin induces a slowing of G1 others have shown that mTOR regulates mitochondrial oxidative function through a S6K independent pathway.6,13 As such, mTOR has been previously implicated in both cellular energy regulation as well as cell cycle progression. Although these two functions of mTOR have generally been viewed as distinct and unrelated, we hypothesized that they might actually be physiologically coupled. We analyzed mTOR levels and activity in our ΔΨmL and ΔΨmH G1 cells. As noted in Figure 4A, absolute protein levels of mTOR and its binding partner raptor were not appreciably altered in these two G1 cell populations. Similarly, we observed no differences in the degree of phosphorylation of S6 kinase (pS6K) or the phosphorylation of S6 itself (Fig. 4A). In contrast, we consistently observed an approximate 2-fold increase in the amount of molecular association between mTOR with raptor, with increased mTOR-raptor complex being associated with higher mitochondrial membrane potential (Fig. 4B). To further strengthen the relationship between mTOR-raptor complex formation and metabolism we purified ΔΨmL cells that we previously had established to be in early G1. These cells were then either maintained in serum free conditions and thus in G1, or alternatively stimulated to progress toward S phase by the addition of serum. In a separate group of ΔΨmL cells, we added both serum and rapamycin. It has been previously established that treatment of Jurkat cells or other cell types with rapamycin disrupts the mTOR-raptor complex.6,14 As noted in Figure 4C, serum stimulation, which progression, significantly triggers G1 increased cellular oxygen consumption. This augmented respiration was inhibited by rapamycin.
Figure 4.
mTOR-raptor complex formation during G1 progression. (A) Western blot analysis of G1 cells sorted by mitochondrial membrane potential demonstrates no significant change in absolute levels of mTOR, raptor, or the activation by phosphorylation of S6K. (B) Formation of mTOR-raptor complexes increases from early to late G1. Equal amounts of protein lysate were immunoprecipitated (IP) for mTOR and the amount of coprecipitated raptor assessed by Western blotting (WB). Quantifica- ion is from three separate experiments. (C) Determination of oxygen consumption in cells isolated so as to be in early G1 (ΔΨmL). Oxygen consumption was measured for cells that were maintained in serum free conditions or for an equal number of cells stimulated for 18 hours with serum in the presence or absence of rapamycin. (D) Mitochondrial membrane potential determines the efficacy of rapamycin-induced G1 delay. Cell cycle analysis of G1 cells sorted for either high or low membrane potential. Cells still remaining in G1 were determined as percentage of BrdU-negative cells 18 hours after serum stimulation in the presence or absence of rapamycin (mean ± SD, n = 3). (E) Model of the G1 phase. The concerted rise of mitochondrial oxidative capacity and formation of mTOR-raptor complex during G1 progression may play a role for the passage of a putative metabolic checkpoint between early and late G1.
We next sought to further assess the relationship between rapamycin exposure, mitochondrial activity, and G1 progression. In particular, we speculated that the observed increase in mTOR-raptor complex during G1 progression might be necessary for cells to overcome what has recently been termed the metabolic checkpoint.4 We therefore reasoned that the ability of rapamycin to slow G1 progression should be a function of intrinsic mitochondrial activity. In particular, cells exhibiting low mitochondrial activity and therefore proximal to the metabolic checkpoint would presumably be more susceptible to rapamycin inhibition. To test this, we separated cells in G1 based upon mitochondrial membrane potential which we previously identified correlated well with mitochondrial activity (Fig. 2C). As seen in Figure 4D, cells in G1 with low mitochondrial membrane potential were indeed significantly more sensitive to rapamycin-induced G1 delay. The percentage of cells remaining in G1 after 18 hours of serum stimulation was significantly increased by rapamycin in G1 ΔΨ mL cells (approx. 3 fold) compared to only minor effects of rapamycin on the cell cycle progression of G1 ΔΨmH cells. Interestingly, a connection between growth in the presence of rapamycin and mitochondrial function has also been recently observed in S. cerevisiae.15
In summary, we have provided evidence that mitochondrial metabolism and cell cycle progression are coordinately regulated. Our data suggests that aerobic ATP production (i.e., oligomycin-sensitive oxygen consumption) as well as mitochondrial membrane G1 progression. Furthermore, we observed potential increase during that the overall capacity of the mitochondria to produce ATP, termed oxidative capacity (maximal FCCP-stimulated respiration), also increases during progression. This increase in metabolic G1 rate served as the basis for a unique isolation strategy of early versus phase cells. Moreover, we observed increased mTOR-raptor late G1 complex formation as cells progressed from early to late G1. Finally, cells are stimulated to progress towards S phase entry, when early G1 the serum-stimulated increase of mitochondrial oxygen consumption can be inhibited by rapamycin. Similarly, the ability of rapamycin to delay was related to underlying mitochondrial energetics. induce G1 Taken together, these results are consistent with previous studies and suggest suggesting the existence of a metabolic checkpoint in G1 that the mTOR dependent regulation of mitochondrial function is part of the checkpoint signaling network.
Methods
Cell culture and reagents
Jurkat E6-1 cells (ATCC) were maintained in RPMI 1640 containing 10% fetal calf serum while HEK-293T and HeLa cells (ATCC) were maintained in DMEM containing 10% calf serum. In general, cell sorting was performed in Hanks Balanced Salt Solution (HBSS). For cultivation after sorting, Jurkat cells were serum-stimulated with their normal culture medium or held in serum-free RPMI 1640.
Immunoblotting and immunoprecipitation
Antibodies for immunoblotting were as follows: mTOR, raptor, phospho-p70 S6K (Thr421/Ser424), p70 S6K, phospho-S6 (Ser235/236), S6, VDAC1/porin (Molecular Probes, Invitrogen), GAPDH (Ambion), actin (Santa Cruz Biotechnology), cyclin A (Zymed Laboratories, Invitrogen), cyclin E, p27Kip1 (BD Biosciences). Western blot analysis was performed by standard methods using enhanced chemiluminescence. Immunoprecipitation of mTOR complexes was performed as described previously16 using the N-19 mTOR antibody from Santa Cruz Biotechnology.
Membrane potential and cell cycle
Membrane potential was assessed using the potentiometric dye tetramethyl rhodamine methyl ester (TMRM) at a final concentration of 25 nM for 15 min. Flow cytometric analysis was performed with the FACS Calibur cytometer (Becton Dickinson Immunocytometry Systems). For cell cycle analysis of cells where no further biological analysis was performed, cells were incubated with Vindelov’s reagent (10 mM Tris, 10 mM NaCl, 75 μM propidium iodine, 0.1% NP40, and 70 U RNase adjusted to pH 8.0) and fluorescence signals as well as forward and side scatter signals were collected on a linear scale. Modfit software (Verity Software) was used for data acquisition and analysis. Alternatively, cell cycle distributions were determined by BrdU incorporation using the FITC BrdU Flow Kit according to the manufacturer’s protocol (BD Biosciences). All cell cycle analysis data shown represent the mean ± SD of at least three independent experiments.
Cell sorting
For sorting of cells with different mitochondrial membrane potential, Jurkat cells were sorted into two pools corresponding to the cells with the lowest (5%), and highest (5%) TMRM fluorescence as described previously.6 For sorting of cells by mitochondrial mass, cells were stained with Mitotracker Deep Red 633 (20 nM for 15 min). In certain experiments, cells were sorted for two parameters, i.e., mitochondrial membrane potential and cell cycle. For the latter parameter we used the cell membrane-permeant DNA dye Hoechst 33342 (Invitrogen) at a final concentration of 5 μg/ml. After gating for cells based on Hoechst G1 33342 fluorescence, cells were sorted into two cells with the lowest pools corresponding to G1 (5%), and highest (5%) TMRM fluorescence. Cell sorting was performed on a MoFlo flow Cytometer (Dako-Cytomation).
Oxygen consumption and ATP measurements
Oxygen consumption was determined using the BD Oxygen Biosensor System (BD Biosciences) as previously described.6 For semi quantitative data analysis, the maximum slope of fluorescence units/s was used and converted into relative units. Levels of oxygen consumption were measured under baseline conditions and in the presence of FCCP (1 μM) or oligomycin (0.2 μg/ml). ATP was measured using the ATP Determination kit (Molecular Probes, Invitrogen). Cells were lysed in buffer (20 mM Tris pH 7.0, 0.5% NP-40, 25 mM NaCl, 2.5 mM EDTA, 2.5 mM EGTA) immediately after FACS-sorting and samples were analyzed in triplicates according to the manufacturer’s recommendation.
References
- 1.Mandal S, Guptan P, Owusu-Ansah E, Banerjee U. Mitochondrial regulation of cell cycle progression during development as revealed by the tenured mutation in Drosophila. Dev Cell. 2005;9:843–54. doi: 10.1016/j.devcel.2005.11.006. [DOI] [PubMed] [Google Scholar]
- 2.Holley RW, Kiernan JA. Control of the initiation of DNA synthesis in 3T3 cells: low-molecular weight nutrients. Proc Natl Acad Sci USA. 1974;71:2942–5. doi: 10.1073/pnas.71.8.2942. [DOI] [PMC free article] [PubMed] [Google Scholar]
- 3.Graeber TG, Peterson JF, Tsai M, Monica K, Fornace AJ, Jr, Giaccia AJ. Hypoxia induces accumulation of p53 protein, but activation of a G1-phase checkpoint by low-oxygen conditions is independent of p53 status. Mol Cell Biol. 1994;14:6264–77. doi: 10.1128/mcb.14.9.6264. [DOI] [PMC free article] [PubMed] [Google Scholar]
- 4.Jones RG, Plas DR, Kubek S, Buzzai M, Mu J, Xu Y, Birnbaum MJ, Thompson CB. AMP-activated protein kinase induces a p53-dependent metabolic checkpoint. Mol Cell. 2005;18:283–93. doi: 10.1016/j.molcel.2005.03.027. [DOI] [PubMed] [Google Scholar]
- 5.Pardee AB. A restriction point for control of normal animal cell proliferation. Proc Natl Acad Sci USA. 1974;71:1286–90. doi: 10.1073/pnas.71.4.1286. [DOI] [PMC free article] [PubMed] [Google Scholar]
- 6.Schieke SM, Phillips D, McCoy JP, Jr, Aponte AM, Shen RF, Balaban RS, Finkel T. The mammalian target of rapamycin (mTOR) pathway regulates mitochondrial oxygen consumption and oxidative capacity. J Biol Chem. 2006;281:27643–52. doi: 10.1074/jbc.M603536200. [DOI] [PubMed] [Google Scholar]
- 7.Chung J, Kuo CJ, Crabtree GR, Blenis J. Rapamycin-FKBP specifically blocks growth-dependent activation of and signaling by the 70 kd S6 protein kinases. Cell. 1992;69:1227–36. doi: 10.1016/0092-8674(92)90643-q. [DOI] [PubMed] [Google Scholar]
- 8.Fingar DC, Richardson CJ, Tee AR, Cheatham L, Tsou C, Blenis J. mTOR controls cell cycle progression through its cell growth effectors S6K1 and 4E-BP1/eukaryotic translation initiation factor 4E. Mol Cell Biol. 2004;24:200–16. doi: 10.1128/MCB.24.1.200-216.2004. [DOI] [PMC free article] [PubMed] [Google Scholar]
- 9.Hashemolhosseini S, Nagamine Y, Morley SJ, Desrivieres S, Mercep L, Ferrari S. Rapamycin to S transition is mediated by effects on cyclin D1 mRNA and protein inhibition of the G1 stability. J Biol Chem. 1998;273:14424–9. doi: 10.1074/jbc.273.23.14424. [DOI] [PubMed] [Google Scholar]
- 10.Heitman J, Movva NR, Hall MN. Targets for cell cycle arrest by the immunosuppressant rapamycin in yeast. Science. 1991;253:905–9. doi: 10.1126/science.1715094. [DOI] [PubMed] [Google Scholar]
- 11.Nourse J, Firpo E, Flanagan WM, Coats S, Polyak K, Lee MH, Massague J, Crabtree GR, Roberts JM. Interleukin-2-mediated elimination of the p27Kip1 cyclin-dependent kinase inhibitor prevented by rapamycin. Nature. 1994;372:570–3. doi: 10.1038/372570a0. [DOI] [PubMed] [Google Scholar]
- 12.Ohanna M, Sobering AK, Lapointe T, Lorenzo L, Praud C, Petroulakis E, Sonenberg N, Kelly PA, Sotiropoulos A, Pende M. Atrophy of S6K1(−/−) skeletal muscle cells reveals distinct mTOR effectors for cell cycle and size control. Nat Cell Biol. 2005;7:286–94. doi: 10.1038/ncb1231. [DOI] [PubMed] [Google Scholar]
- 13.Cunningham JT, Rodgers JT, Arlow DH, Vazquez F, Mootha VK, Puigserver P. mTOR controls mitochondrial oxidative function through a YY1-PGC-1alpha transcriptional complex. Nature. 2007;450:736–40. doi: 10.1038/nature06322. [DOI] [PubMed] [Google Scholar]
- 14.Kim DH, Sarbassov DD, Ali SM, King JE, Latek RR, Erdjument-Bromage H, Tempst P, Sabatini DM. mTOR interacts with raptor to form a nutrient-sensitive complex that signals to the cell growth machinery. Cell. 2002;110:163–75. doi: 10.1016/s0092-8674(02)00808-5. [DOI] [PubMed] [Google Scholar]
- 15.Xie MW, Jin F, Hwang H, Hwang S, Anand V, Duncan MC, Huang J. Insights into TOR function and rapamycin response: chemical genomic profiling by using a high-density cell array method. Proc Natl Acad Sci USA. 2005;102:7215–20. doi: 10.1073/pnas.0500297102. [DOI] [PMC free article] [PubMed] [Google Scholar]
- 16.Sarbassov DD, Ali SM, Kim DH, Guertin DA, Latek RR, Erdjument-Bromage H, Tempst P, Sabatini DM. Rictor, a novel binding partner of mTOR, defines a rapamycin-insensitive and raptor-independent pathway that regulates the cytoskeleton. Curr Biol. 2004;14:1296–302. doi: 10.1016/j.cub.2004.06.054. [DOI] [PubMed] [Google Scholar]


