Abstract
Invading pathogens provoke the autophagic machinery and, in a process termed xenophagy, the host cell survives because autophagy is employed as a safeguard for pathogens that escaped phagosomes. However, some pathogens can manipulate the autophagic pathway and replicate within the niche of generated autophagosome-like vesicles. By automated fluorescence-based high content analyses, we demonstrate that Staphylococcus aureus strains (USA300, HG001, SA113) stimulate autophagy and become entrapped in intracellular PtdIns(3)P-enriched vesicles that are decorated with human WIPI-1, an essential PtdIns(3)P effector of canonical autophagy and membrane protein of both phagophores and autophagosomes. Further, agr-positive S. aureus (USA300, HG001) strains were more efficiently entrapped in WIPI-1 positive autophagosome-like vesicles when compared to agr-negative cells (SA113). By confocal and electron microscopy we provide evidence that single- and multiple-Staphylococci entrapped undergo cell division. Moreover, the number of WIPI-1 positive autophagosome-like vesicles entrapping Staphylococci significantly increased upon (i) lysosomal inhibition by bafilomycin A1 and (ii) blocking PIKfyve-mediated PtdIns(3,5)P2 generation by YM201636. In summary, our results provide evidence that the PtdIns(3)P effector function of WIPI-1 is utilized during xenophagy of Staphylococcus aureus. We suggest that invading S. aureus cells become entrapped in autophagosome-like WIPI-1 positive vesicles targeted for lysosomal degradation in nonprofessional host cells.
1. Introduction
Macroautophagy (hereafter autophagy) is a cytoprotective cellular degradation mechanism for long-lived proteins and organelles [1]. Autophagy is specific to eukaryotic cells and important for cellular survival by enabling a constitutive clearance and recycling of cytoplasmic material (basal autophagy). Crucial to the process of autophagy is the fact, that cytoplasmic material is stochastically degraded. Portions of the cytoplasm become randomly sequestered in unique, double-membrane vesicles, autophagosomes. Autophagosomes are generated by elongation and closure of a membrane precursor, the phagophore. Subsequently, autophagosomes fuse with lysosomes to acquire acidic hydrolases for cargo degradation [2]. This stochastic constitutive form of autophagy provides constant clearance of the cytoplasm. Upon stress, such as starvation, the autophagic activity is induced above basal level to compensate nutrient shortage by providing monomeric constituents, such as amino acids, and energy. Conversely, under nutrient-rich conditions autophagy is suppressed by the mTORC1 signaling circuit [3]. Importantly, autophagy is also activated in a specific manner and targets damaged organelles, protein aggregates, or pathogens for degradation [4]. Both, stochastic and specific autophagy are crucial to secure cellular homeostasis [5].
Prerequisite for the formation of autophagosomes is the generation of an essential phospholipid, phosphatidylinositol 3-phosphate (PtdIns(3)P), a result of the activity of the phosphatidylinositol 3-kinase class III (PtdIns3KC3) in complex with Beclin 1, p150, and Atg14L [6, 7]. The PtdIns(3)P signal is decoded through PtdIns(3)P-binding effectors specific to autophagy, such as the human WIPI proteins [8]. WIPI-1 (Atg18 in yeast) specifically binds PtdIns(3)P at the phagophore and fosters the recruitment of two ubiquitin-like conjugation systems, Atg12 and LC3, involved in phagophore elongation and closure [9]. Subsequently, WIPI-1 becomes a membrane protein of autophagosomes where it localizes at both the inner and outer membrane [10, 11]. Hence the specific localization of WIPI-1 at the phagophore and at autophagosomes upon the initiation of autophagy can monitor the process of canonical autophagy, as it is dependent on the PtdIns(3)P signal [11].
The process of autophagy is closely connected with a variety of diseases such as tumor development, neurodegeneration, and with cellular responses to pathogens, including viral infection and bacterial cell invasion [5, 12]. Staphylococcus aureus, a major pathogen for nosocomial infectious diseases was initially characterized as an extracellular pathogen, but was later found to also target nonprofessional host cells like keratinocytes, fibroblasts, endothelial cells, and epithelial cells where invading S. aureus liberates from the endosomal compartment [13]. In HeLa cells, S. aureus was found to become sequestered and to replicate in autophagosome-like vesicles as a result of autophagosome/lysosome fusion block, which ultimately leads to cell death [14].
Here, we visualized the invasion of mCherry-expressing S. aureus strains USA300, HG001, SA113 in human U2OS tumor cells that stably express GFP-WIPI-1 for automated fluorescence-based high content analyses, a procedure that monitors the autophagic process and that we have established earlier [15]. We provide evidence that S. aureus stimulates canonical autophagy in nonprofessional host cells and becomes entrapped in noncanonical WIPI-1 positive autophagosome-like vesicles. Time course experiments showed that the number of tumor cells that contain such WIPI-1 positive autophagosome-like vesicles with entrapped S. aureus cells increased over time (30 min–2 h). After an infection period of 2 h, 40–50% of the cells harbored WIPI-1 positive autophagosome-like vesicles sequestering agr-positive S. aureus (USA300, HG001), and 20% of the tumor cells contained entrapped agr-negative S. aureus (SA113). Importantly, we demonstrate that the number of WIPI-1 positive autophagosome-like vesicles harboring S. aureus significantly increased upon lysosomal inhibition, strongly arguing for the degradation of S. aureus through xenophagy. In addition, by employing GFP-FYVE and a selective PIKfyve inhibitor (YM201636) we further demonstrate the requirement of PtdIns(3)P-enriched membranes during the process of entrapping invading S. aureus.
2. Material and Methods
2.1. Eukaryotic Cell Culture
The human osteosarcoma cell line U2OS (ATCC) was cultured in DMEM (Invitrogen) supplemented with 10% FCS (PAA), 100 U/mL penicillin/100 μg/mL streptomycin (Invitrogen), 5 μg/mL plasmocin (Invivogen) at 37°C, 5% CO2. Monoclonal human U2OS cell clones stably expressing either GFP-WIPI-1 [15, 20] or GFP-2xFYVE [9] were cultured in DMEM (Invitrogen) supplemented with 10% FCS (PAA), 100 U/mL penicillin/100 μg/mL streptomycin (Invitrogen), 5 μg/mL plasmocin (Invivogen), 0.6 mg/mL G418 (Invitrogen) at 37°C, 5% CO2. The following media were used for treatments: DMEM/FCS (DMEM supplemented with 10% FCS), DMEM (DMEM without FCS), and EBSS (Sigma-Aldrich).
2.2. Bacterial Strains
S. aureus USA300, HG001, SA113, or S. carnosus TM300 [21] (see Table 1) were electroporated with the pCtuf-ppmch plasmid. The pCtuf-ppmch plasmid encoded mCherry fused with the propeptide of lipase for fluorescence enhancement, and ppmch expression was controlled by the native constitutive EF-Tu promotor. Electroporated bacterial strains were grown in basic medium (1% peptone, 0.5% yeast extract, 0.5% NaCl, 0.1% glucose, 0.1% K2HPO4) at 37°C to an OD600 of 0.8 and harvested by centrifugation.
Table 1.
Bacterial strains used in this study.
| Bacterial strain | Relevant properties | Relevant genotype | Reference |
|---|---|---|---|
| S. aureus USA300 | Pathogenic, community-associated methicillin-resistant S. aureus (CA-MRSA) | ag r + | [16] |
| S. aureus HG001 | Pathogenic, methicillin-sensitive S. aureus (MSSA) | ag r + | [17] |
| S. aureus SA113 | Pathogenic, methicillin-sensitive S. aureus (MSSA) | ag r − | [18] |
| S. carnosus TM300 | Apathogenic, food grade staphylococcal species | [19] |
2.3. Bacterial Infection of Eukaryotic Host Cells
GFP-WIPI-1 expressing U2OS cells were seeded in 96-well plates (Brand) in DMEM/10% FCS 20 hours before bacterial infection. S. aureus (USA300, HG001, SA113) or S. carnosus carrying the pCtuf-ppmch plasmid, were diluted in DMEM, DMEM/10% FCS or EBSS (Sigma-Aldrich) to an m.o.i of 100, added to the GFP-WIPI-1 U2OS cells, and incubated for 0.5, 1, or 2 hours at 37°C, 5% CO2. Alternatively, S. aureus USA300 cells were diluted (m.o.i of 100) in DMEM/FCS supplemented with either bafilomycin A1 (200 nM, Sigma-Aldrich) or YM201636 (800 nM, Cayman Chemicals) or with both and used to infect GFP-WIPI-1 expressing U2OS cells for 2 hours at 37°C, 5% CO2. Alternatively, GFP-2xFYVE expressing U2OS cells [9] were infected with S. aureus USA300 (in DMEM/FCS) for 2 hours at 37°C, 5% CO2.
2.4. Autophagy Assay
GFP-WIPI-1 expressing U2OS cells, seeded in 96-well plates, were treated with nutrient-rich culture medium (DMEM/10% FCS), culture medium lacking serum (DMEM), or medium lacking serum and amino acids (EBSS) for 0.5, 1, or 2 hours. After fixation with 3.7% paraformaldehyde for 30 minutes, autophagy was accessed by WIPI-1 puncta formation analysis [11, 22] (see below).
2.5. Confocal Laser Scanning Microscopy
Confocal microscopy was conducted as previously described [8]. Images were acquired using an LSM510 microscope (Zeiss) and a 63 × 1.4 DIC Plan-Apochromat oil-immersion objective. For each image, 8–10 optical sections (0.5 μm) were acquired. Both, single optical sections as well as projections from 8–10 optical sections are presented.
2.6. Automated Fluorescence Image Acquisition and Analysis
Stable GFP-WIPI-1 U2OS cells were automatically imaged and analysed using the In Cell Analyzer 1000 (GE Healthcare) as described earlier [9, 15]. Cells exposed to bacteria (see above) were stained with DAPI (5 μg/mL; Applichem). Fluorescence images were automatically acquired with a Nikon 40x Plan Fluor objective and the excitation/emission filter D360_40X/HQ460_40M (DAPI), HQ535_50X/HQ620_60 M (mCherry), and S475_20X/HQ535_50M (GFP). GFP-WIPI-1 puncta were automatically analysed as previously described [15] and the number of GFP-WIPI-1 puncta-positive cells as well as the number of GFP-WIPI-1 puncta per cell was determined. Red fluorescent bacteria were automatically analysed by using the dual area object analysis. The algorithms inclusion and multiscale top hat were applied and the total area of bacterial fluorescence within the cell was determined. To determine the number of cells containing GFP-WIPI-1 positive autophagosome-like vesicles sequestering bacteria, automatically acquired fused images (DAPI, GFP, mCherry) of 100 individual cells for each treatment were analyzed.
2.7. Electron Microscopy
Stable GFP-WIPI-1 U2OS cells were infected with S. aureus USA300 (m.o.i of 100) in DMEM/FCS and fixed in 2% glutaraldehyde and 0.5% osmium tetroxide in 0.1 M PBS, dehydrated with ethanol, and embedded in Epon using standard procedures as previously described [23]. Thin sections were cut using an ultramicrotome and contrasted with uranyl acetate and lead citrate. Thin sections were examined in an EM410 electron microscope (Philips) and documented digitally (DITABIS).
2.8. Statistical Analysis
Statistical significance was evaluated using two-tailed heteroscedastic t-testing and P values were calculated.
3. Results
3.1. Visualizing Basal and Induced Autophagy by Automated GFP-WIPI-1 Image Acquisition and Analysis
The WIPI-1 puncta-formation assay allows the assessment of the evolutionarily conserved, PtdIns(3)P-dependent initiation of autophagy on the basis of fluorescence microscopy, previously employed by using confocal microscopy or automated image acquisition and analysis [11, 15]. Thereby, endogenous WIPI-1 can be visualized by indirect immunofluorescence or alternatively by introducing GFP-WIPI-1 as conducted in the present study. Fluorescent WIPI-1 puncta reflect the accumulation of WIPI-1 at membranes via its specific binding to PtdIns(3)P was found to represent phagophores and autophagosomes [10, 11]. In addition, WIPI-1 binds to PtdIns(3)P at the endoplasmic reticulum and at the plasma membrane upon the induction of autophagy, indicative for membrane origins where phagophore/autophagosome formation is initiated by unknown mechanisms [10]. Here, we employed automated GFP-WIPI-1 image acquisition and analysis as follows. Human U2OS cells that stably express GFP-WIPI-1 were seeded in 96-well plates and basal autophagy, and starvation-induced autophagy was monitored in up to 3000 individual cells per treatment over time (Figure 1). After an incubation period of 0.5, 1, or 2 h with nutrient-rich culture medium (DMEM/FCS), basal autophagic activity was found in approximately 10% of the cells (Figures 1(a) and 1(d)). Serum starvation (DMEM) elevated the number of GFP-WIPI-1 puncta-positive cells to approximately 50% (Figures 1(b) and 1(d)), and both serum and amino acid starvation (EBSS) further elevated this number to approximately 85% (Figures 1(c) and 1(d)). In addition, we demonstrate that with regard to nutrient-rich medium (DMEM/FCS), the number of GFP-WIPI-1 puncta per cell also increased upon serum (DMEM) or upon both serum and amino acid starvation (EBSS) (Figure 1(e)). These culture media (DMEM/FCS, DMEM, EBSS) were used in the following experiments to infect GFP-WIPI-1 expressing U2OS cells with mCherry-expressing Staphylococci.
Figure 1.
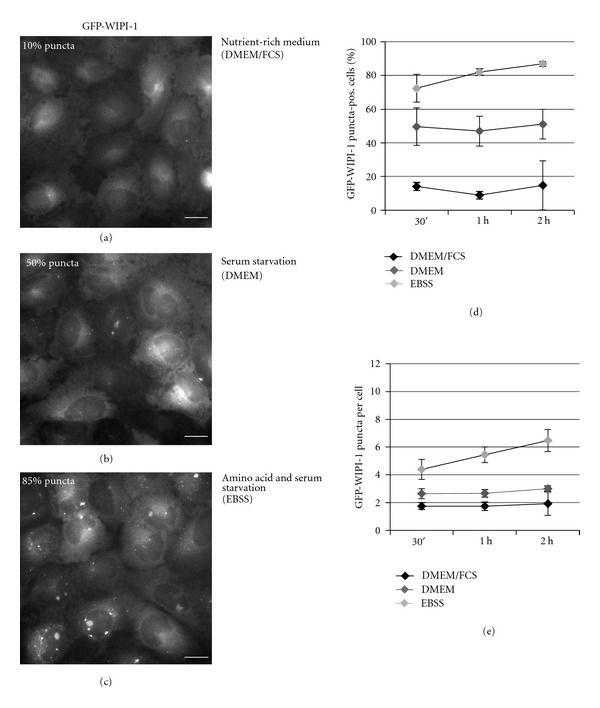
GFP-WIPI-1 puncta formation upon serum and amino acid starvation. GFP-WIPI-1 U2OS cells were treated with nutrient-rich culture medium (DMEM/FCS), serum-free culture medium (DMEM), or with medium lacking both serum and amino acids (EBSS) for 0.5, 1, and 2 h. Fluorescence images were automatically acquired and 2 h treatment images are shown ((a)–(c)). The number of GFP-WIPI-1 puncta-positive cells (d), and of GFP-WIPI-1 puncta per cell (e) was automatically determined. Each measure point represents mean value from up to 3000 individually analyzed cells per treatment condition ± SD (n = 2, each in triplicates). Scale bars: 20 μm.
3.2. Formation of GFP-WIPI-1 Positive Autophagosome-Like Vesicles upon Staphylococcus aureus Infection
Upon infection of GFP-WIPI-1 U2OS cells with pathogenic Staphylococci, here S. aureus HG001, in nutrient-rich medium (DMEM/FCS), we identified canonical, autophagosomal GFP-WIPI-1 membranes (Figures 2(a) and 2(b)), and new GFP-WIPI-1 autophagosome-like vesicles that were larger in diameter with decreased fluorescence intensity (Figure 2(c)) when compared to the canonical GFP-WIPI-1 puncta. GFP-WIPI-1 autophagosome-like vesicles (Figure 2(c)) were rarely observed when starvation media (DMEM, EBSS) were used during the infection with S. aureus HG001 (Supplementary Figure 1 available online at doi:10.1155/2012/179207).
Figure 2.
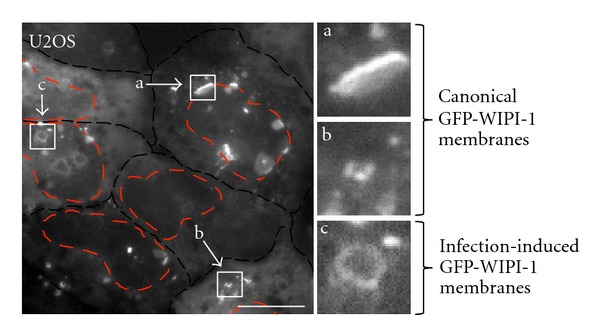
GFP-WIPI-1 images upon infection of U2OS cells with S. aureus HG001. GFP-WIPI-1 U2OS cells were infected with S. aureus HG001 in DMEM/FCS for 2 h and images were automatically acquired. GFP-WIPI-1 fluorescence of the cells (indicated with the black-dashed line) is shown, and cell nuclei are indicated (red-dashed line) according to DAPI staining (not shown). Highlighted are the different GFP-WIPI-1 structures observed: large perinuclear GFP-WIPI-1 positive membranes (a) and cytoplasmic GFP-WIPI-1 puncta (b), reflecting canonical autophagosomal membranes. In addition, GFP-WIPI-1 positive autophagosomal-like vesicles appeared specifically upon infection (c). Scale bars: 20 μm. Supplementary information is provided (Supplementary Figure 1).
To monitor and quantify this particular GFP-WIPI-1 response upon mCherry-expressing Staphylococci infection in an automated fashion (Figure 3), cells were stained with DAPI and by using three different excitation/emission filters, DAPI, GFP, and mCherry fluorescence images were acquired (Figure 3). Up to 2723 individual cells per treatment were automatically recognized by both DAPI and the overall cellular GFP fluorescence. GFP images were used to automatically detect and determine the number of cells harboring GFP-WIPI-1 puncta by applying a decision tree as previously described [15]. Additionally, mCherry fluorescence was used to automatically determine the fluorescence area, reflecting the load of intracellular Staphylococci. For the quantification of cells harboring GFP-WIPI-1 positive autophagosome-like vesicles entrapping Staphylococci, fused images (DAPI, GFP, mCherry) of 100 individual cells were used (Figure 3).
Figure 3.
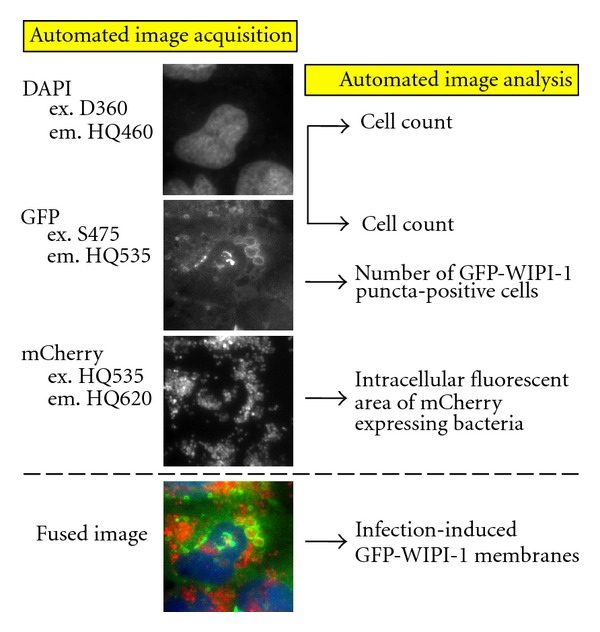
Automated image acquisition and analysis of stably expressing GFP-WIPI-1 U2OS cells with mCherry-expressing Staphylococci. Fluorescence images (middle panel) were automatically acquired using different emission/excitation filters for DAPI, GFP, and mCherry (left panel). DAPI and GFP images were used to automatically detect individual cells, and GFP images were used for detecting and analyzing GFP-WIPI-1 puncta formation (indicated in the right panel). Additionally, for each individual cell the bacterial area was determined (indicated in the right panel) and a fused image was further used to determine the number of cells harboring WIPI-1 positive autophagosome-like vesicles entrapping Staphylococci.
3.3. Pathogenic Staphylococcus aureus USA300, HG001, and SA113 Stimulated Canonical Autophagosome Formation and Became Entrapped in GFP-WIPI-1 Positive Autophagosome-Like Vesicles
In the following experiment, GFP-WIPI-1 expressing U2OS cells were infected for 0.5, 1 and 2 h with mCherry-expressing S. aureus USA300 (Figure 4, Supplementary Figure 2), HG001 (Figure 5, Supplementary Figure 3), or SA113 (Figure 6, Supplementary Figure 4) either in nutrient-rich medium (DMEM/FCS), serum-free medium (DMEM), or serum and amino acid-free medium (EBSS). Subsequently, fluorescence images (approximately 2000 individual cells per treatment) were automatically acquired and analyzed as described (Figure 3). Please note that the control experiments in Figure 1 were conducted in parallel to the experiments presented in Figures 4–7 hence provide the comparison for conditions without (Figure 1) and with (Figures 4–7, Supplementary Figures 2–5) Staphylococci.
Figure 4.
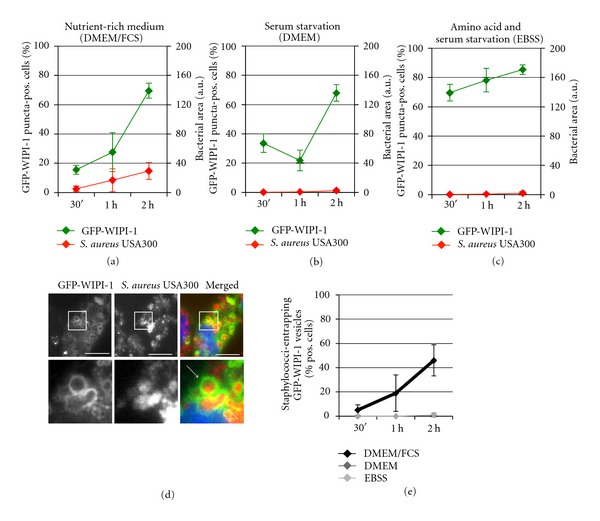
Pathogenic S. aureus USA300 induces GFP-WIPI-1 puncta formation and becomes entrapped in GFP-WIPI-1 positive autophagosome-like vesicles. GFP-WIPI-1 U2OS cells were infected with mCherry-expressing S. aureus USA300 for 0.5, 1, and 2 h in DMEM/FCS, DMEM, or EBSS. Automated image acquisition and analysis were conducted as described in Figure 3. The quantification of up to 2000 individual cells is presented for GFP-WIPI-1 (in green) and S. aureus USA300 (in red) using either DMEM/FCS (a), DMEM (b), or EBSS (c) for infection ± SD (n = 2, each in duplicates). Representative images (2 h infection in DMEM/FCS) are shown (d). Scale bars: 20 μm. From 100 infected cells for each of the treatment condition, the number of cells displaying GFP-WIPI-1 positive autophagosomal-like vesicles entrapping S. aureus USA300 was determined (e) ± SD (n = 2, each in duplicates).
Figure 5.
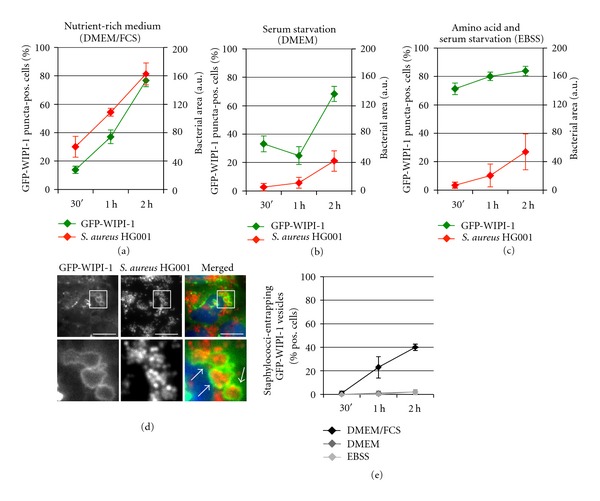
Pathogenic S. aureus HG001 induces GFP-WIPI-1 puncta formation and becomes entrapped in GFP-WIPI-1 positive autophagosome-like vesicles. According to Figure 4, GFP-WIPI-1 U2OS cells were infected with mCherry-expressing S. aureus HG001 in DMEM/FCS (a), DMEM (b), and EBSS (c), and up to 2000 individual cells were analyzed. Images (2 h, DMEM/FCS) are shown (d). Scale bars: 20 μm. The number of cells displaying GFP-WIPI-1 positive autophagosomal-like vesicles entrapping S. aureus HG001 was determined (e) ± SD (n = 2, each in duplicates).
Figure 6.
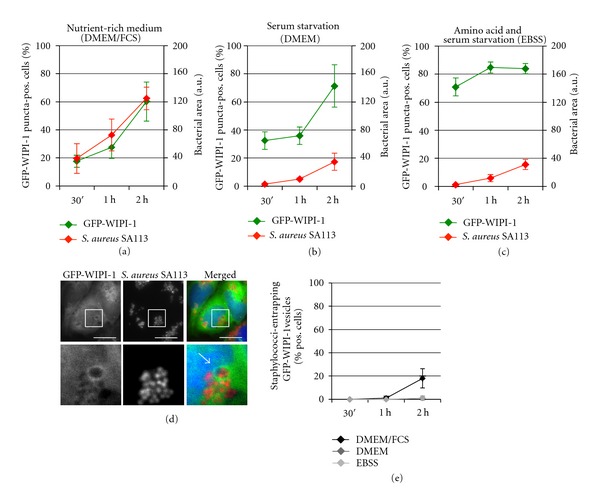
Pathogenic S. aureus SA113 induces GFP-WIPI-1 puncta formation and becomes entrapped in GFP-WIPI-1 positive autophagosome-like vesicles. According to Figures 4 and 5, GFP-WIPI-1 U2OS cells were infected with mCherry-expressing S. aureus SA113 in DMEM/FCS (a), DMEM (b), and EBSS (c) and analyzed (up to 2000 individual cells), representative images (2 h, DMEM/FCS) are shown ((d), scale bars: 20 μm), and the quantification of cells displaying GFP-WIPI-1 positive autophagosomal-like vesicles entrapping S. aureus SA113 is presented (e) ± SD (n = 2, each in duplicates).
Figure 7.
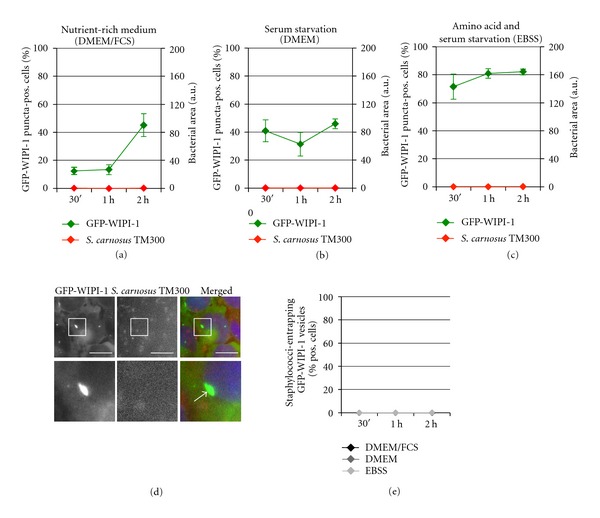
Apathogenic S. carnosus TM300 cells are not entrapped in GFP-WIPI-1 positive autophagosome-like vesicles. According to Figures 4–6, GFP-WIPI-1 U2OS cells were infected with mCherry-expressing S. carnosus TM300 in DMEM/FCS (a), DMEM (b), and EBSS (c) and analyzed (up to 2000 individual cells). Representative images (2 h, DMEM/FCS) are presented ((d), scale bars: 20 μm). The number of cells with GFP-WIPI-1 positive autophagosomal-like vesicles entrapping S. carnosus TM300 is presented (e) ± SD (n = 2, each in duplicates).
As shown in Figure 1, under nutrient rich conditions (DMEM/FCS) the number of GFP-WIPI-1 puncta-positive cells is low (approximately 10%), reflecting cells that undergo basal autophagy. Interestingly, upon infection of GFP-WIPI-1 expressing U2OS cells with S. aureus USA300 in DMEM/FCS, a prominent increase of GFP-WIPI-1 puncta-positive cells (up to approximately 70% within 2 h of infection) was observed (Figure 4(a), in green). In addition, the number of GFP-WIPI-1 puncta per individual cell also increased upon S. aureus USA300 infection in DMEM/FCS (Supplementary Figure 6(B)). The elevated number of GFP-WIPI-1 puncta-positive cells and GFP-WIPI-1 puncta per cell correlated with an increase of intracellular S. aureus USA300 (Figure 4(a), in red). Using serum-free conditions either in the presence (DMEM, Figure 4(b), in red) or absence of amino acids (EBSS, Figure 4(c), in red), no increase of intracellular S. aureus USA300 was observed. However, infection of S. aureus USA300 in DMEM also resulted in an increase (up to approximately 70%) of GFP-WIPI-1 puncta-positive cells (Figure 4(b), in green), whereas S. aureus USA300 in EBSS (Figure 4(c)) did not trigger a further increase of the number of GFP-WIPI-1 puncta-positive cells when compared to EBSS treatment alone (Figure 1).
Next, we determined the number of cells displaying entrapped S. aureus USA300 within GFP-WIPI-1 positive autophagosome-like vesicles (Figures 4(d) and 4(e)). In line with the increased number of cells carrying intracellular S. aureus USA300 when nutrient-rich medium (DMEM/FCS) was used (Figure 4(a)), the number of cells with GFP-WIPI-1 positive autophagosome-like vesicles that entrap S. aureus USA300 (approximately 40%) also increased (Figure 4(e)). This was not observed by using DMEM or EBSS (Figure 4(e)). We also provide the control images corresponding to S. aureus USA300 infections using either DMEM or EBSS (Supplementary Figure 2).
The infection of stably expressing GFP-WIPI-1 U2OS cells with S. aureus HG001 in DMEM/FCS also triggered an elevation of GFP-WIPI-1 puncta-positive cells (up to 76%) (Figure 5(a), in green) and of GFP-WIPI-1 puncta per cell (Supplementary Figure 6(C)). Again, the increased number of GFP-WIPI-1 puncta-positive cells correlated with an increased bacterial load (Figure 5(a), in red) and the increase in the number of cells displaying GFP-WIPI-1 positive autophagosome-like vesicles entrapping S. aureus HG001 (approximately 40%) (Figures 5(d) and 5(e)). Also in this case, this feature was not observed by using DMEM or EBSS (Figure 5(e)), but DMEM conditions still triggered an increase of GFP-WIPI-1 puncta formation (Figure 5(b), Supplementary Figure 6(C)) when compared with control setting (Figure 1, Supplementary Figure 6(A)). Control images corresponding to S. aureus HG001 infections using either DMEM or EBSS are also provided (Supplementary Figure 3).
Next, we employed the agr-deficient S. aureus strain SA113 and infected stably expressing GFP-WIPI-1 U2OS cells. Clearly, upon infection in DMEM/FCS the number of GFP-WIPI-1 puncta-positive cells increased over time to up to 60% (Figure 6(a), in green), which correlated with an increasing bacterial load (Figure 6(a), in red). See also the increased number of GFP-WIPI-1 puncta per cell upon S. aureus SA113 infection in DMEM/FCS (Supplementary Figure 6(D)). In contrast to the effect of the employed agr-positive S. aureus strains USA300 (Figure 4) and HG001 (Figure 5), the number of cells displaying S. aureus SA113 entrapped in GFP-WIPI-1 positive autophagosome-like vesicles was prominently lower (approximately 18%) (Figures 6(d) and 6(e)). However, the presence of S. aureus SA113 in DMEM also triggered an increase of GFP-WIPI-1 puncta-positive cells (Figure 6(b)) when compared to control settings (Figure 1), whereas in EBSS no further elevation was achieved (Figure 6(c)), and in both cases, cells did not display entrapped S. aureus SA113 (Figure 6(e)). Control images of S. aureus SA113 infections with either DMEM or EBSS are also provided (Supplementary Figure 4).
3.4. Apathogenic Staphylococcus carnosus TM300 Cells Were Not Entrapped in Intracellular GFP-WIPI-1 Positive Autophagosome-Like Vesicles
In contrast to the pathogenic S. aureus strains (see above), infection of stably expressing GFP-WIPI-1 U2OS cells with the apathogenic S. carnosus TM300 did not result in an invasion of host cells in either of the used media (Figures 7(a)–7(c)). In line, GFP-WIPI-1 positive autophagosome-like vesicles were not induced (Figures 7(d) and 7(e)). Control images for S. carnosus TM300 in DMEM or EBSS are provided (Supplementary Figure 5). Interestingly, within 2 h of incubation with S. carnosus TM300 in DMEM/FCS, the number of GFP-WIPI-1 puncta-positive cells increased (approximately 45%) (Figure 7(a)) when compared to the control settings (Figure 1), which was not observed by using DMEM (Figure 7(b)) or EBSS (Figure 7(c)). However, the number of GFP-WIPI-1 puncta per individual cell did not increase upon infection of S. carnosus TM300 in DMEM/FCS (Supplementary Figure 6(E)) when compared to uninfected conditions (Supplementary Figure 6(A)).
3.5. Inhibition of PtdIns(3,5)P2 Production and Lysosomal Inhibition Increased the Number of WIPI-1 Positive Autophagosome-Like Vesicles Entrapping Staphylococcus aureus
Next, we questioned whether pathogenic S. aureus cells entrapped in GFP-WIPI-1 positive autophagosomal-like vesicles are degraded in the lysosome. We employed the lysosomal inhibitor bafilomycin A1 (Baf A1) to block autophagosome/lysosome fusion events upon infection of GFP-WIPI-1 expressing U2OS cells with S. aureus USA300 in DMEM/FCS. Upon Baf A1 addition the number of cells harboring GFP-WIPI-1 positive autophagosomal-like vesicles entrapping S. aureus USA300 (Figure 8(a), left panel) significantly increased. And, the number of GFP-WIPI-1 positive autophagosomal-like vesicles per individual cell also significantly increased (Figure 8(b), left panel). In this situation (Figure 8(a), left panel; Figure 8(b), left panel) we found that the bacterial load did not significantly change (Supplementary Figure 7).
Figure 8.
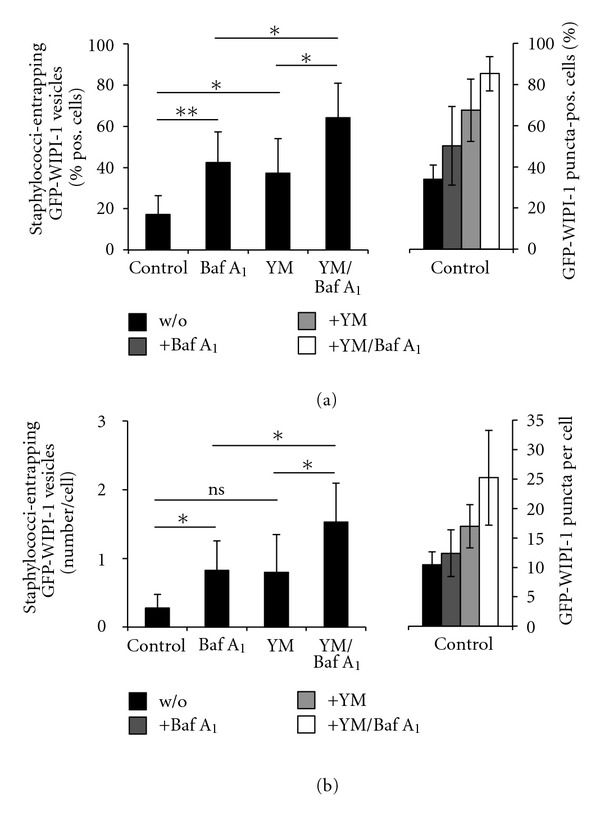
Bafilomycin A1 and YM201636 treatments increased the number of GFP-WIPI-1 positive autophagosome-like vesicles entrapping Staphylococci. GFP-WIPI-1 U2OS cells were infected with S. aureus USA300 in DMEM/FCS in the absence (control) or presence of 200 nM bafilomycin A1 (Baf A1), 800 nM YM201636 (YM), or with both (Baf A1/YM) for 2 h. Images were automatically acquired (not shown). The number of GFP-WIPI-1 puncta-positive cells ((a), right panel) and the number of GFP-WIPI-1 puncta per cell ((b), right panel) was determined. From 100 infected cells for each of the treatment condition, the number of cells displaying GFP-WIPI-1 positive autophagosomal-like vesicles entrapping S. aureus USA300 ((a), left panel) and the number of GFP-WIPI-1 autophagosomal-like vesicles entrapping S. aureus USA300 per cell ((b), left panel) was determined (n = 3). *P < 0.05, **P < 0.01, ns: not significant.
Further, during infection of GFP-WIPI-1 expressing U2OS cells with S. aureus USA300 in DMEM/FCS we employed YM201636 (YM), a specific PIKfyve inhibitor that blocks PtdIns(3,5)P2 production from PtdIns(3)P [24]. Upon YM treatment the number of cells harboring GFP-WIPI-1 positive autophagosomal-like vesicles (Figure 8(a), left panel) and the number of the vesicles per cell (Figure 8(b), left panel) significantly increased. Again, the intracellular bacterial load within the cells did not change (Supplementary Figure 7). Baf A1/YM cotreatment had an additive effect (Figures 8(a) and 8(b) left panels). The corresponding automated GFP-WIPI-1 puncta formation analysis is also provided (Figures 8(a) and 8(b) right panels).
3.6. Confocal and Electron Microscopy of Intracellular Staphylococcus aureus USA300
To achieve more image resolution, we infected GFP-WIPI-1 expressing U2OS cells with S. aureus USA300 in DMEM/FCS followed by confocal laser scanning microscopy (Figure 9(a)). Clearly, GFP-WIPI-1 positive autophagosome-like vesicles harbored multiple S. aureus USA300 cells and the analysis of individual confocal sections confirmed that these vesicles are found in the cytoplasm (Figure 9(a), 1–4).
Figure 9.
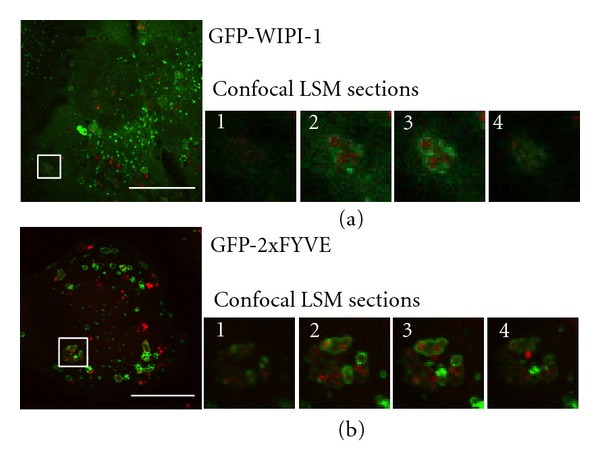
Confocal laser scanning microscopy of S. aureus USA300 infected GFP-WIPI-1 or GFP-2xFYVE expressing U2OS cells. GFP-WIPI-1 (a) or GFP-2xFYVE (b) expressing U2OS cells were infected with S. aureus USA300 for 2 h in DMEM/FCS. Representative images (n = 3) are shown. Magnifications display individual LSM sections (1–4). Scale bars: 20 μm.
It has been shown that S. aureus invading HeLa cells become sequestered in Rab7-positive endosomes [14]. As Rab7 marks late endosomes, we here used GFP-2xFYVE to visualize early endosomes. We used GFP-2xFYVE expressing U2OS cells for infection with S. aureus USA300 in DMEM/FCS. Indeed, we also found that S. aureus USA300 cells were entrapped in GFP-2xFYVE positive endosomes (Figure 9(b), 1–4).
Further, by electron microscopy we found that intracellular S. aureus USA300 cells are entrapped in vesicles with a single S. aureus USA300 cell (Figure 10(a)), or in vesicles harboring multiple S. aureus USA300 cells (Figure 10(b)). In both cases, intracellular S. aureus USA300 cells showed clear signs of ongoing cell division (red arrows).
Figure 10.
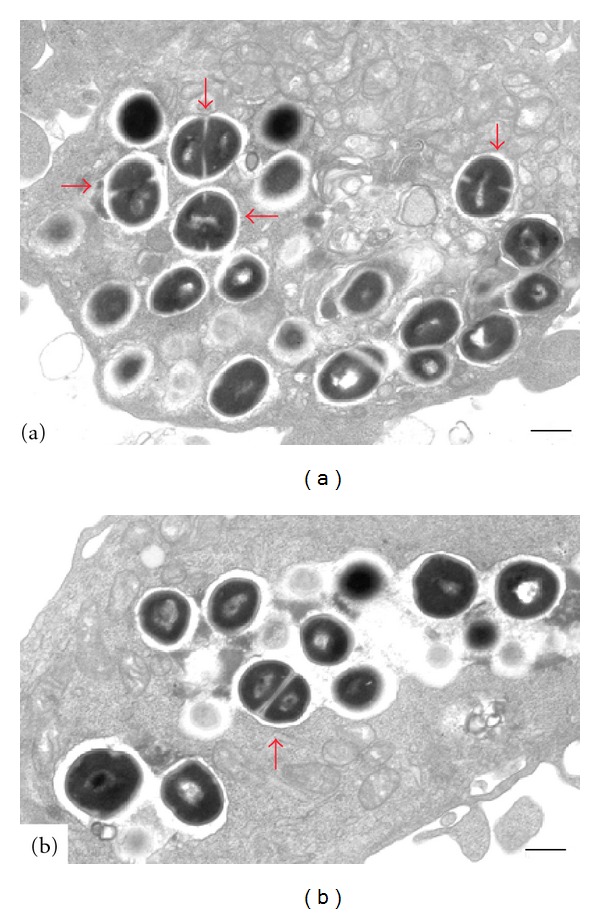
Electron microscopy of S. aureus USA300 infected GFP-WIPI-1 expressing U2OS cells. GFP-WIPI-1 U2OS cells were infected with S. aureus USA300 in DMEM/FCS followed by conventional electron microscopy. Either single S. aureus USA300 cells were found to reside within a vesicle (a), or multiple cells were found in enlarged vesicles (b). Red arrows indicate dividing Staphylococci. Scale bars: 500 nm.
4. Discussion
Autophagy is considered an ancient eukaryotic pathway for cellular self-digestion that evolved with the endomembrane system [25]. As the endomembrane system provided an opportunity for invading pathogens to manipulate the host cell, it is further considered that the autophagic response to pathogen invasion may have also evolved as an early host defense program of eukaryotic cells [25, 26]. Interestingly enough, this hypothesis explains that (i) autophagy is in part a stochastic degradation pathway to clear the cytoplasm, thereby securing the functionality of both proteins and the endomembrane system, but is also (ii) a specific response triggered by certain stress exposures, such as pathogen invasion. In fact, the autophagic response to pathogen invasion has been identified because autophagy-related proteins (ATG) essential to the stochastic process of autophagy, such as Atg5 and LC3, have also been found to decorate membranes harboring intracellular pathogens and to be functionally involved in the cellular response to pathogens [4, 27]. Still, molecular mechanisms of autophagic responses to pathogen exposure are insufficiently understood.
Bacterial pathogens employ a variety of mechanisms to manipulate host cell membranes [28, 29]. Commonly, many bacteria interfere with the phosphoinositide metabolism that is often targeted by bacterial virulence factors [30]. Among the phosphoinositides, PtdIns(3)P is the essential variant for the forming autophagosomal membrane, hence it can be anticipated that PtdIns(3)P might commonly interconnect bacterial infection with the autophagic pathway. In fact, it has been shown that PtdIns(3)P is involved in the formation of Salmonella-containing vacuoles serving as a niche in host cells, and that PtdIns(3)P is targeted by M. tuberculosis to inhibit phagosome maturation [31]. Here, we addressed this question by investigating the process of S. aureus invasion of tumor cells.
A study by Schnaith and coworkers suggested a model that connected the autophagic response with S. aureus infection via the bacterial agr-virulence factor [14]. In this model, late phagosomes with (i) agr-positive S. aureus become entrapped in autophagosome-like vesicles, where S. aureus replicate and subsequently escape into the cytoplasm to promote host cell death, but (ii) agr-deficient S. aureus are subjected to lysosomal degradation [14].
We here provide evidence, that exposure of nonprofessional host cells (tumor cells) to Staphylococci stimulates the canonical WIPI-1 response at the onset of autophagy, which is to bind to PtdIns(3)P at the phagophore to foster the recruitment of downstream ATGs, such as Atg5 and LC3 [9, 32]. Interestingly, this response is attributable to the interaction of Staphylococci with the host cell membrane, as we found WIPI-1 to become stimulated upon both noninvasive and invasive Staphylococci. In line, WIPI-1 was also stimulated upon peptidoglycan treatment (data not shown). By further analyzing invasive S. aureus strains in this study, we identified new WIPI-1 positive autophagosome-like vesicles that entrapped multiple S. aureus particles. And, moreover, agr-positive S. aureus strains were more efficiently entrapped when compared to agr-deficient S. aureus cells. Our results demonstrate that WIPI-1, a principal PtdIns(3)P effector at the onset of stochastic, canonical autophagy, is also involved in selective engagement of the autophagic pathway, moreover underscored by the notion that Staphylococci prominently stimulated WIPI-1 in nutrient-rich conditions. And, our results demonstrate that S. aureus (i) stimulates autophagy and (ii) in addition, becomes entrapped in WIPI-1 positive autophagosome-like vesicles.
The most compelling explanation would be that WIPI-1 becomes stimulated upon S. aureus interaction with the plasma membrane, subsequently WIPI-1 positive phagophore membranes, for example, originated from the endoplasmic reticulum, are utilized to sequester S. aureus where bacterial replication occurs. In addition, we also found S. aureus particles sequestered in phagosomes, marked by the FYVE domain [33], which are intended for phagocytosis. Hence our results can be viewed as host cell response to S. aureus, critically involving PtdIns(3)P membranes that either serve as phagosome membranes, or that are utilized to further sequester S. aureus, thereby generating a replication niche. Evidence that bacterial replication occurs is given by our electron microscopy analysis showing dividing S. aureus cells within the sequestering vesicle. The importance of PtdIns(3)P-enriched membranes during sequestration of invading S. aureus is further emphasized by our finding that more WIPI-1 positive autophagosome-like vesicles entrap S. aureus cells when phosphorylation of PtdIns(3)P to PtdIns(3,5)P2 by PIKfyve was specifically blocked.
PtdIns(3)P-enriched membranes promote vesicle fusion with lysosomes. In line, FYVE domain marked phagosomes that carry S. aureus would be subjected to phagocytosis as suggested [14]. If WIPI-1 positive autophagosome-like vesicles entrapping S. aureus identified in this study would reflect cytoplasmic sequestration of invaded S. aureus with PtdIns(3)P-enriched WIPI-1 positive phagophores, the resulting autophagosome-like vesicles should become subjected to fusion with the lysosomal compartment, because they are enriched in PtdIns(3)P. But it was shown that lysosomal fusion is blocked upon S. aureus invasion [14]. To address this question we employed bafilomycin A1 to inhibit the functionality of the lysosomal compartment. Clearly, lysosomal inhibition significantly increased the number of WIPI-1 positive autophagosome-like vesicles harboring agr-positive Staphylococci. This demonstrates that nonprofessional host cells employ autophagy as a defense response with regards to S. aureus infection, in line with previous suggestions [34]. However, under some circumstances [14] bacterial replication and vesicle escape might override this cellular defense program.
Supplementary Material
Here, we show the appearance of canonical and infection-induced GFP-WIPI-1 positive membranes upon S. aureus HG001 infection after 2h of infection in either DMEM/FCS, DMEM or EBSS medium (Supplementary Figure 1). Further, Staphylococci (S. aureus USA300, S. aureus HG001, S. aureus SA113, S. carnosus TM300) infected cells upon 2h of infection in DMEM and EBSS medium are shown (Supplementary Figures 2 – 5). In addition, the quantification of the GFP-WIPI-1 puncta per cell in uninfected cells and upon infection with different Staphylococci strains (S. aureus USA300, S. aureus HG001, S. aureus SA113, S. carnosus TM300) over time (30' -2h) is presented (Supplementary Figure 6). Finally, the bacterial load of S. aureus USA300 infected cells upon lysosomal and /or PIKfyve inhibition is presented (Supplementary Figure 7).
Acknowledgments
The authors kindly thank Marianne Opalka for technical assistance. This work was supported by grants from the Federal Ministry for Education and Science (BMBF, BioProfile) and the German Research Society (DFG, SFB 773) to TP-C.
References
- 1.Yang Z, Klionsky DJ. Eaten alive: a history of macroautophagy. Nature Cell Biology. 2010;12(9):814–822. doi: 10.1038/ncb0910-814. [DOI] [PMC free article] [PubMed] [Google Scholar]
- 2.Yang Z, Klionsky DJ. Mammalian autophagy: core molecular machinery and signaling regulation. Current Opinion in Cell Biology. 2010;22(2):124–131. doi: 10.1016/j.ceb.2009.11.014. [DOI] [PMC free article] [PubMed] [Google Scholar]
- 3.Kim J, Kundu M, Viollet B, Guan KL. AMPK and mTOR regulate autophagy through direct phosphorylation of Ulk1. Nature Cell Biology. 2011;13(2):132–141. doi: 10.1038/ncb2152. [DOI] [PMC free article] [PubMed] [Google Scholar]
- 4.Van Der Vaart A, Mari M, Reggiori F. A picky eater: exploring the mechanisms of selective autophagy in human pathologies. Traffic. 2008;9(3):281–289. doi: 10.1111/j.1600-0854.2007.00674.x. [DOI] [PubMed] [Google Scholar]
- 5.Mizushima N, Levine B, Cuervo AM, Klionsky DJ. Autophagy fights disease through cellular self-digestion. Nature. 2008;451(7182):1069–1075. doi: 10.1038/nature06639. [DOI] [PMC free article] [PubMed] [Google Scholar]
- 6.Noda T, Matsunaga K, Yoshimori T. Atg14L recruits PtdIns 3-kinase to the ER for autophagosome formation. Autophagy. 2011;7(4):438–439. doi: 10.4161/auto.7.4.14679. [DOI] [PubMed] [Google Scholar]
- 7.Proikas-Cezanne T, Codogno P. Beclin 1 or not Beclin 1. Autophagy. 2011;7(7):671–672. doi: 10.4161/auto.7.7.14877. [DOI] [PubMed] [Google Scholar]
- 8.Proikas-Cezanne T, Waddell S, Gaugel A, Frickey T, Lupas A, Nordheim A. WIPI-1α (WIPI49), a member of the novel 7-bladed WIPI protein family, is aberrantly expressed in human cancer and is linked to starvation-induced autophagy. Oncogene. 2004;23(58):9314–9325. doi: 10.1038/sj.onc.1208331. [DOI] [PubMed] [Google Scholar]
- 9.Mauthe M, Jacob A, Freiberger S, et al. Resveratrol-mediated autophagy requires WIPI-1 regulated LC3 lipidation in the absence of induced phagophore formation. Autophagy. 2011;7(12):1448–1461. doi: 10.4161/auto.7.12.17802. [DOI] [PMC free article] [PubMed] [Google Scholar]
- 10.Proikas-Cezanne T, Robenek H. Freeze-fracture replica immunolabelling reveals human WIPI-1 and WIPI-2 as membrane proteins of autophagosomes. Journal of Cellular and Molecular Medicine. 2011;15( 9):2007–2010. doi: 10.1111/j.1582-4934.2011.01339.x. [DOI] [PMC free article] [PubMed] [Google Scholar]
- 11.Proikas-Cezanne T, Ruckerbauer S, Stierhof YD, Berg C, Nordheim A. Human WIPI-1 puncta-formation: a novel assay to assess mammalian autophagy. FEBS Letters. 2007;581(18):3396–3404. doi: 10.1016/j.febslet.2007.06.040. [DOI] [PubMed] [Google Scholar]
- 12.Levine B, Mizushima N, Virgin HW. Autophagy in immunity and inflammation. Nature. 2011;469(7330):323–335. doi: 10.1038/nature09782. [DOI] [PMC free article] [PubMed] [Google Scholar]
- 13.Fedtke I, Götz F, Peschel A. Bacterial evasion of innate host defenses—the Staphylococcus aureus lesson. International Journal of Medical Microbiology. 2004;294(2-3):189–194. doi: 10.1016/j.ijmm.2004.06.016. [DOI] [PubMed] [Google Scholar]
- 14.Schnaith A, Kashkar H, Leggio SA, Addicks K, Krönke M, Krut O. Staphylococcus aureus subvert autophagy for induction of caspase-independent host cell death. Journal of Biological Chemistry. 2007;282(4):2695–2706. doi: 10.1074/jbc.M609784200. [DOI] [PubMed] [Google Scholar]
- 15.Pfisterer SG, Mauthe M, Codogno P, et al. Ca2+/calmodulin-dependent kinase signaling via CaMKI and AMPK contributes to the regulation of WIPI-1 at the onset of autophagy. Molecular Pharmacology. 2011;80(6):1066–1075. doi: 10.1124/mol.111.071761. [DOI] [PubMed] [Google Scholar]
- 16.McDougal LK, Steward CD, Killgore GE, Chaitram JM, McAllister SK, Tenover FC. Pulsed-field gel electrophoresis typing of oxacillin-resistant Staphylococcus aureus isolates from the United States: establishing a national database. Journal of Clinical Microbiology. 2003;41(11):5113–5120. doi: 10.1128/JCM.41.11.5113-5120.2003. [DOI] [PMC free article] [PubMed] [Google Scholar]
- 17.Herbert S, Ziebandt AK, Ohlsen K, et al. Repair of global regulators in Staphylococcus aureus 8325 and comparative analysis with other clinical isolates. Infection and Immunity. 2010;78(6):2877–2889. doi: 10.1128/IAI.00088-10. [DOI] [PMC free article] [PubMed] [Google Scholar]
- 18.Iordanescu S, Surdeanu M. Two restrictions and modification systems in Staphylococcus aureus NCTC8325. Journal of General Microbiology. 1976;96(2):277–281. doi: 10.1099/00221287-96-2-277. [DOI] [PubMed] [Google Scholar]
- 19.Rosenstein R, Nerz C, Biswas L, et al. Genome analysis of the meat starter culture bacterium Staphylococcus carnosus TM300. Applied and Environmental Microbiology. 2009;75(3):811–822. doi: 10.1128/AEM.01982-08. [DOI] [PMC free article] [PubMed] [Google Scholar]
- 20.Grotemeier A, Alers S, Pfisterer SG, et al. AMPK-independent induction of autophagy by cytosolic Ca2+ increase. Cellular Signalling. 2010;22(6):914–925. doi: 10.1016/j.cellsig.2010.01.015. [DOI] [PubMed] [Google Scholar]
- 21.Rosenstein R, Götz F. Genomic differences between the food-grade Staphylococcus carnosus and pathogenic staphylococcal species. International Journal of Medical Microbiology. 2010;300(2-3):104–108. doi: 10.1016/j.ijmm.2009.08.014. [DOI] [PubMed] [Google Scholar]
- 22.Proikas-Cezanne T, Pfisterer SG. Assessing mammalian autophagy by WIPI-1/Atg18 puncta formation. Methods in Enzymology. 2009;452:247–260. doi: 10.1016/S0076-6879(08)03616-1. [DOI] [PubMed] [Google Scholar]
- 23.Robenek H, Robenek MJ, Buers I, et al. Lipid droplets gain PAT family proteins by interaction with specialized plasma membrane domains. Journal of Biological Chemistry. 2005;280(28):26330–26338. doi: 10.1074/jbc.M413312200. [DOI] [PubMed] [Google Scholar]
- 24.Jefferies HBJ, Cooke FT, Jat P, et al. A selective PIKfyve inhibitor blocks PtdIns(3,5)P(2) production and disrupts endomembrane transport and retroviral budding. EMBO Reports. 2008;9(2):164–170. doi: 10.1038/sj.embor.7401155. [DOI] [PMC free article] [PubMed] [Google Scholar]
- 25.Levine B. Eating oneself and uninvited guests: autophagy-related pathways in cellular defense. Cell. 2005;120(2):159–162. doi: 10.1016/j.cell.2005.01.005. [DOI] [PubMed] [Google Scholar]
- 26.Sumpter R, Jr., Levine B. Autophagy and innate immunity: triggering, targeting and tuning. Seminars in Cell and Developmental Biology. 2010;21(7):699–711. doi: 10.1016/j.semcdb.2010.04.003. [DOI] [PMC free article] [PubMed] [Google Scholar]
- 27.Lerena MC, Vázquez CL, Colombo MI. Bacterial pathogens and the autophagic response. Cellular Microbiology. 2010;12(1):10–18. doi: 10.1111/j.1462-5822.2009.01403.x. [DOI] [PubMed] [Google Scholar]
- 28.Shahnazari S, Brumell JH. Mechanisms and consequences of bacterial targeting by the autophagy pathway. Current Opinion in Microbiology. 2011;14(1):68–75. doi: 10.1016/j.mib.2010.11.001. [DOI] [PubMed] [Google Scholar]
- 29.Ham H, Sreelatha A, Orth K. Manipulation of host membranes by bacterial effectors. Nature Reviews Microbiology. 2011;9(9):635–646. doi: 10.1038/nrmicro2602. [DOI] [PubMed] [Google Scholar]
- 30.Pizarro-Cerdá J, Cossart P. Subversion of phosphoinositide metabolism by intracellular bacterial pathogens. Nature Cell Biology. 2004;6(11):1026–1033. doi: 10.1038/ncb1104-1026. [DOI] [PubMed] [Google Scholar]
- 31.Noda T, Yoshimori T. Molecular basis of canonical and bactericidal autophagy. International Immunology. 2009;21(11):1199–1204. doi: 10.1093/intimm/dxp088. [DOI] [PubMed] [Google Scholar]
- 32.Itakura E, Mizushima N. Characterization of autophagosome formation site by a hierarchical analysis of mammalian Atg proteins. Autophagy. 2010;6(6):764–776. doi: 10.4161/auto.6.6.12709. [DOI] [PMC free article] [PubMed] [Google Scholar]
- 33.Gaullier JM, Simonsen A, D’Arrigo A, Bremnes B, Stenmark H, Aasland R. FYVE fingers bind PtdIns(3)P. Nature. 1998;394(6692):432–433. doi: 10.1038/28767. [DOI] [PubMed] [Google Scholar]
- 34.Kageyama S, Omori H, Saitoh T, et al. The LC3 recruitment mechanism is separate from Atg9L1-dependent membrane formation in the autophagic response against Salmonella. Molecular Biology of the Cell. 2011;22(13):2290–2300. doi: 10.1091/mbc.E10-11-0893. [DOI] [PMC free article] [PubMed] [Google Scholar]
Associated Data
This section collects any data citations, data availability statements, or supplementary materials included in this article.
Supplementary Materials
Here, we show the appearance of canonical and infection-induced GFP-WIPI-1 positive membranes upon S. aureus HG001 infection after 2h of infection in either DMEM/FCS, DMEM or EBSS medium (Supplementary Figure 1). Further, Staphylococci (S. aureus USA300, S. aureus HG001, S. aureus SA113, S. carnosus TM300) infected cells upon 2h of infection in DMEM and EBSS medium are shown (Supplementary Figures 2 – 5). In addition, the quantification of the GFP-WIPI-1 puncta per cell in uninfected cells and upon infection with different Staphylococci strains (S. aureus USA300, S. aureus HG001, S. aureus SA113, S. carnosus TM300) over time (30' -2h) is presented (Supplementary Figure 6). Finally, the bacterial load of S. aureus USA300 infected cells upon lysosomal and /or PIKfyve inhibition is presented (Supplementary Figure 7).


