Abstract
Instruments have been developed that measure consumer evaluations of primary healthcare using different approaches, formats and questions to measure similar attributes. In 2004 we concurrently administered six validated instruments to adults and conducted discussion groups to explore how well the instruments allowed patients to express their healthcare experience and to get their feedback about questions and formats.
Method:
We held 13 discussion groups (n=110 participants): nine in metropolitan, rural and remote areas of Quebec; four in metropolitan and rural Nova Scotia. Participants noted critical incidents in their healthcare experience over the previous year, then responded to all six instruments under direct observation and finally participated in guided discussions for 30 to 40 minutes. The instruments were: the Primary Care Assessment Survey; the Primary Care Assessment Tool; the Components of Primary Care Index; the EUROPEP; the Interpersonal Processes of Care Survey; and part of the Veterans Affairs National Outpatient Customer Satisfaction Survey. Two team members analyzed discussion transcripts for content.
Results:
While respondents appreciated consistency in response options, they preferred options that vary to fit the question. Likert response scales functioned best; agreement scales were least appreciated. Questions that average experience over various providers or over many events diluted the capacity to detect critical negative or positive incidents. Respondents tried to answer all questions but stressed that they were not able to report accurately on elements outside their direct experience or in the provider's world. They liked short questions and instruments, except where these compromise clarity or result in crowded formatting. All the instruments were limited in their capacity to report on the interface with other levels of care.
Conclusion:
Each instrument has strengths and weaknesses and could be marginally improved, but respondents accurately detected their intent and use. Their feedback offers insight for instrument development.
Abstract
Des instruments ont été conçus pour mesurer l'évaluation des soins de santé primaires par les patients, et ce, par diverses démarches, formats et questions qui mesurent des caractéristiques similaires. En 2004, nous avons administré simultanément à des adultes six instruments validés et avons méne des groupes de discussion pour voir, d'une part, à quel point ces instruments permettent aux patients d'exprimer leur expérience de soins et pour obtenir, d'autre part, leurs commentaires sur les questions et les formats.
Méthodologie :
Nous avons organisé 13 groupes de discussion (n=110 participants) : neuf dans des régions métropolitaines, rurales et éloignées du Québec; quatre dans des régions métropolitaines et rurales de la Nouvelle-Écosse. Les participants ont noté des incidents critiques dans le cadre de leur expérience de soins au cours de l'année précédente, puis ont répondu aux six instruments sous observation directe, et finalement ont participé à des échanges dirigés de 30 à 40 minutes. Les instruments suivants ont été utilisés : Primary Care Assessment Survey; Primary Care Assessment Tool; Components of Primary Care Index; EUROPEP; Interpersonal Processes of Care Survey; et une partie du Veterans Affairs National Outpatient Customer Satisfaction Survey. Deux membres de l'équipe ont analysé le contenu des transcriptions des discussions.
Résultats :
Bien que les répondants apprécient la constance dans les choix de réponses offerts, ils préfèrent les choix qui varient de façon à s'ajuster aux questions. Les échelles de réponse de type Likert fonctionnent le mieux; les « échelles d'accord » sont les moins appréciées. Les questions qui tracent une moyenne de l'expérience pour plusieurs fournisseurs de services ou pour plusieurs événements diluent la capacité de détecter des incidents critiques négatifs ou positifs. Les répondants ont tenté de répondre à toutes les questions, mais ont indiqué qu'ils étaient incapables de rapporter avec précision les éléments externes à leur expérience directe ou ceux qui faisaient partie de l'univers du fournisseur de soins. Ils ont apprécié les questions courtes et les instruments courts, à l'exception des cas où un format compact compromettait la clarté. Tous les instruments présentaient des limites en terme de capacité pour faire état de l'interface avec les autres niveaux de soins.
Conclusion :
Tous les instruments présentent des points forts et des points faibles, et pourraient donc être légèrement amélioré, cependant les répondants ont détecté avec précision l'intention et l'emploi de chacun d'eux. Les commentaires des répondants ont donné des pistes pour le développement d'instruments.
In 2004, we concurrently administered six instruments that assess primary healthcare from the patient's perspective to the same group of respondents. We report here on qualitative insights gained from debriefing a subgroup of respondents who responded to the questionnaires in a group setting, then shared their reactions and discussed how well the instruments allowed them to express their primary healthcare experience. In this paper, we describe each instrument briefly and present the reactions that respondents most frequently expressed. Then we present findings that emerge across instruments.
Method
The method, described in detail elsewhere in this special issue of the journal (Haggerty et al. 2011), consisted of administering validated and widely used evaluation instruments to healthcare users in Quebec and Nova Scotia, in French and English, respectively.
The six study instruments compared were (in order of presentation in the questionnaire): (1) the Primary Care Assessment Survey (PCAS); (2) the Primary Care Assessment Tool (PCAT-S, short, adult version); (3) the Components of Primary Care Instrument (CPCI); (4) the EUROPEP-I; (5) the Interpersonal Processes of Care (IPC-II) Survey; and (6) the Veterans Affairs National Outpatient Customer Satisfaction Survey (VANOCSS). We retained only subscales of attributes addressed in more than one instrument. We depicted each instrument as closely as possible to the original version in format, font and instructions to participants.
Thirteen discussion groups were held: three each in metropolitan, rural and remote areas in Quebec and two each in metropolitan and rural areas of Nova Scotia. Participants first had a few minutes to make notes about their most important healthcare experience over the previous year, then they responded to the instruments while their reactions and time were directly observed. They then participated in a recorded, guided group discussion lasting 30 to 40 minutes. The discussion guide, the same for all groups, asked which instruments were most and least liked, and which questions were confusing or difficult and how well the questions allowed them to express the essence of their initial critical incidents. The group facilitators made briefing notes, and recordings were transcribed and analyzed independently for content by two members of the research team who did not participate in the discussions (MF, JH). Issues raised in most group discussions were retained as important.
Results
In total, 110 subjects participated in 13 focus groups (average, nine per group); 64.6% were female, average age was 49.7 (SD: 12.8) years and 67% had a post-secondary education. Overall experience of care was excellent for 49%, average for 38% and poor for 13%, as assessed by the question: “In general, would you say that the care you receive at your regular clinic is excellent, average or poor?”
Description and reaction by instrument
Here, each instrument is described, followed by a synopsis of respondents' reactions. The figures depict a salient sample of items from each instrument showing the formatting actually used.
1. Primary Care Assessment Survey (PCAS)
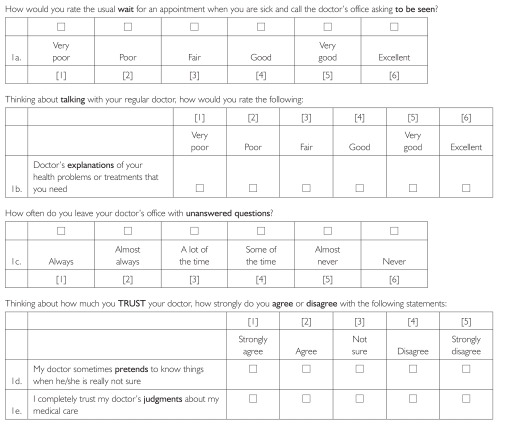
The PCAS (Safran et al. 1998) (Figure 1) was developed by Dana Safran to measure the achievement of the Institute of Medicine's definition of primary care: “the provision of integrated, accessible healthcare services by clinicians who are accountable for addressing a large majority of personal healthcare needs, developing a sustained partnership with patients, and practicing in the context of family and community.” The instrument applies only to respondents with a “regular personal doctor,” and asks respondents to judge or rate the acceptability of different aspects of care. It has a large, easy-to-read font; readability is at grade 4 level. The Likert scale labels change by question context, as does item presentation.
FIGURE 1.
Primary Care Assessment Survey: Sample items from different subscales demonstrating the structure of Likert-type ratings on a 6-point scale
This instrument was most consistently preferred by respondents. It is easy to read, and the adaptation of response scale options to the nature of the questions adds variety to the questionnaire – “made me more alert to answering” [NS] – without feeling “tricky.” However, participants did find the Trust subscale questions irrelevant or requiring too much guessing (item 1d).
2. Primary Care Assessment Tool (PCAT)
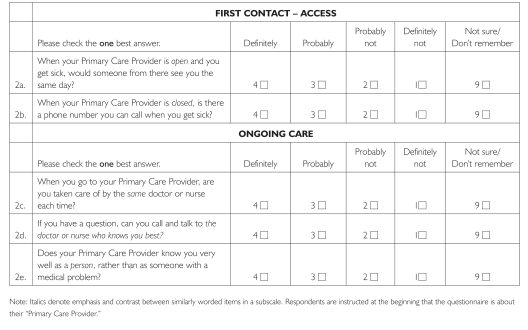
The PCAT (Figure 2) was developed by Barbara Starfield and colleagues (1998; Cassady et al. 2000) to assess the extent to which care is consistent with four unique and three essential attributes of primary care. Initially a paediatric tool, it was adapted and validated for adult care (Shi et al. 2001) and is available in short form (PCAT-S). The items refer to the “Primary Care Provider,” and respondents (and evaluators) are guided to identify this as the regular source of care and/or provider who knows the patient best and/or takes responsibility for most care (Strength of Affiliation scale). It has been translated into several languages.
FIGURE 2.
Primary Care Assessment Tool: Sample items from two subscales showing a 4-point Likert response scale with the same option labels for all items
“Primary care provider” is used to refer to both a person and a site. Translating this phrase into French proved too confusing in our cognitive tests, so the French version differentiated “usual doctor” (referring to a healthcare professional) and “clinic” (for site), depending on the context of the question, to achieve appropriate subject–verb agreement. However, even English-language respondents found this term confusing. One wondered “how my doctor could be open or closed” [NS, rural] (e.g., items 2a and 2b). Many found the font too small and the matrix formatting difficult to follow, but various focus groups felt this instrument covered more ground or delved deeper than others.
The response scale elicits probability of occurrence. Some questions are posed hypothetically (e.g., Figure 2, item a), whereas others relate to frequency of occurrence (e.g., Figure 2, item c). The probability response options for questions eliciting frequency were particularly problematic in French, where poor syntax concordance created confusion (e.g., Figure 2, item c). The two extremes of response options were clear – “definitely not” means no or never, “definitely” means yes or always – but the intermediate options were neither clear nor equivalent among respondents.
Looking at my answers again, I realize that I answered those in a speculative way, which is not an accurate experience. So I think the word “probably” is more of a speculative nature, and perhaps that should be changed. [NS1, rural]
For me, “probably,” “probably not” and “not sure” all mean the same thing. [QC, remote]
Most problematic for evaluators is the “not sure/don't remember” response option. Although respondents appreciate having this option rather than having to guess, it counts as a missing value in analysis and leads to information loss. For unusual scenarios, such as having a phone number to call when the office is closed (Figure 2, item b), a large proportion of respondents endorsed this response.
3. Components of Primary Care Instrument (CPCI)
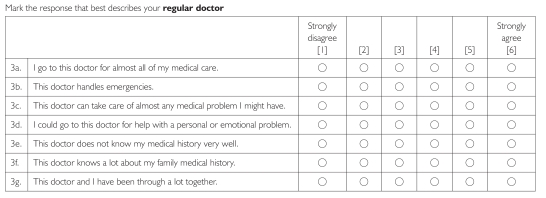
The 20-item CPCI (Flocke 1997) (Figure 3) was developed based on direct observations of care processes in 138 primary healthcare clinics. Although items are grouped approximately within constructs, no grouping is identifiable in the instrument formatting. It uses a disagree/agree semantic differential response scale with “strongly agree/disagree” labels attached only to the opposite extremes of a set of six categories.
FIGURE 3.
Components of Primary Care Instrument: Sample items demonstrating a 6-point semantic differential response scale of the reporting type, with occasional reverse wording
Respondents appreciated this instrument's brevity and simple language, but its format was the least liked. Brevity is achieved at the expense of a cramped format, and respondents had difficulty linking statements to the correct response line. Many were observed physically tracking the statements to the response scale. Reverse-worded items were seen as “tricky” (item 3e).
Respondents did not like the semantic differential response scale as much as the Likert scales of other instruments, and they did not like responding to frequency statements with an agree/disagree response (item 3a). Combined with the crowded formatting, they tended to endorse extreme responses rather than use the full response scale. This produced significant halo effects. For instance, many respondents strongly agreed with both positively and negatively worded items in the same construct (e.g., item 3e and 3f).
4. EUROPEP
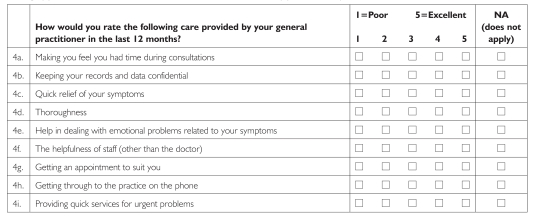
The EUROPEP (Figure 4) was developed by Richard Grol and colleagues (2000) to compare the performance of general practice in different European countries and to incorporate patient perspectives in care improvement initiatives. The 23-item instrument uses a rating approach to assess (1) Clinical Behaviour, which includes interpersonal communication and technical aspects of care and (2) Organization of Care, which principally addresses issues around accessing care. The instrument has been translated into 15 languages.
FIGURE 4.
EUROPEP: Sample items demonstrating 5-point semantic differential response scale of the rating type that is the same for all items, with a “not applicable” option
The EUROPEP uses a semantic differential response scale (“poor” and “excellent” on a five-point scale). Like the PCAT-S, the EUROPEP offered a “not applicable” response option. It is short with clear formatting, which respondents found easy to read and to answer. Some item statements may be too short (e.g., item 4d, “Thoroughness”), with non-equivalent interpretations among respondents.
It was very quick and easy to fill out. But I'm not sure that it really describes my experience with my doctor. [NS, rural]
5. Interpersonal Processes of Care (IPC)
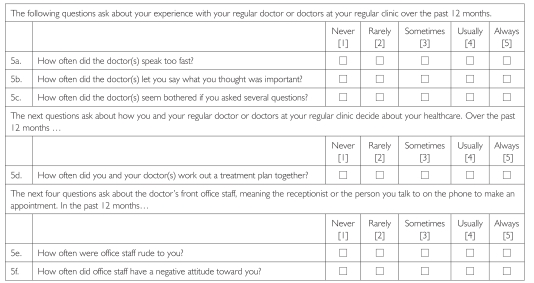
The IPC (Figure 5) was developed by Anita Stewart and colleagues (1999) to measure interpersonal aspects of quality of care as a complement to technical components. The 45-item instrument was designed to be particularly sensitive to issues of equity and discrimination against patients with limited language proficiency or capacity to advocate strongly in their own care. It has been mostly administered by telephone, so typeface and formatting were discretionary. The questions use a frequency of response scale for “How often did doctors…” – referring to care received from all doctors, not only those in primary care. The items are regularly separated by phrases that frame the next set of questions.
FIGURE 5.
Interpersonal Processes of Care: Sample items demonstrating that the 5-point Likert response scale of the reporting type using a frequency scale is the same for all options (format used was discretionary)
One strength of this instrument is that it includes a separate subscale for assessing office staff behaviour (e.g., items 5e and 5f), whereas others such as the EUROPEP (Figure 4, item f) embed the question among items about the doctor or clinic. Patients often have clearly differentiated experiences between staff and doctors.
The staff has a great impact on your entire experience. If the receptionist is not someone you feel you can approach, you feel blocked from your Doctor. [NS, rural]
Respondents found the content of the questions highly relevant to critical incidents in their healthcare experience. The major difficulty with this instrument was the frequency response scale, which applied to all providers and all visits, diminishing the importance of individual, negative incidents. The vast majority of respondents selected the two most positive categories of experience. It may be more informative to score dichotomously (see VANOCSS, below), whereby any category other than “always” for positive events or “never” for negative events would be interpreted as a problem.
6. Veterans Affairs National Outpatient Customer Satisfaction Survey (VANOCSS)
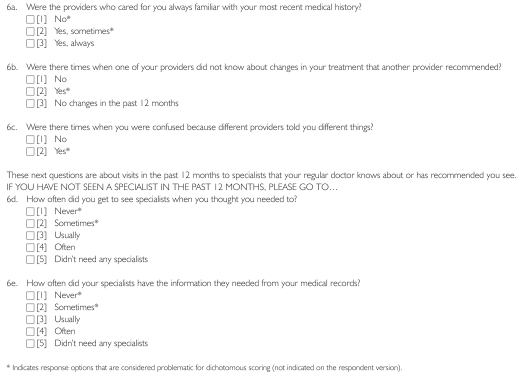
The VANOCSS (Borowsky et al. 2002) (Figure 6) is based on the Picker–Commonwealth Fund approach to performance assessment (Gerteis et al. 1993). Most items pertain to the last visit, and were therefore excluded from our study; we retained only the usual-care subscales of Overall Coordination and Specialist Access. The instrument elicits the frequency of critical incidents but applies a binary scoring to each item to detect problems. Because the occurrence of at least one problem is considered problematic, this instrument is very sensitive to negative experiences.
FIGURE 6.
Veterans Affairs Outpatient Customer Satisfaction Survey (VANOCSS): Sample of items demonstrating a response scale that varies across items
Because the instrument applies only to those who had seen providers other than the regular doctor, we placed it last in the questionnaire. Not all respondents answered it, and we obtained little qualitative information. However, it addresses whole-system issues that respondents identified as important.
Response formats
Among the various instruments and response scale formats, respondents consistently preferred Likert response scales, sans serif fonts in large sizes, squares as opposed to circles for responses, questions that were grouped under headings, and varying response scales and formats throughout the questionnaire. They found matrix formatting (e.g., PCAT-S and some PCAS) difficult. Respondents appreciated being able to indicate that an item was not applicable or that they did not know, as in the PCAT-S and EUROPEP. Several expressed confusion about scoring information indicated in response options (e.g., “Always 5”).
Bad questions
When asked about questions they did not like, respondents consistently stated they did not like assessing processes occurring in the provider's mind or that they did not directly observe or experience. Almost all questionnaires contained such questions. For example, the PCAS Trust subscale asked about the doctor pretending to “know things” (Figure 1, item d), and the EUROPEP asked about the confidential treatment of the medical record (Figure 4, item b). Respondents gave the benefit of the doubt and recognized that their best guess would not be an accurate assessment.
One respondent said: “There aren't many people who know what their doctor [knows] … do you all know what your doctor thinks?” Another respondent stated: “Probably not.” [QC, urban]
Items about the depth of the physician–patient relationship provoked divergent and strong reactions. Some participants had few expectations that the physician would know anything beyond their medical history; others attested to the importance of whole-person knowledge in appropriate care:
They ask questions that don't make any sense: “this doctor and I have been through a lot together,” “I could consult this doctor for a personal or emotional problem.” Come on. You're not close to your doctor, to consult for a personal problem. You go … to see the doctor. [QC, rural]
I find the more your doctor knows you and your particulars, the better he's going to be able to adjust things. [NS, urban]
Likewise, despite the importance of respectfulness in defining respondents' experience, the notion of equality was problematic. One item in particular evoked comment from several groups: “How often did doctors treat you as an equal?” (IPC)
I want [a professional doctor–patient relationship], I don't want to be treated as an equal, I don't want him to talk to me like I'm an equal because I don't understand – I want him to talk to me in plain language but to talk to me with respect and caring and understanding. [NS, rural]
Missing pieces across instruments
Most respondents said the instruments elicited general aspects of their healthcare experience that they considered important. Several groups felt 12 months was too short a reference because it encompassed only one or two visits, whereas their experience was informed by a longer period.
Some missing pieces related to reporting on the system as a whole and others to the regular physician. Respondents consistently expressed frustration at being limited to evaluating their regular doctor because many of the most important critical incidents occur at other levels of the system or outside the clinical encounter. They wanted more questions on delays for access to tests and specialists and elicitation of technical mistakes.
Respondents clearly welcomed an opportunity to give anonymous feedback, and they expected this information to go directly to their physician. They also wanted to communicate to their physicians their desire for more input into decision-making regarding choices of specialist or treatment options.
Respectfulness is critical to patients, but respondents felt there were not enough questions addressing aspects of respectfulness such as respecting the appointment time, responding to voicemail messages, recognizing personal worth and provision of privacy and confidentiality by office staff. Respondents wanted more questions about the physical set-up of the waiting room (privacy, toys for children), cleanliness of the bathroom or the clinic in general and wheelchair accessibility.
Discussion and Conclusion
Every instrument has features that respondents appreciated: the readability of the PCAS; the PCAT-S's comprehensiveness and “don't know” response option (although problematic analytically); the CPCI's clear language; the EUROPEP's conciseness; the IPC's focus on respectfulness; and the VANOCSS's whole-system perspective. The PCAS was considered the most readable and applicable overall, although its placement as first in the questionnaire may have affected this perception. All instruments include questions that patients found difficult to evaluate: things not directly observed or occurring in the provider's mind. Patients can accurately report critical incidents, such as breaches in confidentiality or trust, but if they do not do so, it does not mean these incidents have not occurred. Offering a “don't know” option gives patients more options but results in missing values for analysis. Each instrument has its strength, but this study also provides pointers for continued refinement.
Our results reinforce recommended good practice about questionnaire formatting such as large typeface, instructions placed close to responses, presenting questions together by thematic grouping and minimizing response format changes between sections (Dillman 2007). Additionally, we recommend removing numeric scoring information from response options, using matrix formatting sparingly and using sans serif fonts.
Respondents not only tolerated variation in response scales but appreciated variety. The PCAS is exemplary in this regard; the response scale changes across dimensions while remaining consistent within a block of questions, facilitating the response task. Likewise, validity may be compromised by using a graded response scale for occurrences that are rare, when a binary (yes/no) option would be better. The VANOCSS offers an interesting combination of graded reporting of events with binary scoring, an approach that may be relevant for instruments with highly skewed responses.
Finally, respondents affirmed the importance they accord to evaluating healthcare services and their expectation that this information be used to communicate suggestions for improvement anonymously and clearly to their providers. They desire to be “good respondents” and will respond to questions even when they are not sure of the answer or of what the question means.
The information in this study can be used to ensure that evaluators and clinicians select instruments that not only demonstrate acceptable psychometric properties, but are also well accepted by patients.
Acknowledgements
This research was funded by the Canadian Institute for Health Research (CIHR). The authors wish to thank Donna Riley for support in preparation and editing of the manuscript.
Citations are from Nova Scotia [NS] or Quebec [QC]; Quebec citations have been translated from French.
Contributor Information
Jeannie L. Haggerty, Department of Family Medicine, McGill University, Montreal, QC
Christine Beaulieu, St.Mary's Research Centre, St.Mary's Hospital Center, Montreal, QC.
Beverly Lawson, Department of Family Medicine, Dalhousie University, Halifax, NS.
Darcy A. Santor, School of Psychology, University of Ottawa, Ottawa, ON
Martine Fournier, Centre de recherche CHU Sainte-Justine, Montreal, QC.
Frederick Burge, Department of Family Medicine, Dalhousie University, Halifax, NS.
References
- Borowsky S.J., Nelson D.B., Fortney J.C., Hedeen A.N., Bradley J.L., Chapko M.K. 2002. “VA Community-Based Outpatient Clinics: Performance Measures Based on Patient Perceptions of Care.” Medical Care 40: 578–86 [DOI] [PubMed] [Google Scholar]
- Cassady C.E., Starfield B., Hurtado M.P., Berk R.A., Nanda J.P., Friedenberg L.A. 2000. “Measuring Consumer Experiences with Primary Care.” Pediatrics 105(4): 998–1003 [PubMed] [Google Scholar]
- Dillman D.A. 2007. Mail and Internet Surveys: The Tailored Design Method (2nd ed). Hoboken, NJ: John Wiley & Sons [Google Scholar]
- Flocke S. 1997. “Measuring Attributes of Primary Care: Development of a New Instrument.” Journal of Family Practice 45(1): 64–74 [PubMed] [Google Scholar]
- Gerteis M., Edgman-Levitan S., Daley J., Delbanco T.L. 1993. Through the Patient's Eyes: Understanding and Promoting Patient-Centered Care. San Francisco: Jossey-Bass [Google Scholar]
- Grol R., Wensing M.Task Force on Patient Evaluations of General Practice 2000. Patients Evaluate General/Family Practice: The EUROPEP Instrument. Nijmegen, Netherlands: Centre for Research on Quality in Family Practice, University of Nijmegen [Google Scholar]
- Haggerty J.L., Burge F., Beaulieu M.-D., Pineault R., Beaulieu C., Lévesque J.-F., et al. 2011. “Validation of Instruments to Evaluate Primary Healthcare from the Patient Perspective: Overview of the Method” Healthcare Policy 7 (Special Issue): 31–46 [PMC free article] [PubMed] [Google Scholar]
- Safran D.G., Kosinski J., Tarlov A.R., Rogers W.H., Taira D.A., Leiberman N., Ware J.E. 1998. “The Primary Care Assessment Survey: Tests of Data Quality and Measurement Performance.” Medical Care 36(5): 728–39 [DOI] [PubMed] [Google Scholar]
- Shi L., Starfield B., Xu J. 2001. “Validating the Adult Primary Care Assessment Tool.” Journal of Family Practice 50(2): 161–71 [Google Scholar]
- Starfield B., Cassady C., Nanda J., Forrest C.B., Berk R. 1998. “Consumer Experiences and Provider Perceptions of the Quality of Primary Care: Implications for Managed Care.” Journal of Family Practice 46: 216–26 [PubMed] [Google Scholar]
- Stewart A.L., Nápoles-Springer A., Pérez-Stable E.J. 1999. “Interpersonal Processes of Care in Diverse Populations.” Milbank Quarterly 77(3): 305–39, 274 [DOI] [PMC free article] [PubMed] [Google Scholar]


