Abstract
The larger fragment of the transmembrane glycoprotein (GP1) and the soluble glycoprotein (sGP) of Ebola virus were expressed in human embryonic kidney cells and the secreted products were purified from the supernatant for carbohydrate analysis. The N-glycans were released with PNGase F from within sodium dodecyl sulphate/polyacrylamide gel electrophoresis (SDS-PAGE) gels. Identification of the glycans was made with normal-phase high-performance liquid chromatography (HPLC), matrix-assisted laser desorption/ionisation mass spectrometry, negative ion electrospray ionisation fragmentation mass spectrometry and exoglycosidase digestion. Most glycans were complex bi-, tri-and tetra-antennary compounds with reduced amounts of galactose. No bisected compounds were detected. Triantennary glycans were branched on the 6-antenna; fucose was attached to the core GlcNAc residue. Sialylated glycans were present on sGP but were largely absent from GP1, the larger fragment of the transmembrane glycoprotein. Consistent with this was the generally higher level of processing of carbohydrates found on sGP as evidenced by a higher percentage of galactose and lower levels of high-mannose glycans than were found on GP1. These results confirm and expand previous findings on partial characterisation of the Ebola virus transmembrane glycoprotein. They represent the first detailed data on carbohydrate structures of the Ebola virus sGP.
Matrix-assisted laser desorption/ionisation time-of-flight mass spectrometry (MALDI-TOF MS) has been shown to be an ideal method for producing profiles of N-glycan mixtures with constituent monosaccharide compositions readily discernible from the measured masses.1 However, the fragmentation spectra of the commonly produced [M+Na]+ ions are often difficult to interpret because of the presence on many ions formed by several alternative pathways. For example, glycosidic cleavage ions of composition Hex3HexNAc1 from biantennary glycans (composition Hex5HexNAc4) can be formed by loss of Hex1HexNAc1 from both antennae or by loss of (HexNAc1) from the chitobiose core and Hex2Hex-NAc1 from the 3-antenna.2 Recently, we have used negative ion collision-induced decomposition (CID) spectra to investigate the structure of these compounds and have shown that the spectra are more informative than positive ion spectra because of the presence of abundant cross-ring fragments formed by specific and diagnostic pathways.3–6 These spectra provide much linkage and sequence information although information on the nature of the constituent monosaccharides is not evident. This information must be obtained by techniques such as gas chromatography/mass spectrometry (GC/MS) or by the use of exoglycosidase digestion. The latter, classical, technique, although providing constituent and linkage information, does not provide information on individual antennae of complex glycans; however, this information is readily available from negative ion fragmentation MS emphasising the need to use several methods for analysis of these compounds. Recent applications of these techniques from this laboratory have been concerned with the structural identification of N-glycans released from glycoprotein constituents of various viruses and we report here on the first comprehensive identification of N-glycans attached to glycoproteins from the Ebola virus. Many of the identified compounds were complex glycans that lacked the usual terminal galactose residues giving an opportunity to study the fragmentation of these compounds more fully than has been presented in previous reports.
Ebola virus (EBOV) and the closely related Marburg virus (MARV) are nonsegmented, negative-stranded RNA viruses that constitute the family Filoviridae. Both can cause severe haemorrhagic fever in humans and non-human primates with documented case fatality rates of up to 90% depending on virus species and strains.7 In contrast to the genus Marburgvirus with only one virus species, Lake Victoria marburgvirus, the genus Ebolavirus currently consists of four distinct species: Zaire ebolavirus (ZEBOV; type species); Sudan ebolavirus (SEBOV), Cote d’Ivoire ebolavirus (CIEBOV) and Reston ebolavirus (REBOV).8 A potential new species has recently been identified in the Bundibugyo district of Uganda.9 Since the first description of EBOV in 1976,10–12 approximately 1850 cases with over 1200 deaths have been documented.13 Outbreaks of disease remain sporadic and unpredictable.14 The disease course is rapid and dramatic, and death usually results from hypotensive shock and multiorgan failure only 7–10 days following symptom onset.7,15 Person-to-person transmission mainly occurs via direct contact with infected blood or body fluids and, so far, the use of barrier-nursing techniques have been effective at limiting disease spread during outbreaks.7,16 Despite extensive searches,17–19 the natural reservoir of filoviruses is still not identified but recent studies indicated different fruit bat species as potential reservoir hosts.20–22
The negative-stranded RNA genome of EBOV codes for seven genes,7,23 of which gene 4 encodes the viral glycoprotein GP. However, at least two forms of the viral glycoprotein are synthesised from this gene: a transmembrane 676-residue glycoprotein, GP, that is anchored to the surface of virions and infected cells, and a secreted 364-residue soluble glycoprotein, sGP.24,25 During transport through the cell, the transmembrane GP undergoes proteolytic processing by furin or a furin-like endoprotease into two covalently associated glycoprotein fragments: a membrane-anchored GP2 (26 kDa) and a surface-bound GP1 (150–170 kDa).26,27 GP1 is responsible for viral attachment to host cells, whereas GP2 produces fusion between the viral and host membranes.27–29 Both GP1 and GP2 are glycosylated.30–32 GP2 contains two N-linked glycosylation sites that are conserved for all four EBOV species, while GP1 contains between 10 and 17 N-linked sites depending on the EBOV species. GP1 also contains a C-terminal mucin-like domain that is believed to be heavily O-glycosylated (up to 80 sites31) and exhibits much sequence variability between different EBOV strains/species; it has also been implicated in viral pathogenicity. The viral glycoprotein is also palmitoylated, though this does not appear to be essential for function.26
The soluble glycoprotein, sGP, is N-glycosylated at all six potential sites33,34 and also carries a rare post-translational C-mannosylation.35 The structures of the glycans produced by Vero E6 cell cultures have been studied by MALDI-TOF MS34 but the experiments performed gave only limited information on linkage and proposals as to the attached N-glycans. Samples were desialylated before most of the analyses were performed and although sialylation was found at all six sites, the glycans to which the sialic acids were attached were not determined.
The EBOV transmembrane glycoprotein GP is responsible for determining viral tropism through attachment and fusion.7 During the later stages of the disease the virus appears to indiscriminately infect a wide variety of body tissues, suggesting that either the viral receptor is highly conserved and present on the surface of many cell types, or that the virus is able to use multiple alternative receptors for entry into cells. Although the cellular receptor(s) have not yet been identified, β-integrins,36 folate receptor-α,37 Tyro3 family receptors38 and the C-type lectins DC-SIGN and DC-SIGNR (also known as L-SIGN), proteins that bind mannose, GlcNAc and related sugars,39–42 have all been implicated. Recently, the related lectin, LSECtin, has been shown to bind the virus through truncated N-glycans (those lacking galactose).43 sGP has been associated with immune evasion by acting as a decoy molecule for EBOV-specific antibodies.26,44 It was also suggested that sGP binds to neutrophils, through their FC γ receptor III, and subsequently inhibits their activation,45,46 a concept that was challenged later by others.47 More recently, sGP has been associated with an anti-inflammatory role.33,48
It is apparent from this work that glycans play a major role in initiating and maintaining infection and, in this paper, we present detailed structural analysis by high-performance liquid chromatography (HPLC), MALDI and electrospray ionisation (ESI)-MS on the N-linked glycans of both the GP1 and sGP glycoproteins and additional information on the nature of the O-linked glycans on GP1 in the hope that this will lead to a better understanding of viral attachment and immune evasion.
EXPERIMENTAL
Materials
Reference N-glycans were from Oxford GlycoSciences Ltd. (Abingdon, UK). Bovine fetuin was from Sigma Chemical Co. (Poole, UK). 2.5-Dihydroxybenzoic acid (DHB, MALDI matrix) was from Aldrich Chemical Co. (Poole, UK) and was recrystallised from water. Water was distilled at sub-boiling point in a quartz apparatus and acetonitrile was from Riedel de Häen (Seelze, Germany).
Expression plasmids
sGP and GP1 were expressed separately using the pDisplay vector (Invitrogen) as described earlier.48,49 The inserted GP1 open reading frame contained an additional adenosine nucleotide at the transcriptional editing site to allow production of full-length GP1 but not sGP. Two stop codons were engineered upstream of the myc epitope and the PDGF receptor transmembrane domain to ensure the expressed protein was haemagglutinin (HA)-tagged (to facilitate purification by affinity chromatography) and secreted.
Transfection of 293T cells
The human embryonic kidney (HEK) epithelial cell line 293T was cultured in Dulbecco’s modified eagle medium (DMEM, GibcoTM, high glucose, with L-glutamine, with pyroxidine hydrochloride, without sodium pyruvate) that was supplemented with 10% foetal calf serum (FCS), 1% penicillin, 1% streptomycin and 1% L-glutamine (PSLG). On the day before transfection, cells were plated in circular 150 mm diameter plates (CoStar) at 4 × 10⁶ cells per plate and grown in 25 mL media. The transfection mixture consisted of DMEM (without additives, 500 μL), FuGENE6 Transfection Reagent (Roche Molecular Biochemicals, 36 μL) and plasmid DNA (20 μL of 1 μg/μL). The mixture was incubated for 30 min at room temperature before being added dropwise to the culture plates. The plates were incubated at 37°C in a 5% CO2 atmosphere. Every 24 h post-transfection, 12 mL of supernatant was harvested from each plate and the removed supernatant was replaced with warmed fresh DMEM supplemented with 10% FCS and 1% PSLG. The harvested supernatant was centrifuged at 2000 rpm for 10 min to remove cell debris and was transferred to a sterile tube and stored at +4°C. The supernatants were analysed for the presence of glycoprotein by enzyme-linked immunosorbent assay (ELISA) and Western blotting.
Detection of HA-tagged Ebola virus proteins by ELISA
ELISA plates (CoStar 3690, flat-bottomed) were coated with supernatant, 50 μL per well, and incubated with rocking overnight at 4°C. The plates were blocked with 3% bovine serum albumin (BSA) in phosphate-buffered saline (PBS), 100 μL per well, for 1 h at 37°C and washed ten times with PBS/0.05% Tween. The primary antibody (mouse anti-HA (Covance), HA.ll monoclonal purified, 1 mg/mL; diluted 1:200 in 1× PBS/1% BSA/0.05% Tween) was added at 50 μL/well and incubated with rocking for 1 h at room temperature. The plates were washed as above. The secondary antibody (goat anti-mouse IgG HRP-conjugated, diluted 1:10 000 in the above buffer), was used at 50 μL per well and incubated, with rocking, for 1 h at RT. The plates were washed again as above. Detection was performed using an Immunopure® TMB substrate kit (Pierce). When an intense blue colour developed (up to 30 min) the reaction was quenched with 2 M sulphuric acid, 50 μL per well, and the absorbance at 450 nm was read immediately.
Affinity chromatography using anti-HA matrix
The anti-HA column (BioRad) was used according to the manufacturer’s instructions. Briefly, the column was equilibrated with at least 20 column volumes of equilibration buffer (20 mM Tris, pH 7.5,100 mM NaCl, 0.1 mM EDTA). The beads were resuspended in the sample (dialysed into 50 mM Tris, pH 7.5, 150 mM NaCl) and incubated with rocking at RT for 2 h. The matrix was loaded back into the column support and the sample allowed to pass through the column five times. The column was washed with at least 20 column volumes of wash buffer (20 mM Tris, pH 7.5, 100 mM NaCl, 0.1 mM EDTA, 0.05% Tween). Elution was performed three times. One column volume of elution buffer (HA peptide at approximately 1 mg/mL in equilibration buffer) was applied and the column was incubated at 37°C for 20 min. This procedure was repeated twice and the eluted fractions were collected. The column was regenerated using at least 20 column volumes of regeneration buffer (0.1 M glycine, pH 2.0) and stored in two column volumes of storage buffer (20 mM Tris, pH 7.5, 100 mM NaCl, 0.1 mM EDTA, 0.09% NaN3). The fractions were analysed using sodium dodecyl sulphate/polyacrylamide gel electrophoresis (SDS-PAGE) and Western blotting, as described below.
SDS-PAGE analysis of purified glycoproteins
Cell supernatants and purified glycoprotein fractions were analysed using 4–15% gradient gel electrophoresis (BioRad). Samples were mixed with 5× Laemli buffer and heated at 100°C for 3 min prior to loading. For reduced samples, 1 M dithiothreitol (DTT) was also added to 10% of the total sample volume. The gels were run at a constant voltage (128 V) for 1 h and the protein bands were visualised by staining with Coomassie blue.
Detection of HA-tagged Ebola virus proteins by Western blotting
Following SDS-PAGE, the proteins were blotted onto PVDF membrane (BioRad) and detected using mouse anti-HA monoclonal antibody (Covance, HA.11 monoclonal purified, supplied at 1 mg/mL) diluted 1:1000 in 3% milk solution. Goat anti-mouse IgG F(ab′)2 alkaline phosphatase-conjugated antibody diluted 1:1000 in 3% milk solution was used as a secondary antibody. Visualisation was with Sigma Fast™ 5-bromo-4-chloro-3-indolyl phosphate/nitro blue tetrazolium (BOIP/NET) in 10 mL alkaline phosphatase buffer, pH 9.8. When sufficient colour had developed, the membrane was washed rigorously in water and allowed to dry in air.
N-Glycan release using peptide N-glycosidase F
The glycoproteins were separated by SDS-PAGE on a 9% resolving gel with a BioRad Mini-Protean II apparatus fitted with 80 × 80 × 0.75 mm plates. The running buffer was 2% SDS-Tris glycine. Gels were developed and stained with Coomassie Blue R-250. N-Glycans were released from within the SDS-PAGE gels with PNGase F50 essentially as described by Küster et al.51 Aliquots of the released glycans were cleaned by drop dialysis with a Nafion 117 membrane52 for mass spectrometry and the remainder were converted into 2-aminobenzamide (2-AB) derivatives for examination by HPLC.
O-Glycan release by hydrazinolysis
All samples for hydrazinolysis were dialysed into 0.1% trifluoroacetic acid (TFA) at 4°C overnight and lyophilised. A hydrazinolysis procedure was performed on the cryogenically dried sample, essentially as described by Merry et al.,53 with heating at 60°C for 6 h. Samples were re-N-acetylated on ice by addition of 200 μL of 2 M sodium acetate, pH 8.0, followed by two additions of 20 μL redistilled acetic anhydride. The sample was desalted on a H+-activated AG-50 (200–400 mesh) column which was washed extensively with water to elute the glycans. The samples were dried under vacuum, resuspended in 25 μL water and cleaned by descending paper chromatography using What-man 1 Chr chromatography paper in butan-1-ol/ethanol/water solvent (8:2:1, v/v/v). Glycans were eluted from the paper with water and dried.
Glycan derivatisation with 2-aminobenzamide
Glycans were labelled with 2-AB by reductive amination according to the procedure described by Bigge et al.54 using a 2-AB labelling kit from Glyko (now part of Prozyme at Hayward, CA, USA) with cleanup by ascending paper chromatography on 3MM chromatography paper (Millipore, Watford, UK) in 100% acetonitrile.
Glycan sequencing using exoglycosidase digestion
2-AB-labelled sugars (1–2 picomoles) were vacuum-dried and incubated at 37°C overnight (16 h) in 50 mM sodium citrate buffer (pH 5.2) with exoglycosidases (Glyko) as follows: Arthrobacter ureafaciens sialidase (ABS, EC 3.2.1.18), or a mixture of ABS and bovine testis β-galactosidase (BTG, EC 3.2.1.23), each at 1 U/mL, a mixture of ABS and almond meal α-fucosidase (AMF, EC 3.2.1.51), ABS, BTG and Jack bean β-N-acetylhexosaminidase (GUH), a mixture of ABS, BTG, Jack bean β-N-acetylhexosaminidase (JBH) and bovine kidney α-fucosidase (BKF, EC 3.2.1.51), Jack bean α-mannosidase (JBM, EC 3.2.1.24) 10 μL, 50 U/mL, Aspergillus saitoi α1-2-mannosidase (ASM, EC 3.2.1.113), 2 μL, 1 mU/mL. Additionally, S. pneumoniae β-galactosidase (SPG, EC 3.2.1.23) was used for the O-glycans. The enzymes were removed using washed 0.45 μm nitrocellulose microspin filters (Radleys, Saffron Walden, UK) and the collected solution was vacuum-dried and redissolved in 20 μL water for analysis by HPLC.
Normal-phase HPLC analysis
Acetonitrile (80 μL) was added to 10% of the sample (20 μL) and 95 μL was examined on a normal phase (NP)-HPLC system (Waters Alliance 2690, Waters Corp., Milford, MA, USA) fitted with a 4.6 × 250 mm GlycoSep N column (Oxford GlycoSciences, Abingdon, UK) with a run time of 180 min.55 The column was operated at 30°C and calibrated using a 2-AB-labelled dextran hydrolysate which allowed assignment of glucose unit (GU) values to each peak. The initial buffer was 20% 50 mM ammonium formate (pH 4.4)/80% acetonitrile and this was programmed over 162 min to 100% ammonium formate. The N-linked sugars eluted from the column with a retention time of between 40–120 min. Comparison with a dextran ladder using the web tool GlycoBase56 allowed assignment of GU values to each peak, which facilitated identification of the glycans present in the released glycan pool.
Weak anion-exchange chromatography
Analysis of oligosaccharides by weak anion-exchange (WAX) chromatography was carried out using a 7.5 × 50 mm Vydac protein WAX column (Anachem Ltd., Luton, Bedfordshire, UK) according to the conditions described previously.57 Chromatography started with a solvent of 10% methanol with addition of 500 mM ammonia formate (pH 9) to 100% over 65 min and the column was calibrated using 2-AB-labelled O-glycans from bovine fetuin.
MALDI-TOF MS
Positive ion MALDI-TOF mass spectra were obtained with a Waters-MS Technologies TofSpec 2E reflectron time-of-flight (TOF) mass spectrometer (Waters Ltd., Manchester, UK). The pulse and acceleration voltages were 3 and 20 kV, respectively. Data acquisition and processing were performed with MassLynx software version 3.3. Samples were prepared by mixing an aqueous solution of the glycan solution (0.5 μL) with a saturated solution of DHB in acetonitrile (0.3 μL) on the stainless steel MALDI target and allowing the mixture to dry under ambient conditions. The dried sample spot was then re-dissolved in ethanol (0.2 μL) and again allowed to dry.
ESI-MS and -MS/MS
Electrospray ionisation mass spectrometry (ESI-MS) was performed with a Waters quadrupole-time-of-flight (Q-Tof) Ultima Global instrument in negative ion mode. Samples in 1:1 (v/v) methanol/water were infused through Proxeon nanospray capillaries (Proxeon Biosystems, Odense, Denmark). The ion source conditions were: temperature, 120°C; nitrogen flow 50 L/h; infusion needle potential, 1.2 kV; cone voltage 100 V; RF-1 voltage 150 V. Spectra (2 s scans) were acquired with a digitisation rate of 4 GHz and accumulated until a satisfactory signal-to-noise (S/N) ratio had been obtained. For MS/MS data acquisition (collision-induced decomposition, CID), the precursor ion was selected at low resolution (about 5 m/z mass window) to allow transmission of isotope peaks and fragmented with argon at a pressure (recorded on the instrument’s pressure gauge) of 0.5 mbar. The voltage on the collision cell was adjusted with mass and charge to give an even distribution of fragment ions across the mass scale. Typical values were 80–120 V. Other voltages were as recommended by the manufacturer. Instrument control, data acquisition and processing were performed with MassLynx software version 4.0.
RESULTS
HA-tagged GP1 and sGP were transiently expressed in 293T cells. Analysis of the supernatants by ELISA showed peak expression of sGP-HA at 72 h post-transfection and a peak for GP1-HA at 96 h. The glycoproteins were purified by affinity chromatography and examined by SDS-PAGE and Western blotting.
Identification of N-glycans
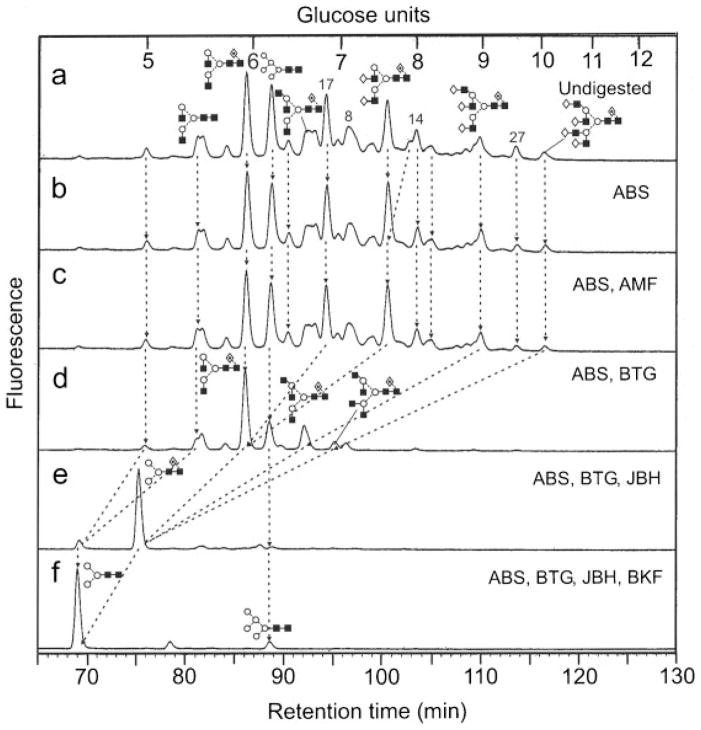
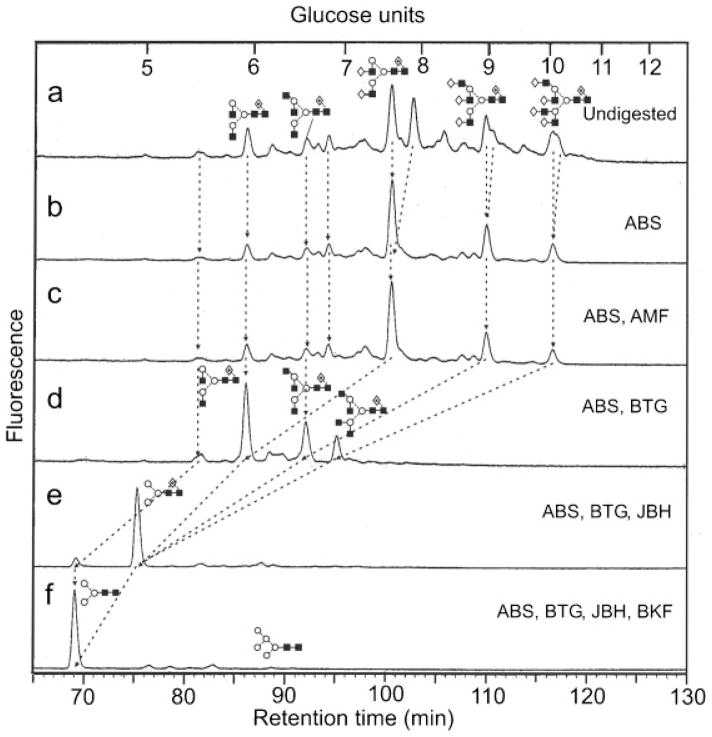
N-Glycans were released from the glycoproteins from within the SDS-PAGE gel bands and identified by MALDI-TOF MS, negative ion ESI-MS/MS and by exoglycosidase digestions with monitoring of the products by NP-HPLC as their 2-AB derivatives. The enzymes and enzyme mixtures used were as described in the Experimental section. Results for the GP1-HA and sGP-HA digests with (a) ABS, (b) ABS+AMF, (c) ABS+BTG, (d) ABS+BTG+JBH, (e) ABS+BTG+JBH+BKF are shown in Figs. 1 and 2, respectively. The results from this experiment defined the nature of the constituent monosaccharides, most of the information on linkage, but did not define the glycan topology. This information was obtained by negative ion MS/MS as described below. However, the results were consistent with the presence of mainly bi-, tri-and tetra-antennary complex glycans with core fucose, non-reducing end galactose and, additionally, a small amount of high-mannose glycans (confirmed by incubation with Aspergillus saitoi α1-2-mannosidase). Sialylation of GP1-HA was negligible (2.3%) whereas 35% of the glycan pool from sGP-HA contained sialic acid. Incubation with Newcastle disease sialidase (specific for α(2→3)-linked sialic acid) removed all sialic acids showing that these were α(2→3)-linked. More detailed structures were assigned to the peaks by mass spectrometry as described below.
Figure 1.
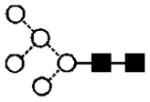
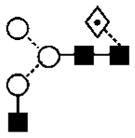
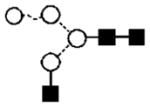
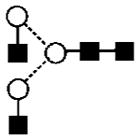
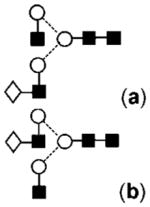
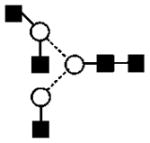
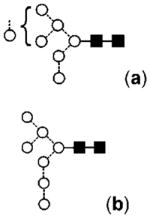
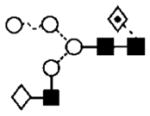
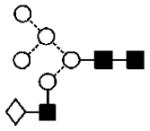
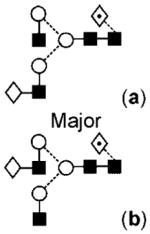
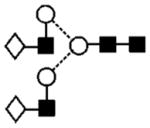
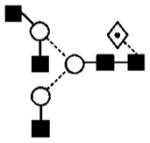
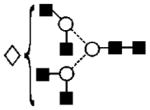
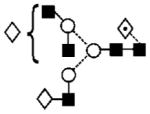
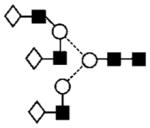
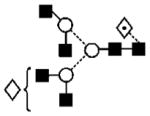
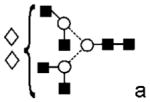
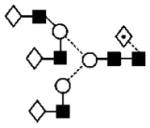
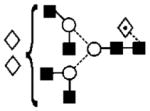
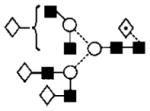
(a) Normal-phase separation of N-glycans present in GP1-HA from Ebola virus. (b) HPLC chromatogram after digestion with Arthrobacter ureafaciens sialidase (ABS) showing negligible sialic acid substitution, (c) after digestion with ABS and almond meal α-fucosidase (AMF) showing no fucose attached to the antennae, (d) ABS and bovine testis β-galactosidase (BTG) showing release of galactose residues, (e) ABS, BTG and β-N-acetylhexosaminidase (JBH) which reduces all complex glycans to core-fucosylated Man3GlcNAc2, and finally (f) ABS, BTG, JBH and bovine kidney α-fucosidase (BKF) showing the presence of core fucose. Numbers over the peaks in (a) refer to the structures in Table 1. Lines connecting the chromatograms show the movement of peaks after digestion. Symbols used for the structural formulae in this figure, other figures and Table 1: ■ = GlcNAc, ○ =mannose, ◇, = galactose, ⟐ = fucose. The angle of the lines connecting the symbols shows the linkage with full and broken lines specifying β- and α-linkages, respectively. The system is described in more detail in Harvey et al.62
Figure 2.
(a) Normal-phase separation of N-glycans present in sGP-HA from Ebola virus. Chromatograms (b–f) were produced by digestions with the same exoglycosidases as specified in the legend to Fig. 1. Lines connecting the chromatograms show the movement of peaks after digestion. Symbols used for the structural formulae are defined in the legend to Fig. 1.
GP1-HA
Complex glycans
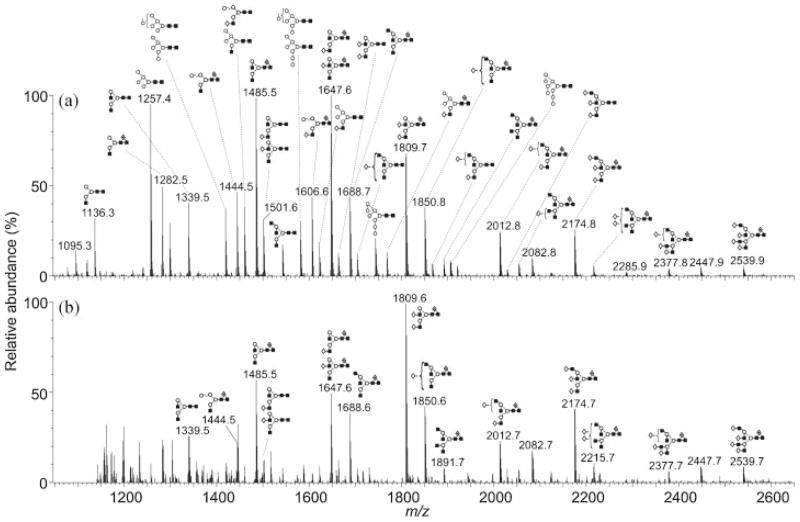
Figure 3 shows the MALDI-TOF spectra of the desialylated N-glycans released from GP1-HA (Fig. 3(a)) and sGP-HA (Fig. 3(b)). The masses of the major compounds allowed the numbers of constituent monosaccharides to be assigned to each peak; these compositions were consistent with the structures proposed following HPLC and exoglycosidase digestion although more fine detail was revealed. The identified compounds are listed in Table 1. The negative ion MS/MS spectra were of phosphate adducts ([M+H2PO4]−), the phosphate apparently arising from residual phosphate in the original sample, as observed previously from all glycan samples released as above. Formation of such adducts fortuitously stabilises negative ions from carbohydrates. Fragmentation of these adducts is virtually identical to that of [M–H] − ions because the first stage of fragmentation is deprotonation to give the [M–H] − ion.
Figure 3.
MALDI-TOF spectra (from DHB) of the desialylated N-glycans released from (a) GP1-HA and (b) sGP-HA. Symbols used for the structural formulae are defined in the legend to Fig. 1. Spectra have been smoothed (Savitzky Golay 2 × 2) and processed with the MaxEnt 2 function of MassLynx to improve resolution. Ions around m/z 1200 in the lower spectrum are from contaminants. In addition, two very abundant ions from additional contaminants at m/z 1373 and 1712 in the lower spectrum have been removed for clarity. Ions are labelled with their monoisotopic masses.
Table 1.
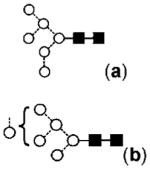
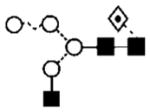
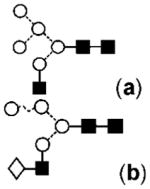
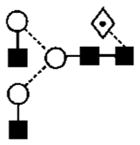
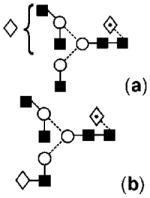
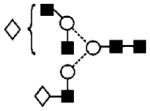
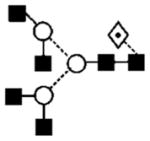
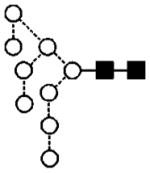
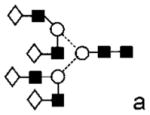
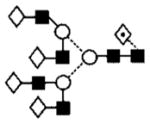
Monoisotopic masses, compositions and structures of the desialylated N-glycans found in Ebola virus fractions GP1-HA and sGP-HA
| No. | MALDI, m/z ([M+Na]+)
|
ESI ([M+H2PO4]−)
|
Composition
|
Structure | ||||||
|---|---|---|---|---|---|---|---|---|---|---|
| GP1-HA | sGP-HA | Calc. | GP1-HA | sGP-HA | Calc. | Hex | HexNAc | dHex | ||
| 1 | 1095.3 | — | 1095.4 | — | — | 1169.4 | 4 | 2 | 0 |

|
| 2 | 1136.3 | — | 1136.4 | 1210.5 | — | 1210.4 | 3 | 3 | 0 |
|
| 3 | 1241.5 | — | 1241.4 | — | — | 1315.4 | 4 | 2 | 1 |

|
| 4 | 1257.4 | 1257.3 | 1257.4 | 1331.5 | — | 1331.4 | 5 | 2 | 0 |
|
| 5 | 1282.5 | 1282.4 | 1282.5 | 1356.5 | — | 1356.5 | 3 | 3 | 1 |
|
| 6 | 1298.4 | — | 1298.5 | 1372.5 | — | 1372.5 | 4 | 3 | 0 |
|
| 7 | 1339.5 | 1339.7 | 1339.5 | 1413.5 | — | 1413.5 | 3 | 4 | 0 |
|
| 8 | 1419.5 | 1419.6 | 1419.5 | 1493.5 | — | 1493.5 | 6 | 2 | 0 |
|
| 9 | 1444.5 | 1444.6 | 1444.5 | 1518.5 | — | 1518.5 | 4 | 3 | 1 |
|
| 10 | — | 1460.5 | 1460.5 | 1534.5 | — | 1534.5 | 5 | 3 | 0 |
|
| 11 | 1485.5 | 1485.5 | 1485.5 | 1559.6 | 1559.5 | 1559.5 | 3 | 4 | 1 |
|
| 12 | 1501.6 | 1501.5 | 1501.5 | 1575.6 | — | 1575.5 | 4 | 4 | 0 |
|
| 13 | 1542.6 | 1542.6 | 1542.6 | 1616.6 | — | 1616.6 | 3 | 5 | 0 |
|
| 14 | 1581.5 | — | 1581.5 | 1655.5 | — | 1655.5 | 7 | 2 | 0 |
|
| 15 | 1606.6 | 1606.6 | 1606.6 | 1680.5 | — | 1680.6 | 5 | 3 | 1 |
|
| 16 | 1622.7 | 1622.6 | 1622.6 | 1696.5 | — | 1696.6 | 6 | 3 | 0 |
|
| 17 | 1647.6 | 1647.5 | 1647.6 | 1721.6 | 1721.5 | 1721.6 | 4 | 4 | 1 |
|
| 18 | 1663.7 | 1663.6 | 1663.6 | 1737.5 | — | 1737.7 | 5 | 4 | 0 |
|
| 19 | 1688.7 | 1688.5 | 1688.6 | 1762.6 | — | 1762.6 | 3 | 5 | 1 |
|
| 20 | 1704.7 | 1704.5 | 1704.6 | 1778.5 | — | 1778.6 | 4 | 5 | 0 |
|
| 21 | 1743.7 | — | 1743.6 | 1817.6 | — | 1817.6 | 8 | 2 | 0 |
|
| 22 | 1768.7 | 1768.7 | 1768.6 | 1842.6 | — | 1842.6 | 6 | 3 | 1 |
|
| 23 | 1809.7 | 1809.6 | 1809.6 | 1883.6 | 1883.6 | 1883.6 | 5 | 4 | 1 |
|
| 24 | 1850.8 | 1850.6 | 1850.7 | 1924.6 | 1924.7 | 1924.7 | 4 | 5 | 1 |
|
| 25 | 1866.7 | — | 1866.7 | — | 1940.7 | 1940.7 | 5 | 5 | 0 |
|
| 26 | 1891.8 | 1891.7 | 1891.7 | — | 1965.7 | 1965.7 | 3 | 6 | 1 |
|
| 27 | 1905.7 | 1905.7 | 1905.6 | 1979.5 | — | 1979.6 | 9 | 2 | 0 |
|
| 28 | 1907.8 | — | 1907.7 | — | — | 1981.7 | 4 | 6 | 0 |
|
| 29 | 2012.9 | 2012.7 | 2012.7 | 2086.7 | — | 2086.7 | 5 | 5 | 1 |
|
| 30 | 2028.8 | 2028.6 | 2028.7 | — | — | 2102.7 | 6 | 5 | 0 |
|
| 31 | 2053.9 | 2053.8 | 2053.7 | ? | — | 2127.7 | 4 | 6 | 1 |
|
| 32 | 2070.0 | — | 2069.7 | — | — | 2143.7 | 5 | 6 | 0 |
|
| 33 | 2174.8 | 2174.7 | 2174.8 | 2248.8 | 2248.8 | 2248.8 | 6 | 5 | 1 |
|
| 34 | 2215.8 | 2215.7 | 2215.8 | 2289.6 | — | 2289.8 | 5 | 6 | 1 |
|
| 35 | 2377.8 | 2377.7 | 2377.9 | — | — | 2451.9 | 6 | 6 | 1 |
|
| 36 | 2393.9 | — | 2393.8 | — | — | 2467.8 | 7 | 6 | 0 |
|
| 37 | 2539.9 | 2539.7 | 2539.9 | — | — | 2613.9 | 7 | 6 | 1 |
|
Structure not confirmed by MS/MS.
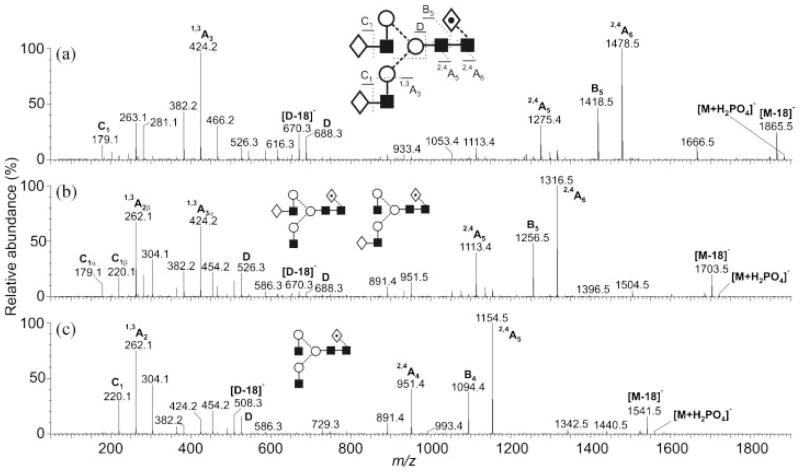
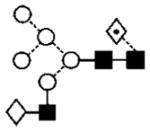
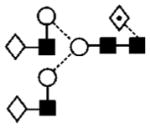
Spectra were interpreted as follows: The MALDI peak at m/z 1809 (Hex5HexNAc4dHex1, compound 23, Table 1) gave the MS/MS spectrum shown in Fig. 4(a). Location of the fucose to the core GlcNAc was made by the mass of the 2,4A6 ion (Domon and Costello58 nomenclature) at m/z 1474. This ion was formed by cleavage of the core GlcNAc residue with loss of the attached fucose residue.3–6 The composition of the antennae as Hex-HexNAc was defined by the 1,3A3 ion at m/z 424. Although ions specific for the linkage of the galactose residues were not found in the MS/MS spectra, these linkages appear to be β-(1→4)- to GlcNAc in this and the other compounds following work with Datura stramonium agglutinin (DSA) on N-glycans associated with glycoproteins from EBOV also produced in 293T cells.59 This lectin binds specifically to galactose β-(1→4)-linked to GlcNAc in complex or hybrid-type glycans. The two ions at m/z 688 and 670 (D and [D–18]−, see Harvey et al.6), which contained the branching mannose residue and 6-antenna (Gal-GlcNAc-Man-Man), defined the composition of this antenna and of the 3-antenna by difference. Other diagnostic ions are labelled in Fig. 4(a). The spectrum was identical to that of an authentic standard.
Figure 4.
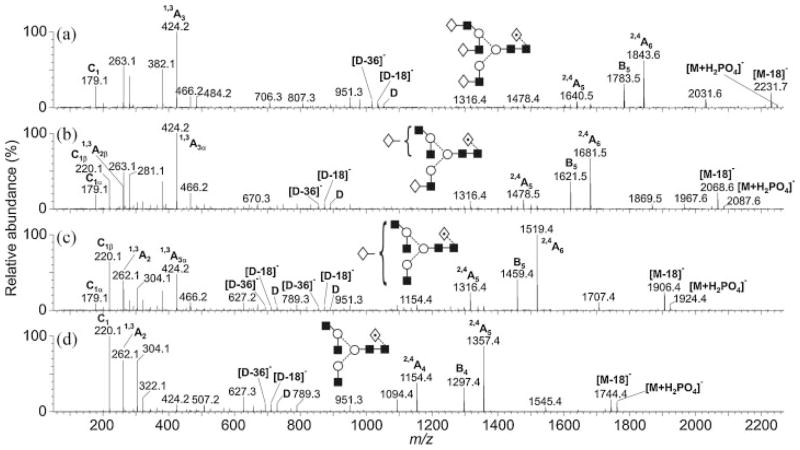
Negative ion CID spectra of fucosylated biantennary glycans with (a) two, (b) one, and (c) no galactose residues on the antennae.
The product ion spectrum of compound 17 (a and b) producing the ion at m/z 1647.6 (Hex4HexNAc4dHex1, Fig. 4(b)) was similar to that of compound 23 but the two sets of D and [D–18]− ions at m/z 688/670, and 526/508 showed the presence of two isomeric compounds, each of which had one galactose residue either on the 3- (17a giving m/z 526/508) or 6-antenna (17b). Two C1 ions at m/z 179 and 220 confirmed antennae with and without galactose, respectively. The compound with the galactose on the 3-antenna (17a) predominated. The other core-fucosylated biantennary glycan (Hex3HexNAc4dHex1, 11) giving the MALDI ion at m/z 1485 had no galactose residues as shown by the absence of a C1 ion at m/z 179 in its MS/MS spectrum (Fig. 4(c)) and the presence of the D and [D–18]− ions only at m/z 526/508. A similar set of three biantennary compounds lacking the core fucose residue was present at m/z 1663 (18), 1501 (12a,b) and 1339 (7, MALDI spectrum).
The product ion spectra of the corresponding triantennary glycans (13, 20a,b, 25, 30 without fucose and 19, 24a,b, 29 and 33 with core fucose) are shown in Fig. 5. These triantennary compounds were branched on the 6-antenna as revealed by the presence of D, [D–18]− and [D–36]− ions at m/z 1053, 1035 and 1017, respectively.6 If these compounds had been branched on the 3-antenna, a prominent E-type ion would have been present at m/z 831. No such ion was seen. Antenna compositions were Hex-HexNAc, as before as shown by the 1,3A3 ion at m/z 424 with the C1 ion at m/z 179 confirming non-reducing terminal hexose (galactose). The 405 mass unit gap between the molecular and 2,4A6 cross-ring fragment ion at m/z 1843 confirmed fucose at the 6-position of the core GlcNAc in compounds 19, 24a,b, 29 and 33.
Figure 5.
Negative ion CID spectra of fucosylated triantennary glycans with (a) three, (b) two, (c) one, and (d) no galactose residues on the antennae.
The majority of D, [D–18]− and [D–36]− ions in the product ion spectrum (Fig. 5(b)) of the triantennary glycans 25 and 29 without and with a core fucose residue and lacking one galactose residue appeared at m/z 891, 873 and 855, respectively, showing that the galactose was missing mainly from the 6-antenna (either branch). Low-intensity peaks produced by D, [D–18]− and [D–36]− ions at m/z 1053, 1035 and 1017, respectively (intact antennae), showed that some galactose was missing from the 3-antenna. A 1,3A2 ion at low abundance at m/z 262 confirmed the location of the missing galactose as did the appearance of the C1 fragment at m/z 220 (HexNAc). Similar interpretations of the spectrum of the triantennary compounds lacking two galactose residues (20a,b and 24a,b, Fig. 5(c)) showed that the single galactose could be substituted on any of the three antennae. The spectrum of the triantennary glycans with no galactose residues (13 and 19, Fig. 5(d)) again confirmed the branched 6-antenna structure by the presence of D, [D–18]− and [D–36]− ions at m/z 729, 711 and 693, respectively, the absence of non-reducing hexose (absence of a C1 ion at m/z 179) and the presence of core fucose (2,4A5 ion at m/z 1357).
In a similar way, tetra-antennary glycans with core fucose and with zero to four galactose residues (28, 32 and 36 without core fucose and 26, 31, 34, 35, 37 with fucose) produced [M+Na]+ ions in the MALDI-TOF spectrum at m/z 1907, 2070, 2393, 1891, 2053, 2215, 2377 and 2539, respectively. Tetra-antennary glycans without core fucose were only seen with one (28), two (32) and four (36) galactose residues at m/z 1907, 2070 and 2393.
No compounds were seen with bisecting GlcNAc residues. These compounds are characterised by the absence of D ions and the presence of a very abundant ion at the mass of the [M–18]− ion but, in the presence of a bisecting GlcNAc, this ion corresponds to [M–221]− as the result of loss of the GlcNAc residue rather than water. Sialylation was negligible. Analysis by WAX chromatography (results not shown) showed traces of mainly monosialylated glycans but these were not observed in the ESI spectrum and were not investigated further.
High-mannose glycans
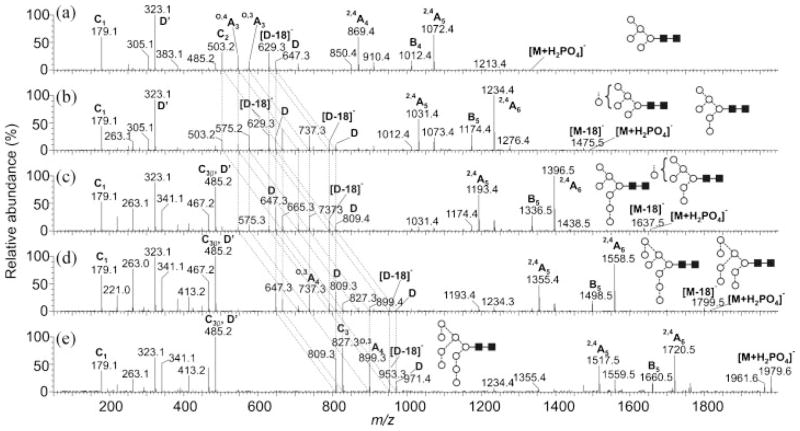
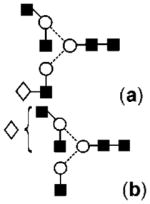
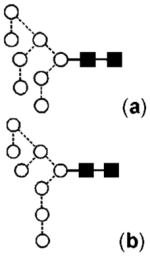
High-mannose glycans produced the [M+Na]+ ions at m/z 1095, 1257, 1418, 1581, 1843 and 1905 in the MALDI-TOF spectrum corresponding to the compositions Man4–9GlcNAc2 (1, 4, 8a,b, 14a,b, 21a,b and 27, respectively). The product ion spectra of their [M+H2PO4]− adducts in the negative ion mode (Fig. 6) showed that there was essentially only one isomer of Man5GlcNAc2 (4, Fig. 6(a)) and Man9GlcNAc2 (27, Fig. 6(e)) whereas the other three high-mannose glycans (8a,b, 14a,b, 21a,b) were present as mixtures of isomers as shown by the presence of two sets of O,4A3, O,3A3, [D–18]− and D ions. Man6GlcNAc2 (8a,b, Fig. 6(b)) was mainly the isomer with two mannose residues in the 3-antenna (8a) but the partial shifts by 162 mass units in the O,4A3, O,3A3, [D–18]− and D ions showed that a second isomer (8b) was present with the sixth mannose in the 6-antenna. This mannose residue appeared to be on the 3-branch of the 6-antenna because of the low abundance of the ion at m/z 485. This latter ion, termed D′, appears to be mainly formed by a similar mechanism to that giving rise to the D ion because the linkage (3- and 6-positions) around the branching mannose of the 6-antenna is the same as that around the core branching mannose. Therefore, the D′ ion would appear at m/z 485 if the sixth mannose residue of Man6GlcNAc2 was on the 6-antenna as is the case for the spectrum from Man9GlcNAc2. Two sets of O,4A3, O,3A3, [D–18]− and D ions (m/z 545, 575, 629, 647 and at m/z 707, 737, 791, 809, Fig. 6(c)) were also present in the spectrum of Man7GlcNAc2 (14a,b) revealing isomers with the sixth and seventh mannose residue on the 3-antenna (14b) or one extra mannose residue (from the Man5GlcNAc2 structure) on each antenna (14a). Further shifts in the masses of the O,4A3, O,3A3, [D–18]− and D ions to m/z 869, 899, 953, and 971 in the spectrum of Man8GlcNAc2 (21) showed the presence of the isomers illustrated in Fig. 6(d).
Figure 6.
Negative ion CID spectra of high-mannose N-glycans from Ebola virus GP1-HA glycoprotein. Panels (a–e) show the spectra of Man5GlcNAc2 through Man9GlcNAc2. Structures of the isomers are shown. The broken lines connecting the spectra show the shifts in the fragment ions that define the isomer structures (see text).
Hybrid glycans
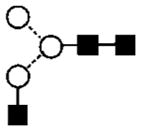
Hybrid glycans were relatively abundant with (9, 15 and 22) and without (6, 10, 16) core fucose. Their product ion spectra were characterised by D and [D–18]− ions at m/z 647 and 629, respectively, indicating three mannose residues in the 6-antenna and at m/z 485 and 467 indicating two. As with the complex glycans, they were found with and without galactose in the 3-antenna. Further proof of their structures was obtained by HPLC analysis of the products of a Jack bean mannosidase digest. This enzyme removed all mannose residues from the 6-antenna and produced the expected four linear compounds (Gal)0,1-β-(1→4)GlcNAc-β-(1→2)-Manα-(1→3)Man-β-(1→4)-[Fuc-α-(1→6)-]0,1-GlcNAc (data not shown).
sGP-HA
The glycans found in this sample were essentially the same as those in GP1-HA although the relative proportions were different (Fig. 3). In particular, there were lower amounts of high-mannose glycans and the complex glycans were more highly processed in having more galactose on the antennae. Many of these glycans were also sialylated. Analysis by WAX chromatography showed that these were mainly mono-sialylated with traces of disialylated glycans.
O-Linked glycans
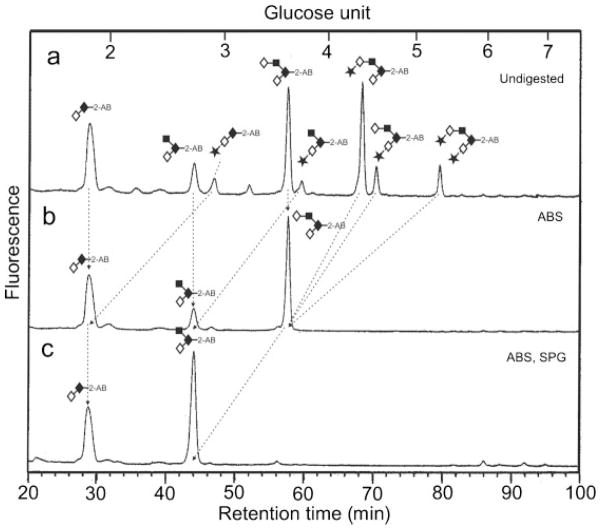
O-Linked glycans were released by hydrazinolysis, re-N-acetylated, converted into 2-AB derivatives and analysed by NP-HPLC. No O-linked glycans were found in sample sGP-HA. The HPLC chromatogram for the glycans found in sample GP1-HA is shown in Fig. 7(a). Results of digestion with Arthrobacter ureafaciens sialidase and Streptococcus pneumoniae β-galactosidase (specific for β-(1→4)-linked galactose) are shown in Figs. 7(b) and 7(c). The structures were core 1 and core 2 glycans with varying amounts of sialic acid with core 2 structures predominating. The presence of one and two sialic acids was also revealed by WAX chromatography (data not shown).
Figure 7.
(a) Normal-phase separation of O-glycans present in GP1-HA from Ebola virus. (b) HPLC chromatogram after digestion with Arthrobacter ureafaciens sialidase (ABS) showing sialic acid substitution, (c) after digestion with ABS and Streptococcus pneumoniae β-galactosidase (SPG, specific for β-(1→4)-linked galactose). The arrows show how the peaks move after digestion.
DISCUSSION
MALDI-TOF analysis was the most appropriate method for obtaining the glycan profile and constituent monosaccharide compositions in terms of hexose, HexNAc, etc., from these glycans whereas negative ion MS/MS of their phosphate adducts provided detailed structure. However, neither technique could identify the nature of the constituent monosaccharides. This information, together with confirmation of linkage position, was provided by the results of exoglycosidase digestions. It is clear, however, that none of these methods could provide all the information that was necessary to characterise these glycans fully. Thirty-seven neutral mass different species of high-mannose, hybrid and complex glycans were found but many of these species consisted of several isomers making the total nearer to sixty. No bisected glycans were found and many of the complex glycans lacked their full complement of galactose residues.
The results of this study are in agreement with the recent study by Powlesland et al.,43 in 293 cells, that also found that a high percentage of complex glycans were deficient in galactose. However, the present study provides considerably more detail of the structures of the glycans and, in particular, demonstrates the absence of bisected structures whose existence was questioned but not confirmed in the earlier study.43 The results also confirm the presence of core fucose and the branched 6-antenna in the triantennary glycans. Sialylated glycans were present in the glycan pool derived from sGP but were largely absent from GP1-HA. WAX chromatography confirmed that these glycans were mainly monosialylated compounds with a trace of disialylated material and exoglycosidase digestion showed them to be α2(→3)-linked. However, sialylated glycans were not detected by ESI in the GP1-HA sample. The presence of sialylated glycans from sGP-HA correlates with the generally higher level of processing of the glycans in this fraction (higher percentage of galactose and lower levels of high-mannose glycans). Measurement of the levels of sialylated glycans in N-glycan pool have earlier been proposed as a method for differentiating EBOV from the closely related MARV;30 Vero E6 cells produce glycans with no sialic acids in the case of MARV, whereas Ebola glycans from the same cell line are sialylated.
In other respects, the glycans reported here are similar to those from MARV expressed in Vero E6 cells60,61 in that they consist of high-mannose, hybrid, bi-, tri- and tetra-antennary compounds with and without core fucose. However, they differ in that they contain a relatively high percentage of truncated N-glycans lacking the terminal galactose residues; complex neutral glycans from MARV were largely fully processed. The resulting GlcNAc-terminating glycans have been found to bind to LSECtin43 possibly indicating differences in susceptibility of individuals to infection.
Acknowledgments
We thank Brian Matthews for releasing the O-linked glycans with hydrazine. We also thank the Wellcome Trust and the Biotechnology and Biological Sciences Research Council for equipment grants to purchase the Q-Tof and TofSpec mass spectrometers, respectively. Studies on filoviruses at the National Microbiology Laboratory in Winnipeg were funded by the Public Health Agency of Canada.
References
- 1.Harvey DJ. Mass Spectrom Rev. 1999;18:349. doi: 10.1002/(SICI)1098-2787(1999)18:6<349::AID-MAS1>3.0.CO;2-H. [DOI] [PubMed] [Google Scholar]
- 2.Harvey DJ, Martin RL, Jackson KA, Sutton CW. Rapid Commun Mass Spectrom. 2004;18:2997. doi: 10.1002/rcm.1709. [DOI] [PubMed] [Google Scholar]
- 3.Harvey DJ. J Am Soc Mass Spectrom. 2005;16:631. doi: 10.1016/j.jasms.2005.01.005. [DOI] [PubMed] [Google Scholar]
- 4.Harvey DJ. J Am Soc Mass Spectrom. 2005;16:622. doi: 10.1016/j.jasms.2005.01.004. [DOI] [PubMed] [Google Scholar]
- 5.Harvey DJ. J Am Soc Mass Spectrom. 2005;16:647. doi: 10.1016/j.jasms.2005.01.006. [DOI] [PubMed] [Google Scholar]
- 6.Harvey DJ, Royle L, Radcliffe CM, Rudd PM, Dwek RA. Anal Biochem. 2008;376:44. doi: 10.1016/j.ab.2008.01.025. [DOI] [PubMed] [Google Scholar]
- 7.Sanchez A, Geisbert TW, Feldmann H. In: Fields Virology. Knipe DM, Howley PM, Griffin DE, Lamb RA, Martin MA, editors. Wolters Kluwer/Lippincott Williams and Wilkins; Philadelphia: 2007. p. 1409. [Google Scholar]
- 8.Feldmann H, Geisbert TW, Jahrling PB, Klenk HD, Netesov SV, Peters CJ, Sanchez A, Swanepoel R, Volchkov VE. In: Virus Taxonomy, VIIIth Report of the ICTV. Fauquet CM, Mayo MA, Maniloff J, Desselberger U, Ball LA, editors. Elsevier/Academic Press; London: 2005. p. 645. [Google Scholar]
- 9.Towner JS, Sealy TK, Khristova ML, Albariño CG, Conlan S, Reeder SA, Quan PL, Lipkin WI, Downing R, Tappero JW, Okware S, Lutwama J, Bakamutumaho B, Kayiwa J, Comer JA, Rollin PE, Ksiazek TG, Nichol ST. PLoS Pathog. 2008;4:e1000212. doi: 10.1371/journal.ppat.1000212. [DOI] [PMC free article] [PubMed] [Google Scholar]
- 10.WHO. Bull W H O. 1978;56:271. [Google Scholar]
- 11.WHO. Bull W H O. 1978;56:247. [Google Scholar]
- 12.Johnson KM, Lange JV, Webb PA, Murphy FA. Lancet. 1977:569. doi: 10.1016/s0140-6736(77)92000-1. [DOI] [PubMed] [Google Scholar]
- 13.WHO. 2007 Available: http://www.who.int/mediacentre/factsheets/fs103/en/index.html.
- 14.Groseth A, Feldmann H, Strong JE. Trends Microbiol. 2007;15:408. doi: 10.1016/j.tim.2007.08.001. [DOI] [PubMed] [Google Scholar]
- 15.Fisher-Hoch SP, Platt GS, Neild GH, Southee T, Baskerville A, Raymond RT, Lloyd G, Simpson GI. J Infect Dis. 1985;152:887. doi: 10.1093/infdis/152.5.887. [DOI] [PubMed] [Google Scholar]
- 16.Muyembe-Tamfum JJ, Kipasa M, Kiyungu C, Colebunders R. J Infect Dis. 1999;179(Suppl 1):S259. doi: 10.1086/514302. [DOI] [PubMed] [Google Scholar]
- 17.Bray M, Davis K, Geisbert T, Schmaljohn C, Huggins J. J Infect Dis. 1999;179:S139. doi: 10.1086/514292. [DOI] [PubMed] [Google Scholar]
- 18.Reiter P, Turell M, Coleman R, Miller B, Maupin G, Liz J, Kuehne A, Barth J, Geisbert J, Dohm D, Click J, Pecor J, Robbins R, Jahrling P, Peters C, Ksiazek T. Virology. 1999;179:S148. doi: 10.1086/514304. [DOI] [PubMed] [Google Scholar]
- 19.Leirs H, Mills JN, Krebs JW, Childs JE, Akaibe D, Woollen N, Ludwig G, Peters CJ, Ksiazek TG. J Infect Dis. 1999;179:S155. doi: 10.1086/514299. [DOI] [PubMed] [Google Scholar]
- 20.Leroy EM, Kumulungui B, Pourrut X, Rouquet P, Hassanin A, Yaba P, Délicat A, Paweska JT, Gonzalez JP, Swanepoel R. Nature. 2005;438:575. doi: 10.1038/438575a. [DOI] [PubMed] [Google Scholar]
- 21.Towner JS, Pourrut X, Albariño CG, Nkogue CN, Bird BH, Grard G, Ksiazek TG, Gonzalez JP, Nichol ST, Leroy EM. PLoS ONE. 2007;2:e764. doi: 10.1371/journal.pone.0000764. [DOI] [PMC free article] [PubMed] [Google Scholar]
- 22.Swanepoel R, Smit SB, Rollin PE, Formenty P, Leman PA, Kemp A, Burt FJ, Grobbelaar AA, Croft J, Bausch DG, Zeller H, Leirs H, Braack LE, Libande ML, Zaki SR, Nichol ST, Ksiazek TG, Paweska JT. Emerg Infect Dis. 2007;13:1847. doi: 10.3201/eid1312.071115. [DOI] [PMC free article] [PubMed] [Google Scholar]
- 23.Sanchez A, Kiley MP, Holloway BP, Auperin DD. Virus Res. 1993;29:215. doi: 10.1016/0168-1702(93)90063-s. [DOI] [PubMed] [Google Scholar]
- 24.Sanchez A, Trappier SG, Mahy BW, Peters CJ, Nichol ST. Proc Natl Acad Sci USA. 1996;93:3602. doi: 10.1073/pnas.93.8.3602. [DOI] [PMC free article] [PubMed] [Google Scholar]
- 25.Volchkov VE, Becker S, Volchkova VA, Ternovoj VA, Kotov AN, Netesov SV, Klenk HD. Virology. 1995;214:421. doi: 10.1006/viro.1995.0052. [DOI] [PubMed] [Google Scholar]
- 26.Ito H, Watanabe S, Takada A, Kawaoka Y. J Virol. 2001;75:1576. doi: 10.1128/JVI.75.3.1576-1580.2001. [DOI] [PMC free article] [PubMed] [Google Scholar]
- 27.Volchkov VE, Feldmann H, Volchkova VA, Klenk HD. Proc Natl Acad Sci USA. 1998;95:5762. doi: 10.1073/pnas.95.10.5762. [DOI] [PMC free article] [PubMed] [Google Scholar]
- 28.Wool-Lewis RJ, Bates P. J Virol. 1998;72:3155. doi: 10.1128/jvi.72.4.3155-3160.1998. [DOI] [PMC free article] [PubMed] [Google Scholar]
- 29.Manicassamy B, Wang J, Jiang H, Rong L. J Virol. 2005;79:4793. doi: 10.1128/JVI.79.8.4793-4805.2005. [DOI] [PMC free article] [PubMed] [Google Scholar]
- 30.Feldmann H, Nichol ST, Klenk HD, Peters CJ, Sanchez A. Virology. 1994;199:469. doi: 10.1006/viro.1994.1147. [DOI] [PubMed] [Google Scholar]
- 31.Jeffers SA, Sanders DA, Sanchez A. J Virol. 2002;76:12463. doi: 10.1128/JVI.76.24.12463-12472.2002. [DOI] [PMC free article] [PubMed] [Google Scholar]
- 32.Sanchez A, Yang ZY, Xu L, Nabel GJ, Crews T, Peters CJ. J Virol. 1998;72:6442. doi: 10.1128/jvi.72.8.6442-6447.1998. [DOI] [PMC free article] [PubMed] [Google Scholar]
- 33.Falzarano D, Krokhin O, Wahl-Jensen V, Seebach J, Wolf K, Schnittler H-J, Feldmann H. ChemBioChem. 2006;7:1605. doi: 10.1002/cbic.200600223. [DOI] [PubMed] [Google Scholar]
- 34.Barrientos LG, Martin AM, Wohlhueter RM, Rollin PE. J Infect Dis. 2007;196:S220. doi: 10.1086/520614. [DOI] [PubMed] [Google Scholar]
- 35.Falzarano D, Krokhin O, Van Domselaar G, Wolf K, Seebach J, Schnittler HJ, Feldmann H. Virology. 2007;368:83. doi: 10.1016/j.virol.2007.06.015. [DOI] [PMC free article] [PubMed] [Google Scholar]
- 36.Takada A, Watanabe S, Ito H, Okazaki K, Kida H, Kawaoka Y. Virology. 2000;278:20. doi: 10.1006/viro.2000.0601. [DOI] [PubMed] [Google Scholar]
- 37.Chan SY, Empig CJ, Welte FJ, Speck RF, Schmaljohn A, Kreisberg JF, Goldsmith MA. Cell. 2001;106:117. doi: 10.1016/s0092-8674(01)00418-4. [DOI] [PubMed] [Google Scholar]
- 38.Shimojima M, Takada A, Ebihara H, Neumann G, Fujioka K, Irimura T, Jones S, Feldmann H, Kawaoka Y. J Virol. 2006;80:10109. doi: 10.1128/JVI.01157-06. [DOI] [PMC free article] [PubMed] [Google Scholar]
- 39.Alvarez CP, Lasala F, Carrillo J, Muñiz O, Corbí AL, Delgado R. J Virol. 2002;76:6841. doi: 10.1128/JVI.76.13.6841-6844.2002. [DOI] [PMC free article] [PubMed] [Google Scholar]
- 40.Simmons G, Reeves JD, Grogan CC, Vandenberghe LH, Baribaud F, Whitbeck JC, Burke E, Buchmeier MJ, Soilleux EJ, Riley JL, Doms RW, Bates P, Pöhlmann S. Virology. 2003;305:115. doi: 10.1006/viro.2002.1730. [DOI] [PubMed] [Google Scholar]
- 41.Vigerust DJ, Shepherd VL. Trends Microbiol. 2007;15:211. doi: 10.1016/j.tim.2007.03.003. [DOI] [PMC free article] [PubMed] [Google Scholar]
- 42.Takada A, Fujioka K, Tsuiji M, Morikawa A, Higashi N, Ebihara H, Kobasa D, Feldmann H, Irimura T, Kawaoka Y. J Virol. 2004;78:2943. doi: 10.1128/JVI.78.6.2943-2947.2004. [DOI] [PMC free article] [PubMed] [Google Scholar]
- 43.Powlesland AS, Fisch T, Taylor ME, Smith DF, Tissot B, Dell A, Pohlmann S, Drickamer K. J Biol Chem. 2008;283:593. doi: 10.1074/jbc.M706292200. [DOI] [PMC free article] [PubMed] [Google Scholar]
- 44.Feldmann H, Jones S, Klenk HD, Schnittler HJ. Nat Rev Immunol. 2003;3:677. doi: 10.1038/nri1154. [DOI] [PubMed] [Google Scholar]
- 45.Yang Z, Delgado R, Xu L, Todd RF, Nabel EG, Sanchez A, Nabel GJ. Science. 1998;279:1034. doi: 10.1126/science.279.5353.1034. [DOI] [PubMed] [Google Scholar]
- 46.Kindzelskii AL, Yang Z, Nabel GJ, Todd RFI, Petty HR. J Immunol. 2000;164:953. doi: 10.4049/jimmunol.164.2.953. [DOI] [PubMed] [Google Scholar]
- 47.Sui J, Marasco WA. Virology. 2002;303:9. doi: 10.1006/viro.2002.1715. [DOI] [PubMed] [Google Scholar]
- 48.Wahl-Jensen VM, Afanasieva TA, Seebach J, Ströher U, Feldmann H, Schnittler HJ. J Virol. 2005;79:10442. doi: 10.1128/JVI.79.16.10442-10450.2005. [DOI] [PMC free article] [PubMed] [Google Scholar]
- 49.Wahl-Jensen V, Kurz SK, Hazelton PR, Schnittler HJ, Ströher U, Burton DR, Feldmann H. J Virol. 2005;79:2413. doi: 10.1128/JVI.79.4.2413-2419.2005. [DOI] [PMC free article] [PubMed] [Google Scholar]
- 50.Royle L, Campbell MP, Radcliffe CM, White DM, Harvey DJ, Abrahams JL, Kim Y-G, Henry GW, Shadick NA, Weinblatt ME, Lee DM, Rudd PM, Dwek RA. Anal Biochem. 2008;376:1. doi: 10.1016/j.ab.2007.12.012. [DOI] [PubMed] [Google Scholar]
- 51.Küster B, Wheeler SF, Hunter AP, Dwek RA, Harvey DJ. Anal Biochem. 1997;250:82. doi: 10.1006/abio.1997.2199. [DOI] [PubMed] [Google Scholar]
- 52.Börnsen KO, Mohr MD, Widmer HM. Rapid Commun Mass Spectrom. 1995;9:1031. doi: 10.1002/rcm.1290090919. [DOI] [PubMed] [Google Scholar]
- 53.Merry AH, Neville DCA, Royle L, Matthews B, Harvey DJ, Dwek RA, Rudd PM. Anal Biochem. 2002;304:91. doi: 10.1006/abio.2002.5620. [DOI] [PubMed] [Google Scholar]
- 54.Bigge JC, Patel TP, Bruce JA, Goulding PN, Charles SM, Parekh RB. Anal Biochem. 1995;230:229. doi: 10.1006/abio.1995.1468. [DOI] [PubMed] [Google Scholar]
- 55.Guile GR, Rudd PM, Wing DR, Prime SB, Dwek RA. Anal Biochem. 1996;240:210. doi: 10.1006/abio.1996.0351. [DOI] [PubMed] [Google Scholar]
- 56.Campbell MP, Royle L, Radcliffe CM, Dwek RA, Rudd PM. Bioinformatics. 2008;24:1214. doi: 10.1093/bioinformatics/btn090. [DOI] [PubMed] [Google Scholar]
- 57.Royle L, Mattu TS, Hart E, Langridge JI, Merry AH, Murphy N, Harvey DJ, Dwek RA, Rudd PM. Anal Biochem. 2002;304:70. doi: 10.1006/abio.2002.5619. [DOI] [PubMed] [Google Scholar]
- 58.Domon B, Costello CE. Glycoconjugate J. 1988;5:397. [Google Scholar]
- 59.Huang Y, Xu L, Sun Y, Nabel GJ. Mol Cell. 2002;10:307. doi: 10.1016/s1097-2765(02)00588-9. [DOI] [PubMed] [Google Scholar]
- 60.Feldmann H, Will C, Schikore W, Slenczka W, Klenk H-D. Virology. 1991;182:353. doi: 10.1016/0042-6822(91)90680-A. [DOI] [PMC free article] [PubMed] [Google Scholar]
- 61.Geyer H, Will C, Feldmann H, Klenk H-D, Geyer R. Glycobiology. 1992;2:299. doi: 10.1093/glycob/2.4.299. [DOI] [PMC free article] [PubMed] [Google Scholar]
- 62.Harvey DJ, Merry AH, Royle L, Campbell MP, Dwek RA, Rudd PM. Proteomics. 2009;9:3796. doi: 10.1002/pmic.200900096. [DOI] [PubMed] [Google Scholar]


