

Abstract
Literature suggests that reduced electrodermal reactivity (EDR) is related to externalizing problems. However, the genetic and environmental etiology of this association is unknown. Using a standard habituation paradigm, we measured responses to 15 loud tones in four cohorts of adolescent twins (N = 2129). We quantified EDR as the average size of elicited responses (amplitude) and by counting the number of SCRs (frequency). Externalizing liability was indexed through a general factor underlying substance-related problems and antisocial behavior. Response frequency, but not mean SCR amplitude, was inversely associated with externalizing liability in each twin cohort. Biometric modeling revealed that most of the overlap between response frequency and externalizing liability was due to genetic influences common to both phenotypes. It is argued that neurological mechanisms involved in habituation may shed light on the etiology of psychopathology.
Keywords: electrodermal, habituation, externalizing, heritability
Examining Electrodermal Hyporeactivity as a Marker of Externalizing Psychopathology: A Twin Study
Advances in the conceptualization and measurement of psychopathology indicate that antisocial behavior and substance abuse are part of a broader externalizing spectrum (Krueger et al., 2002; Hicks, Schalet, Malone, Iacono, & McGue, 2011). Antisocial conduct and substance use appear to covary in late adolescence due to a common vulnerability to low self-control. Twin studies demonstrate that genetic factors are largely responsible for the overlap among the various externalizing disorders and attributes (Hicks, Krueger, Iacono, McGue, & Patrick, 2004; Kendler, Prescott, Myers, & Neale, 2003; Krueger et al., 2002). Such findings led Iacono, Malone, and McGue (2008) to argue for the value of investigating the psychophysiological mechanisms that underlie the covariance among externalizing characteristics.
Although few electrodermal studies have focused on the broader externalizing spectrum, there is a particularly robust body of evidence indicating that antisocial behavior is associated with electrodermal hyporeactivity (Raine, 2002; Herpertz et al., 2003; Lorber, 2004). Inverse associations between externalizing problems and electrodermal reactivity (EDR) emerge across a wide spectrum of auditory stimuli, including low-intensity tones (Herpertz et al., 2001; Raine, Reynolds, Venables, & Mednick, 1997; Raine, Venables, & Williams, 1990), bursts of white noise (Herpertz et al., 2003; Fung et al., 2005), and moderately intense sounds (Isen et al., 2010). According to a detailed meta-analysis by Lorber (2004), childhood conduct problems and adult psychopathy are characterized by lower electrodermal activity, including attenuated EDR to task-related stimuli. Recent studies using community samples indicate that psychopathic personality traits and antisocial personality features are related to EDR in males, but not females (Isen et al., 2010; Sylvers, Brennan, Lilienfeld, & Alden, 2010).
Several studies have investigated electrodermal indices in reference to alcohol dependence and/or abuse. A pattern of electrodermal hyporeactivity appears to characterize alcoholics (Knott & Bulmer, 1985), with alcoholics showing fewer SCRs and faster habituation to tones than non-alcoholics. However, electrodermal findings with respect to visual stimuli are in the opposite direction, with increased reactivity observed in alcoholics (Stormark, Laberg, Bjerland, & Hugdahl, 1993). Evidence for electrodermal hyper- or hypo-reactivity in the male offspring of alcoholics is similarly equivocal (Finn, Zeitouni, & Pihl, 1990; Finn, Kessler, & Hussong, 1994).
Individual Differences in EDR
Individual differences in EDR appear to be heritable. Twin studies demonstrate that genetic factors account for approximately half of the variation in electrodermal activity (Tuvblad et al., 2010; Tuvblad et al., 2012; Lykken, Iacono, Haroian, McGue, & Bouchard, 1988). Moreover, common genetic influences explain the overlap between resting and task-induced levels of electrodermal activity (Crider et al., 2004). Few twin studies have examined SCR parameters specifically related to the elicitation and habituation of orienting responses. In a notable study that included twins reared together as well as apart, Lykken et al. (1988) reported that a variety of SCR parameters - ranging from orienting reactivity to habituation rate – are moderately heritable. Family-wide environmental influences were negligible for all electrodermal variables under examination, a result that has been replicated in subsequent twin studies of EDR (Tuvblad et al., 2012; Crider et al., 2004; Hettema, Annas, Neale, Kendler, & Fredrikson, 2003).
Given that EDR measures are both heritable and associated with externalizing problems, it is tempting to consider whether hyporeactivity is a marker indexing genetic risk for psychophysiological processes that underlie externalizing psychopathology (Iacono, 1998). According to an information processing account of electrodermal response lability, EDR reflects individual differences in the overt expression of antagonistic impulses (Crider, 2008). Reduced lability (i.e., hyporeactivity) represents an impaired capacity to summon cognitive resources in the service of exercising self-control. As a result, EDR characteristics might be more proximate to the neurological mechanisms responsible for behavioral disinhibition. That is, the genetic diathesis for externalizing psychopathology may be partially mediated by genetic influences acting on EDR. At the very least, the etiology of EDR is presumably less complex than that for externalizing psychopathology. If true, this could facilitate the identification of specific risk factors.
There is indirect evidence that reduced EDR is a psychophysiological marker reflecting genetic risk for antisocial behavior. Biological fathers of boys with conduct disorder exhibit smaller SCRs to various pictorial stimuli as compared to the fathers of healthy boys (Herpertz et al., 2007). Not surprisingly, the former also show greater trait aggression than the fathers of non-disordered boys. This suggests that the familial transmission of EDR and externalizing problems is linked. There is also some evidence that electrodermal hyporeactivity temporally precedes externalizing problems, insomuch that it predicts the future development of criminal behavior in male schoolchildren (Raine et al., 1990).
Present Goals
We measured two commonly employed indices of EDR from a standard habituation paradigm: response frequency (number of SCRs) and mean SCR amplitude to a series of tones. These measures were selected in order to address the following question: Are individual differences in the EDR/Externalizing association best characterized in terms of the size of the orienting reaction, or rather the frequency with which one responds? Using several cohorts of adolescent twins, we examined the genetic and environmental structure of these measures under the assumption that the more heritable of the two would be a more promising/reliable psychophysiological marker. We also assessed the extent to which mean amplitude and frequency covary. Although previous investigations have indicated that the two variables are positively correlated (e.g., Martin & Rust, 1976), the genetic and environmental sources of this association are unclear. Finally, whereas most prior research has focused on males or been underpowered to examine sex differences, we included large numbers of both male and female participants.
Building on previous literature, our hypothesis was that response frequency would be inversely associated with externalizing liability (EXT). Several studies have indicated that response frequency is a more robust correlate of antisocial behavior than is mean SCR amplitude (Raine & Venables, 1984; Raine et al., 1990; Raine et al., 1997). We estimated EXT through a latent factor composed of substance-related problems and aggressive-undercontrolled behaviors. Standard biometric modeling was used to assess the genetic and environmental contributions to the overlap between EDR and EXT. We hypothesized that the genes associated with reductions in EDR might reflect autonomic or brain mechanisms that predispose individuals to externalizing psychopathology. As a result, we were particularly interested in the extent to which risk for EXT is mediated by genetic influences on EDR.
Method
Participants
Participants were recruited from community-based samples of twins from the state of Minnesota. Demographic characteristics and recruitment goals of the Minnesota Twin Family Study (MTFS) are provided elsewhere (Iacono & McGue, 2002; Iacono, Carlson, Taylor, Elkins, & McGue, 1999). In brief, the MTFS is a longitudinal investigation of the development of substance use disorders. It includes two age cohorts of same-sex twins who are largely of European-American origin (98% Caucasian). The younger cohort was initially recruited at age 11, while the older cohort was recruited at age 17. In the case of the older cohort, male participants were born in the years 1972–1978, while females were born between 1975 and 1979. For the younger cohort, males were born in the years 1978–1982, and females were born between 1981 and 1984.
All psychophysiological data in the present report were obtained from participants when they were 17–18 years of age (M = 17.83, SD = 0.69). As such, data were obtained from the younger cohort during their second follow-up assessment. These “age 11 cohort” twins were slightly older (M = 18.16, SD = 0.70) than the “age 17 cohort” twins at the time of their intake assessment (M = 17.48, SD = 0.46). A total of 2179 twins (from 1102 families) underwent psychophysiological testing, of whom 2129 ultimately had valid electrodermal data from the habituation paradigm. A majority of twins (n = 1417) were identified as monozygotic, and 762 twins were dizygotic, a 2:1 ratio that is supported by the different twinning rates in the Minnesota population (Hur, McGue, & Iacono, 1995). Zygosity determination was initially based on the agreement of three estimates: 1) a zygosity questionnaire completed by parents, 2) evaluation by MTFS staff of the twins’ physical resemblance, and 3) similarity of cephalic index, fingerprint ridge count, and ponderal index. This determination was subsequently confirmed or adjusted using genetic markers obtained from DNA provided by participants.
Habituation Paradigm
Participants were asked to focus their attention on a closed-captioned film while a sequence of fifteen 1000 Hz tones was presented through headphones. They were specifically instructed to disregard the distracting tones (Iacono & Lykken, 1979). All stimuli had rise and fall times of 20 ms, and durations of 500 ms. Inter-trial intervals ranged from 45 to 75 s, with a mean interval of 60 s. A constant 55 dB background noise was used to mask extraneous sounds.
For participants tested prior to May 5, 1995, the tones were presented at an intensity of 101.5 dB. A new audio system was installed on May 5, 1995, after which the tones were presented at 105 dB. The average intensity of the stimuli differed between cohorts. All but 44 participants from the older male cohort (92.2%) received the tones at 101.5 dB. Nearly half (45%) of female participants from the older cohort (n = 278) experienced the tones at 101.5 dB. The remaining female twins and all of the younger cohort twins were tested after May 5, 1995, and thus received the tones at 105 dB.
Recording System
Skin conductance was recorded using a pair of bipolar electrodes. The four Ag-AgCl electrodes were 1 cm in diameter. A paste consisting of 0.5 molar NaCl electrolyte mixed with Unibase cream served as the conducting medium. The electrodes were attached to both hands on the distal phalanges of the index and ring fingers, creating a contact surface of 0.8 cm2 on each fingertip. Participants washed their hands with Ivory soap before the electrodes were attached. A constant voltage of 0.5 V was passed across the electrodes, and the output signal was recorded through DC amps on a Grass Model 12A Neurodata acquisition system. The sampling rate was 256 Hz. Data were filtered with a 3 Hz low-pass filter and amplified 5,000 times.
Skin Conductance Parameters
After digitization, the skin conductance output was smoothed and scored algorithmically by computer and then subjected to manual inspection. The algorithm marked two time points following each trial: latency (associated with the response start) and a rise time (associated with the response peak). A response peak was marked whenever the slope of the signal changed from positive to negative; it corresponded to the x-intercept of the derivative. Next, a response start was marked where a preceding positive acceleration was detected. These points were then reviewed via manual inspection of the waveforms, and adjusted if necessary.
Amplitude was defined as the difference between skin conductance at response peak and response onset. SCR amplitudes in excess of .01 microsiemens (μS) constituted a response. (We chose a minimum threshold of .01 μS due to the observation that many subjects routinely exhibited responses < .05 μS prior to eventually habituating to the tones. We did not want to treat these participants as non-responders, as it would preclude the calculation of mean SCR amplitude.) Additional criteria were that the response must begin within 1 to 4 s post-stimulus, and that the rise time (i.e., the time elapsing between the response start and peak) occur within 1 to 5 s. If these criteria were not met, or if no valid response peaks and onsets were detected, then a non-response was entered for that trial (i.e., the SCR magnitude associated with that trial was scored as zero).
SCR magnitudes were averaged across the left and right hands. Technical difficulties and recording errors accounted for some missing data, but it was rare that data from both hands were unusable. A few participants were excluded due to hearing impairments (n = 4) or lack of alertness during the task (n = 5). Additionally, coders were trained to identify sudden changes in the skin conductance recording that likely stemmed from non-physiological artifacts. A computer algorithm identified trials in which there were more than 6 SCRs within a 20 s window, and this typically coincided with trials that coders had independently deemed ‘noisy’. We excluded all noisy trials from our analyses.
Fewer than 3% of participants (n = 61) were missing one or more data points. Participants who lacked information on the first and/or second trials were automatically excluded from analyses. We were able to impute missing values as zero if the trials adjacent to the relevant trial were non-responses. If data were still missing, then summary statistics were not computed for that subject. Altogether, 2129 of the 2179 participants who underwent psychophysiological testing (97.7%) had valid data.
Skin conductance level (SCL) was averaged over the 5 s immediately preceding the first tone of the habituation task in order to obtain a basal measure of electrodermal activity. Owing to rightward skew, baseline SCL was square-root transformed. Phasic electrodermal activity during the habituation task was measured in two ways: number of SCRs (response frequency) and mean SCR amplitude. It must be emphasized that we distinguish ‘mean SCR amplitude’ from ‘mean SCR magnitude’ (see Dawson, Schell, & Filion, 2007). Mean response amplitude refers to the average amplitude across all trials for which there were valid responses (i.e., SCRs in excess of .01 μS). Trials for which there was no SCR were omitted from this computation. As a result, participants did not possess valid mean amplitudes if they did not respond to a single tone. (For mean SCR magnitude, non-responses assume a value of zero rather than treated as missing). Amplitudes were subjected to a square-root transformation to correct for positive skew. Response frequency is simply a count of the number of responses (out of 15).
Externalizing Liability
Latent externalizing liability was obtained for each participant based on a factor score capturing alcohol consumption, alcohol dependence, illicit substance use/dependence, nicotine use/dependence, and behavioral disinhibition. A full description of these five constructs and their derivation is provided by Hicks et al. (2011). Substance-related information was assessed through the Substance Abuse Module of the Composite International Diagnostic Interview (Robins, Baber, & Cottler, 1987). Behavioral disinhibition was based on lifetime criteria of antisocial/delinquent behavior as well as self-report measures of aggression and undercontrol from the Multidimensional Personality Questionnaire (Tellegen & Waller, 2008). Given that the five facets are highly interrelated, a higher-order externalizing factor accounts for approximately 75% of the variance in each of the facets (Hicks et al., 2011). Biometric modeling revealed that this externalizing liability is 62% heritable, and explains 80% of the genetic variance in each of the five facets. We extracted factor scores for each subject from Mplus (Muthen & Muthen, 2007), and then used a normalizing (Blom) transformation to obtain a normal distribution of externalizing liability.
Statistical Analyses
Standard twin models were fit to the raw data in Mx (Neale, Boker, Xie, & Maes, 2006), a structural equation modeling program. This permitted us to determine the relative importance of genetic and environmental influences on each phenotype, and to test competing models of the etiological overlap between the various phenotypes. All analyses were based on an extension of the standard ACE model (Neale & Cardon, 1992), in which individual differences are partitioned into three latent factors: additive genetic (A), shared environmental (C), and nonshared environmental (E). Since monozygotic (MZ) twins inherit all of their genetic material in common, and dizygotic (DZ) twins share half of their alleles on average, the additive genetic (A) correlations between co-twins are 1.0 and 0.5 for MZ and DZ twins, respectively. Shared environmental effects represent family-wide factors that contribute to twin similarity. Finally, nonshared environmental factors capture individual-specific experiences and measurement error.
Cholesky decomposition of the variance/covariance matrices was used to delineate the extent to which etiological influences are common across phenotypes or specific to a given phenotype. Figure 1 depicts a trivariate Cholesky model in which the primary sets of factors (A1 and E1) represent the genetic and environmental influences common to all three phenotypes: response frequency, amplitude, and externalizing liability (EXT). Paths emanating from the second factor (e.g., a22 and e22) represent genetic and environmental influences that are independent of response frequency. The third set of factors captures all influences specific to EXT, i.e., unexplained by the preceding factors. Shared environmental factors (C1, C2, and C3) follow the same scheme, but are not completely shown in Figure 1 for ease of presentation.
Figure 1.

Path diagram of a trivariate Cholesky model. Additive genetic (A) and nonshared environmental (E) factors influence all three phenotypes. Shared environmental (C) influences are only shown for externalizing liability (EXT) for the sake of simplicity. A1 and E1 represent variances shared by all three phenotypes. A2 and E2 represent variances shared by SCR amplitude and EXT, independent of that shared with response frequency. A3, C3, and E3 reflect all influences specific to EXT.
In order to test specific hypotheses about the relations among electrodermal reactivity and externalizing liability, various submodels were progressively fit to the data. The optimal submodel was selected on the basis of Akaike’s Information Criterion (AIC; Akaike, 1987), which is calculated as −2LL (log likelihood) minus twice its degrees of freedom. Models with a more negative AIC are superior, as they represent a better balance of parsimony and goodness of fit.
The significance of a parameter was tested through a chi-square (χ2) difference test, which compares the goodness-of-fit (−2LL) of the reduced model to that of a fuller model. For example, if the a22 path can be constrained to zero without significant loss of fit, then we cannot reject the hypothesis that the heritability of response amplitude is entirely explained by genetic factors that also operate on response frequency. Diagonal paths (a21, a31, a32, etc.) represent the genetic and environmental covariances between phenotypes. Thus, the significance of a32 and e32 indicate whether associations between response amplitude and EXT persist after taking into account factors in common with response frequency. The magnitude of genetic overlap between two phenotypes is expressed as a genetic correlation (rg), which is obtained by standardizing the genetic covariance with respect to the genetic variance of the two phenotypes. A similar procedure is used to obtain the environmental correlation (re) between phenotypes.
Analyses were carried out using a full-information maximum likelihood technique. Thus, cases in which there was some missing data or where information was obligatorily lacking (e.g., non-responding participants without measurable SCR amplitudes) were still retained for all analyses. The main effect of tone intensity on electrodermal reactivity was removed by regressing loudness (105 dB = ‘0’; 101.5 dB = ‘1’) on each electrodermal measure using the definition variable feature in Mx (Neale et al., 2006). All other statistical tests were performed in SPSS Version 18 (SPSS Inc., Chicago, IL) while recognizing the twin clustering of the data. Specifically, regression analyses in SPSS were performed using linear mixed-effects models where observations were treated as repeated measures within each twin pair.
Results
Descriptive Statistics
Sixty-six participants (3.1% of the total sample) were non-responders across the 15 stimulus presentations. The proportion of non-responders ranged from 2.5% in younger cohort males to 4.0% in older cohort males. On the other hand, 6.7% of participants (n = 143) were persistent responders who produced an SCR on every trial.
Participants showed evidence of habituation over the course of trials (see Figure 2) with a sharp decrement in response magnitude evident in the first few trials followed by relatively stable lower level responding. Response frequency was highly correlated (Pearson’s r = .90) with a ‘trials to criterion’ measure of habituation; i.e., number of responses elapsing until two consecutive non-responses. Unlike response frequency, however, ‘trials to criterion’ suffered from an unacceptably high degree of right censorship (28% of the sample failed to habituate), rendering this measure relatively insensitive to individual differences.
Figure 2.
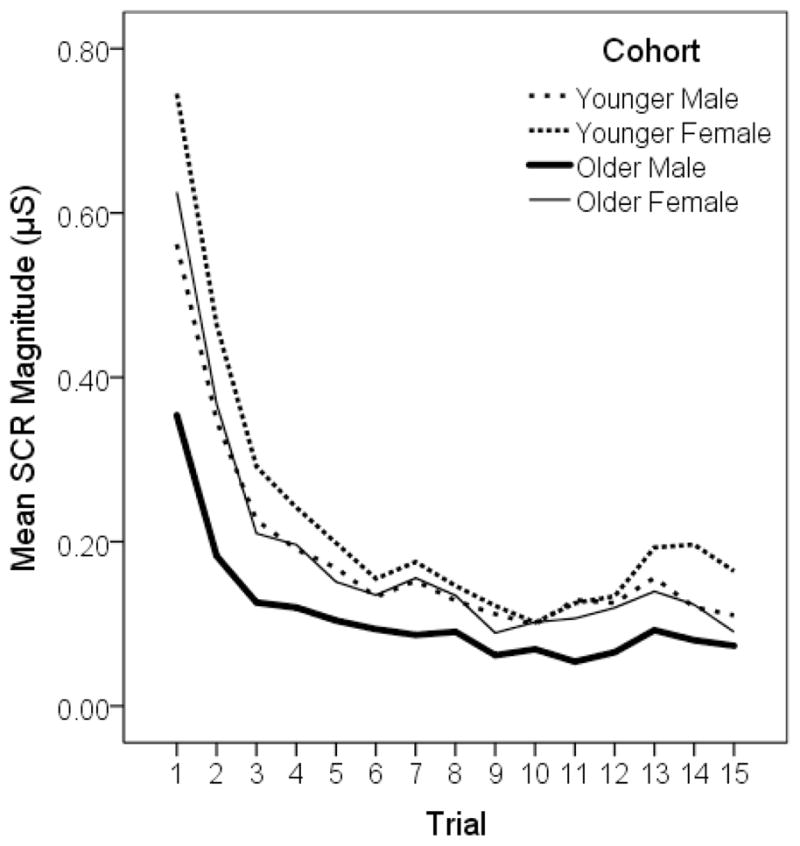
Mean skin conductance responses to 15 tones.
Unbiased estimates of the means and variances for each phenotype were obtained from univariate models in Mx, where the twin covariances were freely estimated instead of adhering to a particular structure. Descriptive statistics for these measures are reported in Table 1. Preliminary analyses revealed that the means and variances were equivalent across MZ and DZ twins in each of the four cohorts. However, there were significant cross-cohort differences in mean SCR amplitude. Means and variances of SCR amplitude could neither be constrained to equality across sex nor age cohort, p’s < .01. Response frequency, on the other hand, was successfully constrained to equality across all four cohorts; this applied to both the mean [Δχ2(3) = 5.47, p = .14] and the variance [Δχ2(3) = 3.55, p = .32].
Table 1.
Means and Standard Deviations of the Study Variables
| Cohort | Variables | |||
|---|---|---|---|---|
| Number of Responses | Mean SCR Amplitudea | Skin Conductance Level | Externalizing Liabilitya | |
| Younger Male N = 478 – 489 | 8.78 (4.34) | 0.47 (0.21) | 1.95 (0.43) | 0.37 (1.03) |
| Younger Female N = 480 – 493 | 8.24 (4.72) | 0.54 (0.25) | 1.91 (0.43) | −0.20 (0.93) |
| Older Male N = 528 – 550 | 8.00 (4.38) | 0.38 (0.16) | 1.89 (0.44) | 0.15 (0.88) |
| Older Female N = 581 – 597 | 8.45 (4.50) | 0.50 (0.20) | 1.95 (0.38) | −0.27 (1.00) |
Note. Participants in both age cohorts were 17–18 years old. Mean SCR amplitude and skin conductance level are measured in microsiemens (μS), and are square-root transformed. N is the range in sample sizes across the electrodermal measures.
Mean values are significantly different across cohorts, p < .01.
The smaller SCR magnitudes observed in males within each age cohort (as seen in Figure 2) appear to be a consequence of their lower SCR amplitudes rather than a reduced frequency of responding. Moreover, the lower amplitudes in the older male cohort may stem from the fact that these participants mostly experienced the tones at 101.5 dB rather than 105 dB. A straightforward evaluation of sex differences in amplitude was conducted through a comparison of the two younger cohorts, as all participants received the tones at the same 105 dB intensity, with the results confirming that males were less reactive, Δχ2(1) = 17.18, p < .01, d = −0.30.
Not surprisingly, there were significant cohort differences in externalizing liability (EXT). Males had substantially higher scores than did females. Less expectedly, younger cohort males possessed a higher externalizing liability than their older cohort counterparts, Δχ2(1) = 8.86, p < .01, d = 0.23. As with response frequency, there were no significant differences in mean SCL across the four cohorts.
Phenotypic Correlations
Associations among the three electrodermal variables were all positive, as can be seen in Table 2. The two phasic measures - response frequency and mean SCR amplitude - were only moderately correlated, suggesting that they tap into somewhat distinct processes. Indeed, with the exception of the older cohort males, SCL was just as strongly correlated with these two measures as the latter were correlated between themselves. Response frequency was consistently and inversely associated with externalizing liability (EXT), explaining 2 – 4% of the variance in EXT. Associations between EXT and mean amplitude were more modest, only reaching statistical significance in males. Given that amplitude and frequency overlap to some extent, we entered these two measures in a linear regression model predicting EXT. Results in all four twin cohorts indicated that response frequency, but not amplitude, independently predicted EXT. Since SCR amplitude to the leading tone (trial 1) may be a more appropriate index of orienting reactivity than the mean response across all 15 trials, we also regressed the former on EXT. Trial 1 amplitude failed to associate with EXT in all but one group: younger cohort males, t(373) = −3.32, p < .01. However, the estimated correlation coefficient was small: r = −.12.
Table 2.
Phenotypic Correlations in Younger Cohort Twins (top) and Older Cohort Twins (bottom)
| Younger Cohort | Frequency | Amplitude | SCL | EXT |
|---|---|---|---|---|
| Frequency | ----- | .40 | .45 | −.14 |
| Amplitude | .45 | ----- | .48 | −.09 |
| SCL | .37 | .48 | ----- | −.07 |
| EXT | −.15 | −.10 | .03 | ----- |
| Older Cohort | ||||
| Frequency | ----- | .36 | .43 | −.20 |
| Amplitude | .43 | ----- | .36 | −.04 |
| SCL | .29 | .29 | ----- | −.19 |
| EXT | −.17 | −.11 | −.03 | ----- |
Note. Males are listed below diagonal; females above diagonal. Significant correlations (p < .05) are in boldface. Frequency = number of SCRs; Amplitude = mean SCR amplitude; SCL = skin conductance level; EXT = externalizing liability.
We were also interested in the association between SCL and EXT. Since SCL represents basal electrodermal activity rather than reactions to psychological stimulation, we expected SCL to be unrelated to EXT. SCL was associated with EXT in only a single group: older cohort females. A follow-up regression analysis indicated that the link between response frequency and EXT in this group persists after controlling for SCL, t(511) = −3.52, p < .01 . This assured us that the role of electrodermal reactivity as a potential psychophysiological marker for EXT is not a by-product of underarousal. As a result, we pay no further attention to SCL in subsequent analyses.
Twin Correlations
Intraclass twin correlations for electrodermal response variables and EXT are listed in Table 3. The pattern of correlations provides an informal gauge of the relative magnitude of genetic and environmental influences on each trait. When intraclass correlations in MZ twins are approximately twice that of DZ twins, additive genetic factors are indicated. Shared environmental components are suggested when the MZ twin correlation is less than twice the magnitude of the DZ twin correlation. A glance at Table 3 suggests that genetic factors are present for all three phenotypes, as the MZ correlation exceeds the DZ correlation in all cases. Furthermore, there appear to be shared environmental influences on EXT.
Table 3.
Intraclass Twin Correlations
| Variable | Younger Males | Younger Females | Older Males | Older Females | ||||
|---|---|---|---|---|---|---|---|---|
| MZ | DZ | MZ | DZ | MZ | DZ | MZ | DZ | |
| Response frequency | .54 | .08a | .56 | .27 | .50 | .25 | .57 | .35 |
| SCR amplitude | .53 | .33 | .51 | .31 | .59 | .40 | .35 | .16a |
| EXT | .86 | .58 | .77 | .54 | .80 | .50 | .77 | .61 |
Correlation is not significant (p > .05).
A formal treatment of the genetic and environmental contributions to each phenotype through structural equation modeling corroborated these suspicions. In the interest of brevity, we present a condensed summary of findings from our univariate model-fitting procedure. Consistent with preliminary analyses, response frequency was invariant across the four cohorts, while mean SCR amplitude and EXT significantly differed across groups with respect to both the mean and variance. With cohorts combined, a model of additive genetic (A) and nonshared environmental (E) factors (i.e., an AE Model) best accounted for individual differences in response frequency, given that shared environmental (C) influences were absent, Δχ2(1) = 0.00. The heritability estimate was .55 (95% confidence interval: .49 – .59), and the standardized environmental estimate was .45 (95% confidence interval: .41 – .51). Similarly, an AE model best fit the mean SCR amplitude data in each cohort (results available upon request).
A more complex picture emerged for the etiology of externalizing liability. As Hicks et al. (2011) have shown, EXT receives contributions from all three ACE components: additive genetic, shared environmental, and nonshared environmental. Point-estimates of A and C differed widely across cohorts, but in each case, the best-fitting model (as selected on the basis of Akaike’s information criterion) retained all three ACE components. The proportion of phenotypic variance attributable to nonshared environmental influences was more consistent across the cohorts, ranging from 14% to 23%.
Trivariate Structure
We next examined the genetic and environmental structure of the covariance between EDR and EXT. This biometric approach is superior to our phenotypic analyses because we are interested in whether electrodermal hyporeactivity, as a possible biological marker, indexes genetic risk for EXT. Genetic/environmental correlations are more informative than phenotypic correlations because the former can help isolate the causes of an association, while the latter may be diluted by sources of variation (e.g., shared environmental influences on EXT) that are not etiologically parallel between two phenotypes. That is, genetic correlations only estimate overlap in the genetic signal, rather than encompassing all sources of variance/covariance.
Our baseline model was a trivariate Cholesky parameterization (see Figure 1) in which all parameters freely varied across cohorts. Given that we failed to observe shared environmental influences on EDR measures, the C parameter is confined to EXT. The particular order of the variables, in which SCR frequency precedes mean amplitude, was chosen due to prior evidence that SCR amplitude does not exert any independent influences on EXT over and above response frequency. In order to test specific hypotheses about the covariances among the three measures, we fit several submodels to the data. Relevant fit statistics are reported in Table 4.
Table 4.
Trivariate Model-fitting Results
| Model | Hypothesis | −2LL | df | AIC | Δχ2 | Δdf | pΔ |
|---|---|---|---|---|---|---|---|
| 1 | Base model (depicted in Figure 1) | 33902.54 | 6294 | 21314.54 | |||
| 2 vs 1 | No association between amplitude and EXT | 33907.37 | 6302 | 21303.37 | 4.83 | 8 | .78 |
| 3 vs 2 | No specific genetic influences on amplitude | 34047.04 | 6306 | 21435.04 | 139.67 | 4 | < .01 |
| 4 vs 2 | No genetic covariance between frequency & EXT | 33931.16 | 6306 | 21319.16 | 23.79 | 4 | < .01 |
| 5 vs 2 | No nonshared environmental covariance between frequency & EXT | 33921.30 | 6306 | 21309.30 | 13.94 | 4 | .01 |
Note. −2LL is a goodness-of-fit statistic; df = degrees of freedom; AIC = Akaike’s Information Criterion; pΔ is the significance value of a given χ2-difference test.
In the first submodel (Model 2), we sought to confirm the lack of overlap between mean amplitude and EXT (after removing influences in common with response frequency). That is, we dropped the genetic and environmental covariance parameters specific to SCR amplitude: a32 and e32. This was accomplished without significant loss of fit, Δχ2(8) = 4.83; p = .78. Next, we examined whether there are specific genetic influences on SCR amplitude. This was tested by constraining a22 to zero in Model 3. The resultant fit was significantly worse, indicating that the constructs of amplitude and frequency are not genetically indistinct. As can be seen in Table 5, genetic correlations (rg) between response frequency and amplitude are moderately high, but do not approach unity in any cohort. Environmental correlations (re) were smaller in magnitude, reflecting the fact that genetic factors account for most (61–67%) of the observed overlap between frequency and amplitude.
Table 5.
Standardized Estimates of Genetic and Nonshared Environmental Covariance
| Covariance between response frequency and SCR amplitude | Covariance between response frequency and EXT | |||
|---|---|---|---|---|
| rg | re | rg | re | |
| Younger Male Cohort | .56 (.40, .70) | .32 (.18, .45) | −.18 (−.37, .01) | −.18 (−.33, −.03) |
| Younger Female Cohort | .48 (.31, .64) | .31 (.16, .44) | −.25 (−.50, −.04) | −.03 (−.19, .12) |
| Older Male Cohort | .50 (.34, .64) | .35 (.22, .47) | −.23 (−.41, −.05) | −.13 (−.27, .01) |
| Older Female Cohort | .50 (.30, .69) | .26 (.13, .38) | −.31 (−.57, −.10) | −.15 (−.28, −.02) |
Note. rg = genetic correlation; re = nonshared environmental correlation. 95% confidence interval around each estimate is in parentheses.
Finally, we examined the genetic and environmental contributions to the association between response frequency and EXT. This was accomplished by constraining to zero the genetic covariance (a31) and environmental covariance (e31) parameters in Model 4 and Model 5, respectively (see Table 4). The hypothesis that there is no overlap in their genetic and environmental etiology could be rejected, p’s ≤ .01. However, the pattern of overlap was more complex when we investigated each cohort separately rather than conducting an omnibus test across the four cohorts. As can be seen in Table 5, the genetic correlation between response frequency and EXT was significant in every cohort except the younger male twins. Although the genetic correlations are quite modest, they are larger than their associated phenotypic correlations. In all four cohorts, a large majority (67–92%) of the phenotypic association could be explained by genetic factors common to both phenotypes. Additionally, there was significant environmental overlap in two cohorts: younger male and older female twins. Environmental contributions accounted for 33% and 26% of the phenotypic association in these two cohorts, respectively.
Discussion
We focused on two electrodermal measures to characterize individual differences in electrodermal reactivity (EDR) within an auditory habituation paradigm: number of SCRs (response frequency) and mean SCR amplitude. Our ultimate goal was to assess whether these EDR characteristics were related to risk for externalizing psychopathology. A latent externalizing liability (EXT) was indexed through substance use/abuse – alcohol, nicotine, and illicit drugs - as well as measures of behavioral disinhibition. The stimuli we used were loud tones that successfully elicited responses in the vast majority of participants. Our sample comprised 2129 individuals from four independent cohorts of male and female twins. As such, this represents one of the largest studies, twin or otherwise, to utilize electrodermal measures.
Previous literature has documented a robust inverse association between antisocial behavior and skin conductance orienting responsiveness in youth (Raine et al., 1997; Herpertz et al., 2001; Herpertz et al., 2003). Thus, we hypothesized that EDR would be negatively correlated with EXT. In a remarkable instance of internal replication, we observed this result in all four twin cohorts. Of the two EDR measures, only response frequency was reliably associated with EXT. Mean SCR amplitude was not related to EXT, at least not after controlling for response frequency. This provides initial support that reduced electrodermal responsiveness may be a marker for the psychophysiological processes underlying EXT.
In order to understand the etiology of electrodermal hyporeactivity, we performed standard biometric analyses of the twin data. Our analyses revealed that the two EDR measures are moderately heritable and are unaffected by shared environmental influences, in line with results from previous twin studies (Lykken et al., 1988; Tuvblad et al., 2012). Specifically, the heritability of response frequency was 55%; estimates were highly similar across the four cohorts and could be constrained to equality. Observed variances in mean SCR amplitude significantly differed across cohorts, in part due to minor disparities in the intensity at which the older and younger cohorts heard the tones. Unlike response frequency, there were significant sex differences in mean SCR amplitude, with females showing greater reactivity.
The etiology of EXT differed from the EDR measures insomuch that we detected shared environmental influences on the former. Our trivariate biometric approach permitted us to assess the degree of overlap between their genetic and nonshared environmental influences. Although there were slight cross-cohort differences in the magnitude of genetic and environmental correlations between response frequency and EXT, the overall inverse association was consistent. At least two-thirds of the observed overlap between response frequency and EXT could be explained by genetic factors common to both phenotypes. Barring the younger male cohort (in which the genetic correlation was not statistically significant), genetic influences on response frequency accounted for 5–10% of the genetic risk for EXT. This suggests that the mechanisms responsible for reduced electrodermal responsiveness also contribute to externalizing.
Response Frequency vs. Amplitude
The consistently positive association between response frequency and mean SCR amplitude indicates that individuals who respond less frequently to tones tend to exhibit smaller amplitudes on the trials to which they do respond. The overlap between response frequency and amplitude was mainly explained by genetic factors common to both phenotypes. However, the genetic correlation (rg) did not approach unity, suggesting that these measures are distinct at some level. Indeed, the very fact that response frequency, but not mean SCR amplitude, was associated with EXT indicates that these measures function somewhat differently.
The psychological determinants of these two measures may not completely coincide. We implicitly argue that response frequency captures individual differences in habituation, whereas mean SCR amplitude reflects something different. A standard habituation measure – number of trials to a criterion of two consecutive non-responses – was very highly correlated with response frequency. In order to avoid a tangential discussion, we will not elaborate on the issue of how one can best operationalize habituation. We merely acknowledge that response frequency functions much like a ‘trials to criterion’ measure of habituation rate. Given that we used an habituation paradigm, it is almost certain that reduced SCR frequency reflects faster habituation.
If response frequency taps into the central process of habituation, then it presumably indexes stable psychological properties. Similar inferences cannot readily be made for mean SCR amplitude. The latter may be more sensitive to various peripheral factors such as sweat gland density and length of sweat ducts, which although heritable, may be of dubious psychological relevance. It is common to subject SCR magnitudes/amplitudes to range correction for these very reasons (see Lykken, Rose, Luther, & Maley, 1966). If the reactive strength of the electrodermal system is indeed primarily influenced by peripheral anatomical factors, then this should militate against our use of an amplitude measure, based as it is on the absolute size of participants’ responses.
In the present study, SCR frequency was a less “temperamental” measure, insomuch that it did not differ across sex and was not affected by slight differences in tone intensity. This is in contrast to SCR amplitude, which was much enhanced during stimulus presentations of 105 dB versus 101.5 dB. Prior studies have noted the apparent “temperamentality” of mean SCR amplitude. Scerbo, Freedman, Raine, Dawson, and Venables (1992) showed that the issue of electrode placement (i.e., whether SCR is recorded from distal or medial sites of the finger) is not a trivial matter. Mean SCR amplitude to orienting stimuli was increased by a ratio of 3.5 to 1 when the distal site was used, a much larger effect than that observed for SCR frequency (where a ratio of 1.2 to 1 was obtained). In a follow-up study, Freedman et al. (1994) showed that the observed difference in response frequency between distal and medial sites was mediated by differences in the palmar sweat index (i.e., the number of active sweat glands) between sites. However, the palmar sweat index could not account for site differences in mean SCR amplitude. This indicates that SCR amplitude is affected by unknown extraneous factors associated with electrode placement, reinforcing our view that this measure is limited in generalizability and psychological meaningfulness.
Strengths
The large sample size, and the use of four independent twin cohorts, is a key strength of our study. With only minor deviations, we managed to replicate our results in each twin cohort. To our knowledge, this is the first study to examine genetic and environmental contributions to the association between EDR and externalizing psychopathology. Indeed, only Hettema, Annas, Neale, Fredrikson, and Kendler (2008) have examined the genetic covariation between an electrodermal measure and a behavioral/psychiatric phenotype.
Another advantage is that we studied female as well as male twins. Females are often underrepresented in investigations of externalizing disorders. The limited literature available suggests that the association between reduced EDR and externalizing psychopathology is lacking in females (Isen et al., 2010; Sylvers et al., 2010). In the present study, by contrast, we found that electrodermal hyporeactivity was predictive of EXT in females as much as males. We believe that this inconsistency between studies may partly stem from our improved measurement of externalizing psychopathology. Instead of focusing exclusively on antisocial traits, we employed a general externalizing liability score with excellent psychometric properties and construct validity. A fortuitous by-product of this approach is that the distribution of scores is nearly normal, whereas the distribution of any single phenotype (e.g., antisocial behavior) is much more highly skewed and kurtotic. By including a variety of externalizing indicators, we can avoid the restricted range that typically plagues community-based female samples. Indeed, certain externalizing outcomes such as nicotine use and early initiation of sexual intercourse may exhibit little to no sex difference or even a female-biased prevalence, thereby capturing individual differences in females that would otherwise remain untapped.
Limitations and Future Directions
An important caveat is that our behavior genetic analyses do not assume the presence of gene-environment interaction. There is some evidence that early environmental enrichment may contribute to increased skin conductance orienting responses in later childhood (Raine et al., 2001). As such, it is possible that shared environmental experiences (e.g., socioeconomic status) interact with individuals’ genotypes to influence their electrodermal reactivity. Any gene-environment interactions of this nature, if not explicitly modeled, would be subsumed into our estimate of genetic influences. Were this the case, we may have overestimated the heritability of EDR. Our failure to detect shared environmental influences on EDR does not conclusively demonstrate that such influences are unimportant.
Another limitation of our study is that we did not examine non-externalizing measures of psychopathology. It is possible that electrodermal hyporeactivity reflects the operation of underlying mechanisms that are shared with other disorders besides those in the externalizing spectrum. Reduced orienting reactivity and accelerated rates of habituation have previously been linked to diverse disorders ranging from schizophrenia to mood disorders (Bernstein et al., 1988; Iacono, Ficken, & Beiser, 1999). Indeed, reduced SCR frequency may be an indicator of general psychopathology severity rather than a psychophysiological marker associated with a specific type of mental illness (Wahlund, Sorman, Gavazzeni, Fischer, & Kristiansson, 2010).
The functional significance of lower SCR frequency in those with higher EXT is unclear. Depending on the particular stimulus context, electrodermal hyporeactivity is thought to index low anxiety/fearlessness, on one hand, or attention problems and prefrontal impairment (Fowles, 2000; Raine, 2002). Given that the tones presented in our habituation paradigm were loud but non-aversive, it is unlikely that reduced SCR frequency is indexing a deficit in emotional reactivity. This would leave us with the second possibility – that individuals with higher EXT have attention problems that lead to deviant processing of novel events. However, we do not believe our results naturally lend themselves to an interpretation of abnormal allocation of attentional resources. After all, we explicitly instructed participants to ignore the meaningless tones.
Although a theoretical account of the observed association is not straightforward, a recent hypothesis posits that electrodermal response lability (including resistance to habituation) reflects individual differences in effortful self-control (see Crider, 2008). According to this perspective, electrodermal hyporeactivity indexes an attenuated capacity to inhibit antagonistic and other emotional impulses. This interpretation is derived from an information processing model of electrodermal responsiveness, and is supported by the observation that individuals with heightened response frequency are more successful at inhibiting prepotent behaviors on continuous performance tasks (Crider et al., 2004; Crider, 2008).
A useful future direction would be to supplement our EDR findings with information from more ‘central’ phenomena, such as brain-evoked potentials and neuropsychological performance. It has been argued that the neuroanatomical bases of electrodermal orienting are shared with the P3 component of brain-evoked potentials (see Nieuwenhuis, de Geus, & Aston-Jones, 2011). As such, faster habituation of the skin conductance orienting response should correspond to greater decrements in the ‘novelty-P3’ response, which is a more frontally-distributed component of event-related potentials (Friedman, Cycowicz, & Gaeta, 2001). Indeed, studies that have concurrently measured EDR and event-related potentials (ERPs) show that the same participants who demonstrate faster electrodermal habituation also tend to exhibit faster habituation of the ‘novelty-P3’ response (Jandl, Steyer, & Kaschka, 2010; Weisz & Czigler, 2006).
It may be interesting to tie our present findings to the literature on P3 amplitude reduction, as there is promising evidence that the latter is an endophenotype for externalizing psychopathology (Iacono & Malone, 2011; Iacono, Malone, & McGue, 2003; Hicks et al., 2007). It is unknown whether common processes underlie the reduction in P3 amplitude and electrodermal hyporeactivity. A major challenge of synthesizing these bodies of literature is the methodological differences in measuring ERPs and skin conductance. Unlike with skin conductance orienting responses, the faster time course and poor signal-to-noise ratio of ERPs do not lend themselves to a ‘count’ of discrete responses. Indeed, it would be bizarre to operationalize habituation of ‘novelty-P3’ in terms of response frequency, given that the P3 component never extinguishes entirely. Additionally, P3-EXT associations in the literature are usually based on “target” stimuli from an oddball paradigm, rather than on ignorable novel stimuli, as employed in our habituation paradigm. Nonetheless, we believe it is still fruitful to examine electrodermal and CNS components of the orienting response as a joint enterprise.
This study offers several insights into the measurement and conceptualization of electrodermal reactivity. We conclude that individual differences in EDR to nonsignal stimuli should best be conceptualized as a count of discrete responses. The strength of the orienting reaction, as measured by SCR amplitude, may not be as informative. Response frequency, on the other hand, is an elegantly simple measure that may hold great potential in identifying some of the factors that contribute to externalizing psychopathology.
Acknowledgments
This research was supported by the following grants from the National Institutes of Health: DA 05147, AA 09367, DA 024417, and DA 013240. Joshua Isen’s effort on this project was supported by T32 grant MH017069 from the National Institute of Mental Health. The first author would also like to acknowledge Ian B. McLaughlin, amongst several other research staff, for valuable assistance in data preparation.
References
- Akaike H. Factor analysis and AIC. Psychometrika. 1987;52:317–332. doi: 10.1007/BF02294359. [DOI] [Google Scholar]
- Bernstein AS, Riedel JA, Graae F, Seidman D, Steele H, Connolly J, Lubowsky J. Schizophrenia is associated with altered orienting activity; depression with electrodermal (cholinergic?) deficit and normal orienting response. Journal of Abnormal Psychology. 1988;97:3–12. doi: 10.1037/0021-843X.97.1.3. [DOI] [PubMed] [Google Scholar]
- Crider A. Personality and electrodermal response lability: An interpretation. Applied Psychophysiology and Biofeedback. 2008;33:141–148. doi: 10.1007/s10484-008-9057-y. [DOI] [PubMed] [Google Scholar]
- Crider A, Kremen WS, Xian H, Jacobson KC, Waterman B, Eisen SA, Tsuang MT, Lyons MJ. Stability, consistency, and heritability of electrodermal response lability in middle-aged male twins. Psychophysiology. 2004;41:501–509. doi: 10.1111/j.1469-8986.2004.00189.x. [DOI] [PubMed] [Google Scholar]
- Dawson ME, Schell AM, Filion DL. The electrodermal system. In: Cacioppo JT, Tassinary LG, Berntson GG, editors. Handbook of Psychophysiology. 3. New York: Cambridge University Press; 2007. pp. 159–181. [Google Scholar]
- Finn PR, Kessler DN, Hussong AM. Risk for alcoholism and classical conditioning to signals for punishment: evidence for a weak behavioral inhibition system? Journal of Abnormal Psychology. 1994;103:293–301. doi: 10.1037/0021-843X.103.2.293. [DOI] [PubMed] [Google Scholar]
- Finn PR, Zeitouni NC, Pihl RO. Effects of alcohol on psychophysiological hyperreactivity to nonaversive and aversive stimuli in men at high risk for alcoholism. Journal of Abnormal Psychology. 1990;99:79–85. doi: 10.1037/0021-843X.99.1.79. [DOI] [PubMed] [Google Scholar]
- Fowles D. Electrodermal hyporeactivity and antisocial behavior: does anxiety mediate the relationship. Journal of Affective Disorders. 2000;61:177–189. doi: 10.1016/S0165-0327(00)00336-0. [DOI] [PubMed] [Google Scholar]
- Freedman LW, Scerbo AS, Dawson ME, Raine A, McClure WO, Venables PH. The relationship of sweat gland count to electrodermal activity. Psychophysiology. 1994;31:196–200. doi: 10.1111/j.1469-8986.1994.tb01040.x. [DOI] [PubMed] [Google Scholar]
- Friedman D, Cycowicz YM, Gaeta H. The novelty P3: an event-related brain potential (ERP) sign of the brain’s evaluation of novelty. Neuroscience and Biobehavioral Reviews. 2001;25:355–373. doi: 10.1016/S0149-7634(01)00019-7. [DOI] [PubMed] [Google Scholar]
- Fung M, Raine A, Lynam D, Venables P, Loeber R, Steinhauer S, Stouthamer-Loeber M. Reduced electrodermal activity in psychopathy-prone adolescents. Journal of Abnormal Psychology. 2005;114:187–196. doi: 10.1037/0021-843X.114.2.187. [DOI] [PubMed] [Google Scholar]
- Herpertz SC, Mueller B, Wenning B, Qunaibi M, Lichterfeld C, Herpertz-Dahlmann B. Autonomic responses in boys with externalizing disorders. Journal of Neural Transmission. 2003;110:1181–1195. doi: 10.1007/s00702-003-0026-6. [DOI] [PubMed] [Google Scholar]
- Herpertz SC, Vloet T, Mueller B, Domes G, Willmes K, Herpertz-Dahlmann B. Similar autonomic responsivity in boys with conduct disorder and their fathers. Journal of the American Academy of Child &Adolescent Psychiatry. 2007;46:535–544. doi: 10.1097/chi.0b013e3180306286. [DOI] [PubMed] [Google Scholar]
- Herpertz SC, Wenning B, Mueller B, Qunaibi M, Sass H, Herpertz-Dahlmann B. Psychophysiological responses in ADHD boys with and without conduct disorder: implications for adult antisocial behavior. Journal of the American Academy of Child & Adolescent Psychiatry. 2001;40:1222–1230. doi: 10.1097/00004583-200110000-00017. [DOI] [PubMed] [Google Scholar]
- Hettema JM, Annas P, Neale MC, Fredrikson M, Kendler KS. The genetic covariation between fear conditioning and self-report fears. Biological Psychiatry. 2008;63:587–593. doi: 10.1016/j.biopsych.2007.06.009. [DOI] [PMC free article] [PubMed] [Google Scholar]
- Hettema JM, Annas P, Neale MC, Kendler KS, Fredrikson M. A twin study of the genetics of fear conditioning. Archives of General Psychiatry. 2003;60:702–708. doi: 10.1001/archpsyc.60.7.702. [DOI] [PubMed] [Google Scholar]
- Hicks BM, Bernat E, Malone SM, Iacono WG, Patrick CJ, Krueger RF, McGue M. Genes mediate the association between P3 amplitude and externalizing disorders. Psychophysiology. 2007;44:98–105. doi: 10.1111/j.1469-8986.2006.00471.x. [DOI] [PMC free article] [PubMed] [Google Scholar]
- Hicks BM, Krueger RF, Iacono WG, McGue M, Patrick CJ. Family transmission and heritability of externalizing disorders: a twin-family study. Archives of General Psychiatry. 2004;61:922–928. doi: 10.1001/archpsyc.61.9.922. [DOI] [PubMed] [Google Scholar]
- Hicks BM, Schalet BD, Malone SM, Iacono WG, McGue M. Psychometric and genetic architecture of substance use disorder and behavioral disinhibition measures for gene association studies. Behavior Genetics. 2011;41:459–475. doi: 10.1007/s10519-010-9417-2. [DOI] [PMC free article] [PubMed] [Google Scholar]
- Hur YM, McGue M, Iacono WG. Unequal rate of monozygotic and like-sex dizygotic twin birth: evidence from the Minnesota Twin Family Study. Behavior Genetics. 1995;25:337–340. doi: 10.1007/BF02197282. [DOI] [PubMed] [Google Scholar]
- Iacono WG. Identifying psychophysiological risk for psychopathology: examples from substance abuse and schizophrenia research. Psychophysiology. 1998;35:621–637. doi: 10.1111/1469-8986.3560621. [DOI] [PubMed] [Google Scholar]
- Iacono WG, Carlson SR, Taylor J, Elkins IJ, McGue M. Behavioral disinhibition and the development of substance-use disorders: findings from the Minnesota Twin Family Study. Development and Psychopathology. 1999;11:869–900. doi: 10.1017/S0954579499002369. [DOI] [PubMed] [Google Scholar]
- Iacono WG, Ficken JW, Beiser M. Electrodermal activation in first-episode psychotic patients and their first-degree relatives. Psychiatry Research. 1999;88:25–39. doi: 10.1016/S0165-1781(99)00071-2. [DOI] [PubMed] [Google Scholar]
- Iacono WG, Lykken DT. The orienting response: importance of instructions. Schizophrenia Bulletin. 1979;5:11–14. doi: 10.1093/schbul/5.1.11. [DOI] [PubMed] [Google Scholar]
- Iacono WG, Malone SM. Developmental endophenotypes: indexing genetic risk for substance abuse with the P300 brain event-related potential. Child Development Perspectives. 2011;5:239–247. doi: 10.1111/j.1750-8606.2011.00205.x. [DOI] [PMC free article] [PubMed] [Google Scholar]
- Iacono WG, Malone SM, McGue M. Substance use disorders, externalizing psychopathology, and P300 event-related potential amplitude. International Journal of Psychophysiology. 2003;48:147–178. doi: 10.1016/S0167-8760(03)00052-7. [DOI] [PubMed] [Google Scholar]
- Iacono WG, Malone SM, McGue M. Behavioral disinhibition and the development of early-onset addiction: common and specific influences. Annual Review of Clinical Psychology. 2008;4:325–348. doi: 10.1146/annurev.clinpsy.4.022007.141157. [DOI] [PubMed] [Google Scholar]
- Iacono WG, McGue M. Minnesota Twin Family Study. Twin Research. 2002;5:482–487. doi: 10.1375/136905202320906327. [DOI] [PubMed] [Google Scholar]
- Isen J, Raine A, Baker L, Dawson M, Bezdjian S, Lozano DI. Sex-specific association between psychopathic traits and electrodermal reactivity in children. Journal of Abnormal Psychology. 2010;119:216–225. doi: 10.1037/a0017777. [DOI] [PMC free article] [PubMed] [Google Scholar]
- Jandl M, Steyer J, Kaschka WP. Suicide risk markers in major depressive disorder: a study of electrodermal activity and event-related potentials. Journal of Affective Disorders. 2010;123:138–149. doi: 10.1016/j.jad.2009.09.011. [DOI] [PubMed] [Google Scholar]
- Kendler KS, Prescott CA, Myers J, Neale MC. The structure of genetic and environmental risk factors for common psychiatric and substance use disorders in men and women. Archives of General Psychiatry. 2003;60:929–937. doi: 10.1001/archpsyc.60.9.929. [DOI] [PubMed] [Google Scholar]
- Knott VJ, Bulmer DR. Effects of repetitive high intensity stimulation on electrodermal responsivity in male alcoholics and normal controls. Addictive Behaviors. 1985;10:181–185. doi: 10.1016/0306-4603(85)90025-5. [DOI] [PubMed] [Google Scholar]
- Krueger RF, Hicks BM, Patrick CJ, Carlson SR, Iacono WG, McGue M. Etiologic connections among substance dependence, antisocial behavior, and personality: modeling the externalizing spectrum. Journal of Abnormal Psychology. 2002;111:411–424. doi: 10.1037/0021-843X.111.3.411. [DOI] [PubMed] [Google Scholar]
- Lorber MF. Psychophysiology of aggression, psychopathy, and conduct problems: a meta-analysis. Psychological Bulletin. 2004;130:531–552. doi: 10.1037/0033-2909.130.4.531. [DOI] [PubMed] [Google Scholar]
- Lykken DT, Iacono WG, Haroian K, McGue M, Bouchard TJ. Habituation of the Skin-Conductance Response to Strong Stimuli - a Twin Study. Psychophysiology. 1988;25:4–15. doi: 10.1111/j.1469-8986.1988.tb00949.x. [DOI] [PubMed] [Google Scholar]
- Lykken DT, Rose R, Luther B, Maley M. Correcting psychophysiological measures for individual differences in range. Psychological Bulletin. 1966;66:481–484. doi: 10.1037/h0023922. [DOI] [PubMed] [Google Scholar]
- Martin I, Rust J. Habituation and the structure of the electrodermal system. Psychophysiology. 1976;13:554–562. doi: 10.1111/j.1469-8986.1976.tb00881.x. [DOI] [PubMed] [Google Scholar]
- Muthen LK, Muthen BO. Mplus users guide. 5. Los Angeles, CA: Muthen & Muthen; 1998–2007. [Google Scholar]
- Neale MC, Cardon LR. Methodology for genetic studies of twins and families. Dordrecht, Netherlands: Kluwer Academic Publisher; 1992. [Google Scholar]
- Neale MC, Boker SM, Xie G, Maes HH. Mx: statistical modeling. 7. Richmond, Virginia: Department of Psychiatry; 2006. [Google Scholar]
- Nieuwenhuis S, de Geus EJ, Aston-Jones G. The anatomical and functional relationship between the P3 and autonomic components of the orienting response. Psychophysiology. 2011;48:162–175. doi: 10.1111/j.1469-8986.2010.01057.x. [DOI] [PMC free article] [PubMed] [Google Scholar]
- Raine A. Biosocial studies of antisocial and violent behavior in children and adults: a review. Journal of Abnormal Child Psychology. 2002;30:311–326. doi: 10.1023/A:1015754122318. [DOI] [PubMed] [Google Scholar]
- Raine A, Reynolds C, Venables PH, Mednick S. Biosocial bases of aggressive behavior in childhood. In: Raine A, Brennan PA, Farrington DP, Mednick SA, editors. Biosocial bases of violence. New York: Plenum; 1997. pp. 107–126. [Google Scholar]
- Raine A, Venables PH. Electrodermal nonresponding, antisocial behavior, and schizoid tendencies in adolescents. Psychophysiology. 1984;21:424–433. doi: 10.1111/j.1469-8986.1984.tb00221.x. [DOI] [PubMed] [Google Scholar]
- Raine A, Venables PH, Dalais C, Mellingen K, Reynolds C, Mednick SA. Early educational and health enrichment at age 3–5 years is associated with increased autonomic and central nervous system arousal and orienting at age 11 years: evidence from the Mauritius Child Health Project. Psychophysiology. 2001;38:254–266. doi: 10.1111/1469-8986.3820254. [DOI] [PubMed] [Google Scholar]
- Raine A, Venables PH, Williams M. Autonomic orienting responses in 15-year-old male subjects and criminal behavior at age 24. American Journal of Psychiatry. 1990;147:933–937. doi: 10.1176/ajp.147.7.933. [DOI] [PubMed] [Google Scholar]
- Robins LN, Baber T, Cottler LB. Composite International Diagnostic Interview: Expanded Substance Abuse Module. St. Louis, MO: Author [L.N.R.]; 1987. [Google Scholar]
- Scerbo AS, Freedman LW, Raine A, Dawson ME, Venables PH. A major effect of recording site on measurement of electrodermal activity. Psychophysiology. 1992;29:241–246. doi: 10.1111/j.1469-8986.1992.tb01693.x. [DOI] [PubMed] [Google Scholar]
- Stormark KM, Laberg JC, Bjerland T, Hugdahl K. Habituation of electrodermal reactivity to visual alcohol stimuli in alcoholics. Addictive Behaviors. 1993;18:437–443. doi: 10.1016/0306-4603(93)90061-D. [DOI] [PubMed] [Google Scholar]
- Sylvers P, Brennan PA, Lilienfeld SO, Alden SA. Gender differences in autonomic indicators of antisocial personality disorder features. Personality Disorders: Theory, Research, and Treatment. 2010;1:87–96. doi: 10.1037/a0018949. [DOI] [PubMed] [Google Scholar]
- Tellegen A, Waller NG. Exploring personality through test construction: Development of the Multidimensional Personality Questionnaire. In: Boyle GJ, Matthews G, Saklofske DH, editors. Handbook of personality theory and testing: Personality measurement and assessment. II. London: Sage; 2008. pp. 261–292. [Google Scholar]
- Tuvblad C, Gao Y, Isen J, Botwick T, Raine A, Baker LA. The heritability of the skin conductance orienting response: A longitudinal twin study. Biological Psychology. 2012;89:47–53. doi: 10.1016/j.biopsycho.2011.09.003. [DOI] [PMC free article] [PubMed] [Google Scholar]
- Tuvblad C, Isen J, Baker LA, Raine A, Lozano DI, Jacobson KC. The genetic and environmental etiology of sympathetic and parasympathetic activity in children. Behavior Genetics. 2010;40:452–466. doi: 10.1007/s10519-010-9346-0. [DOI] [PMC free article] [PubMed] [Google Scholar]
- Wahlund K, Sorman K, Gavazzeni J, Fischer H, Kristiansson M. Attenuated subjective ratings and skin conductance responses to neutral and negative pictures in non-psychopathic mentally disordered offenders with various diagnoses. Psychiatry Research. 2010;180:30–34. doi: 10.1016/j.psychres.2009.09.009. [DOI] [PubMed] [Google Scholar]
- Weisz J, Czigler I. Age and novelty: event-related brain potentials and autonomic activity. Psychophysiology. 2006;43:261–271. doi: 10.1111/j.1469-8986.2006.00395.x. [DOI] [PubMed] [Google Scholar]