Abstract
Purpose
To evaluate the roles of dynamic contrast-enhanced magnetic resonance imaging (DCE-MRI) and optimum tracer kinetic parameters in the noninvasive grading of the glial brain tumors with histopathological grades (I–IV).
Materials and Methods
Twenty eight patients with histopathologically graded gliomas were imaged. Images with five flip angles were acquired before injection of gadolinium-DTPA and were processed to calculate the T1 value of each regions of interest (ROI). All the DCE-MRI data acquired during the injection were processed based on the MRI signal and pharmacokinetic models to establish concentration-time curves in the ROIs drawn within the tumors, counterlateral normal areas, and area of the individual artery input functions (iAIF) of each patient. A nonlinear least square fitting method was used to obtain tracer kinetic parameters. Kruskal-Wallis H-test and Mann-Whitney U-test were applied to these parameters in different histopathological grade groups for statistical differences (P<0.05).
Results
Volume transfer coefficient (Ktrans) and extravascular extracellular space volume fraction (Ve) calculated by using iAIFs can be used not only to distinguish the low (i.e., I and II) from the high (i.e., III and IV) grade gliomas (P(Ktrans) <0.001 and PVe<0.001), but also grade II from III (P(Ktrans) =0.016 and PVe=0.033).
Conclusion
Ktrans is the most sensitive and specific parameter in the noninvasive grading, distinguishing the high (III and IV) from the low (I and II) grade and high grade III from low grade II gliomas.
Keywords: MR perfusion imaging, gliomas, microvascular permeability, pharmacokinetics, grades of glioma
Introduction
Gliomas with a heterogeneous histological spectrum are the most common primary neoplasms of brains. In spite of technical improvements in surgery, radiation therapy, and chemotherapy, prognosis of patients with these tumors, particularly of high-grade, remains poor. An optimal treatment plan to address this aggressive disease depends on accurately determining the tumor grades (1).
Angiogenesis of the tumor plays an important role in staging of origination, progress, infiltration, and metastasis. It also exerts a remarkable influence on the biological activity and prognosis (2,3). Incomplete blood-brain barrier (BBB) tumor neovascularture results in the increment of microvascular permeability, which is a surrogate marker of the degree of malignancy of gliomas (4). The volume transfer constant of contrast agent from a plasma space to an extravascular extracellular space (EES), as defined Ktrans, has been used to characterize this microvascular permeability quantitatively (5,6). Another biological significant parameter: fractional extravascular extracellular space (EES) volume (Ve) has been applied to calculate the fraction (%) of a tumor volume occupied by the EES (i.e., the leakage space for contrast agent). Therefore, in determining the histopathological grade of a glioma, evaluation of the tumor vascularity, microvascular permeability and EES could be very valuable.
Recent developments in dynamic contrast-enhanced magnetic resonance imaging (DCE-MRI) could provide information on the blood microcirculation of tumors that cannot be acquired from the conventional MR imaging (7–9). DCE-MRI uses T1-weighted dynamic data points to track leakage information of contrast agents into the surrounding tissue over time. Based on the MRI signal and pharmacokinetic models, the data has permitted the creation of parameters such as Ktrans and Ve, leading to qualitative and quantitative evaluation of the angiogenic characteristics of tumors, assessment of tumor grade, and determination of the site of biopsy (10, 11). Quantification of enhancement characteristics of DCE data could be performed using a range of techniques. These include simple measurements of the semi quantitative parameters such as rate of enhancement from the signal intensity-time curve (i.e., the maximum slope of the curve) and complex algorithmic analyses that apply pharmacokinetic models to the contrast agent concentration-time curve to determine Ktrans (12–14), which is a surrogate of blood vessel integrity. The integrity in turn has been hypothesized as a marker of glioma grade (11).
Hence, we in the study examined Ktrans for gliomas grades I to IV by using a T1-weighted DCE-MRI technology and MRI and pharmacokinetic models, and also investigated the effect of different tumor grades on Kep, Kel, Ve, and Vp, obtained from the T1 perfusion data analyses. For complex algorithmic analyses based on the model, the accuracy of the trace kinetic parameters depends on the accuracy of artery input function (AIF). We discussed the data analysis model and a new approach for using the model by applying an individual artery input function (iAIF) extracting for each patient and the results of Kruskal-Wallis H-test and Mann-Whitney U-tests with P<0.05. The aims of this study were to present the tracer kinetic parameters of glioma and to correlate these parameters with histopathological grades to determine the optimum parameter or parameters for noninvasive differentiation of the grades of gliomas.
Materials and Methods
Patients
Twenty-eight patients (10 females, 18 males; age range, 19–74 years with mean of 47.11±14.18 years) with gliomas were included in this study, and they were part of 82 patients imaged from July 2007 to January 2008 in the Department of Radiology at Xiangya Hospital of School of Medicine, Central South University. This study was approved by the institutional review board (IRB) of the hospital and patients consented prior to the MRI scans. All MR images were acquired before biopsy or neurosurgery for the patients. The histopathologic analyses were performed on 74 patients with “gliomas” after the neurosurgeries. The results revealed that there were 14 low grade gliomas (8 grade I and 6 grade II) and 14 high grade gliomas (6 grade III and 8 grade IV), according to World Health Organization criteria.
MRI acquisition
MRI was performed on a 1.5T Siemens Syngo MR 2002B system with a standard birdcage head coil. All the patients underwent conventional T1-weighted, T2-weighted, and DCE MRI. After a T1-weighted imaging (TR/TE=450/10ms, slice thickness=5mm, and 10 axial slices), five separate acquisitions using a 2D Turbo FLASH sequence with flip angles of 2, 5, 10, 15 and 20° were acquired to calculate the baseline T1 value. DCE perfusion imaging dynamic series for the contrast bolus tracking was then performed by using a 3D Turbo FLASH sequence with a 20° flip angle and a 4s temporal resolution over a period of 6 minutes. The major imaging parameters were: TR/TE: 199/1.05 ms, field of view (FOV): 211 mm×260 mm, image acquisition matrix: 256×208, slice numbers: 10 and thickness: 5 mm. During the dynamic image acquiring, the axial slices covered the tumors and the arteries as AIFs were scanned repeatedly 90 times (i.e., 90 volumes). The slice orientation and locations were the same as the ones applied in the above variable flip angle scans. At the beginning of the fifth volume, a 0.1 mmol/kg bolus of Gd-DTPA contrast agent was injected intravenously at the rate of 4mL/s using a power injector. The paramagnetic contrast agent was circulated through the vasculature of the gliomas, which might leak from the damaged BBB over time into the EES where T1 values were reduced, causing the signal intensity to be increased. The T1-weighted DCE data recorded the changes in signals within a region of interest (ROI).
Image processing and data analysis
Quantitative analysis of DCE-MRI data requires MRI signal and pharmacokinetics models. The initial step of the quantitative analysis was the conversion of the T1-weighted signal intensity into contrast agent concentrations based on the MRI model. The quantitative parameters were then calculated from the concentration-time curves (CTCs) based on the pharmacokinetics model.
MRI signal model
The longitudinal relaxation rate of protons in tissue is increased due to increased dipole-dipole interaction between the protons and the unpaired electrons of the contrast agent particles that leaked into EES from plasma space. The vascular leakage is characterized by the enhanced relaxation rate. As equation [1] shows, the relaxation rate enhancement effects could be described as linearly scaling with mean contrast agent concentration in tissue, or C(t), scaled by the longitudinal relaxivity constant of contrast agent r1 (i.e. the increase in relaxation rate per unit contrast agent concentration or the contrast agent molar relaxivity rate (15)):
| [1] |
Where T10 (=1/R10) is the longitudinal relaxation time before injection of a contrast agent and T1 (=1/R1(t)) is the time-dependent longitudinal relaxation time after the injection. In a voxel, the T1-weighted signal intensity enhancement can be expressed approximately based on a Turbo-FLASH sequence and MR physics by the following equation (16):
| [2] |
The above equation was referenced as the MRI signal model. S(0) is the signal intensity before contrast agent arrival (i.e., baseline), ΔS(t) is the signal intensity enhancement normalized to the baseline, TR is the repeat time, and α is the flip angle.
Pharmacokinetic model
The first pharmacokinetic model used for DCE MRI was developed by Tofts (17), and has been one of the most popular methods in the field. In this study, the modified Tofts’ two-compartment model (15), taking into account that the concentration of contrast agent viewed in a voxel depends on the concentrations of contrast agent in both plasma space and EES, was used to measure microvascular permeability according to the equation [3]. This enabled the concentration of contrast agent in tissue to be calculated as a function of time after the contrast agent arrived in the two compartments.
| [3] |
Where Ct, Ce, and Cp are contrast agent concentration in tissue, EES, and plasma respectively, Ve is fractional EES volume, Vp is fractional plasma volume, Ktrans is volume transfer constant of contrast agent leaked into EES from plasma, and Kep is rate constant of contrast agent reflux to the plasma.
Cp(t) obtained from the signal of plasma space is the AIF, which was determined from the following section: iAIF determination. One common simplification was to assume Cp(t) to be a mono-exponential ‘step-response’ function: Cp(t)=Cp(0)·exp(−t/T1/2), where Cp(0) is the initial contrast agent concentration in the plasma and T1/2 is the elimination half-life of the contrast agent from the plasma. Cp(0) is obtained from the fitting of measured Cp(t) curve by applying the ‘step-response’ function. Using the elimination rate (Kel) instead of T1/2 (Kel=1/T1/2), it could then be shown that the solution to equation [3] was given by the tri-exponential function which included a term describing the plasma fraction Vp of the tissue signal:
| [4] |
There were four independent tracer kinetic parameters in the quantitative model: Ktrans, Kep, Kel, Vp. Fractional EES volume was obtained by Ve = Ktrans/kep. All data were processed in MATLAB.
Baseline T1 values
For each patient, data sets with flip angle of 2, 5, 10, 15, and 20° were used to calculate the baseline T1 values in ROIs by fitting the equation [5] using the algorithm of Levenberg-Marquardt. The mean MR signal intensities of the arteries and tumors’ ROIs determined by the T1-weighted high resolution images were applied in the equation for calculating the T1 values in the ROIs.
| [5] |
Where TR is the repeat time and α is the flip angle.
iAIF determination
An iAIF was derived from the time courses of the DCE scan within the brain arteries of each patient. The iAIF was extracted based on the distinct features exhibited by the concentration time curve in vascular voxels (18–21), including early bolus arrival time (BAT), high peak height (PH), early arrival of time to peak (TTP), sharp uptake (high initial slope value) of contrast agent, and high concentration of contrast.
First two radiologists (i.e., two coauthors with a MD) determined the imaging slice containing a brain “artery” which supplied blood to the tumor of each patient. Then, 90 dynamic T1-weighted images with the slice were loaded. The local neighborhood of the artery, utilizing 3*3 voxels as a kernel (i.e., a ROI), was used to calculate the MRI signals, which was then converted to the artery’s concentration-time curves based on the MRI model (i.e., the equations of 1 and 2) and the baseline T1 value of the artery. A kernel larger than 3*3 voxels was not recommended because it may have involved surrounding tissue voxels. The size of 3*3 voxels was appropriate for our data since the concentration-time curve in the ROI had a good S/N and less partial volume effect for determining an iAIF.
The PH, TTP and initial slope were calculated from the curve in each ROI on the slice. Among all of the curves, the curves with the highest 10 percent initial slopes were first selected, which was for eliminating areas without a sharp mass uptake. Then, within the selected curves, curves with the highest 10 percent PH were selected. The venous voxels showed similar perfusion characteristics (i.e., very high initial slopes and PH), except for delay in TTP when compared to the arterial voxels. Finally the curve with the minimum TTP was extracted from the above filtered curves, and is the needed iAIF.
Estimation of the tracer kinetic parameters
In order to obtain the parameters, DEC images including the tumor and iAIF of each patient were loaded in MATLAB. Motion correction of DCE data and coregistration of the data on the high resolution T1 images were performed with images acquired for each patient before determining ROIs. The ROIs were drawn on the tumors and the counterlateral no affected areas with the same sizes of the corresponding tumors’ by the primary author and verified by all three co-authoring radiologists.
T1-weighted signals in the ROIs were extracted and normalized to their baselines. The enhanced signal intensity-time curves were converted to contrast agent concentration time curves (CTCs) by applying the MRI model and baseline T1 values in the ROIs. Trace kinetic parameters of Ktrans, Kep, Kel, Ve, and Vp were calculated when a nonlinear least-squares fitting method using the Levenberg-Marquardt algorithm was performed on the CTCs and the corresponding iAIFs based on the pharmacokinetic model shown in equation [4], in which a square of the goodness-of-fit of more than 0.5 was regarded as the fitting threshold.
Statistical analysis
All the statistical analyses were performed by using commercial software SPSS 11.0 (Chicago, Ill, USA). The mean value with standard deviation (SD) for each parameter was calculated. The relationship between these parameters and grades of gliomas were established by comparing with histopathology results. A paired- t-Test was performed to examine the relationship of the parameters between the tumor and the counterlateral normal ROIs. A Kruskal-Wallis H-test was applied to assess whether the tracer kinetic parameters varied with glioma grades. A Mann-Whitney U-test was used to compare the parameters between any two grades and between the low (i.e., I and II) and high (i.e., III and IV) grades. A value of p<0.05 was regarded as statistically significant. Receiver Operating Characteristic (ROC) Curve was used to calculate the area under curve (AUC) for determining the ideal cutoff points for distinguishing low from high grade and grade II from III. The best cutoff values were determined by considering both highest Sensitivity and Specificity.
Results
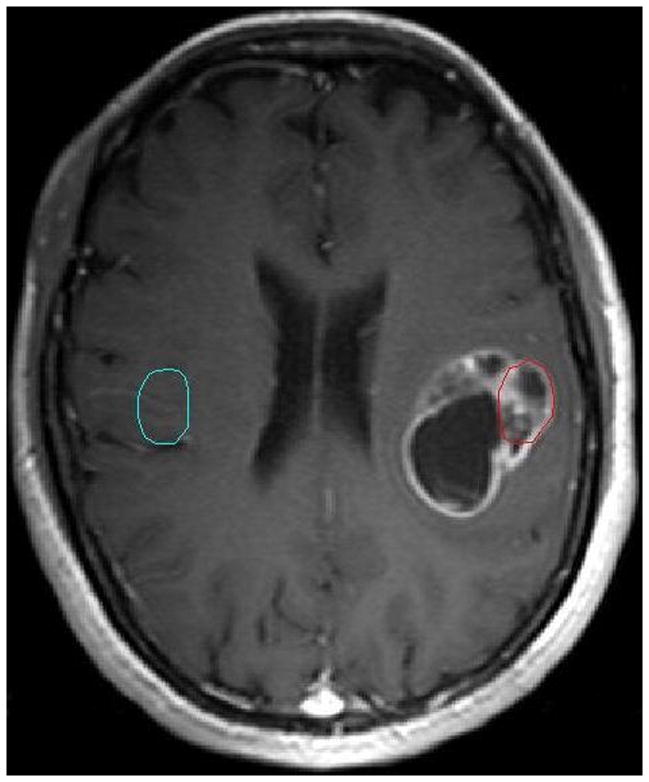
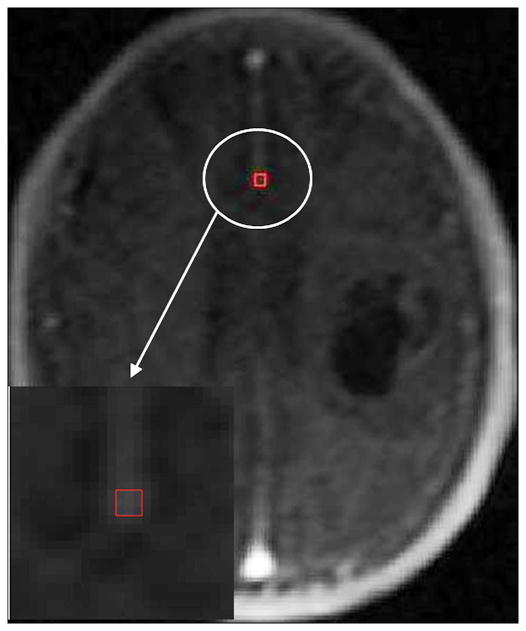
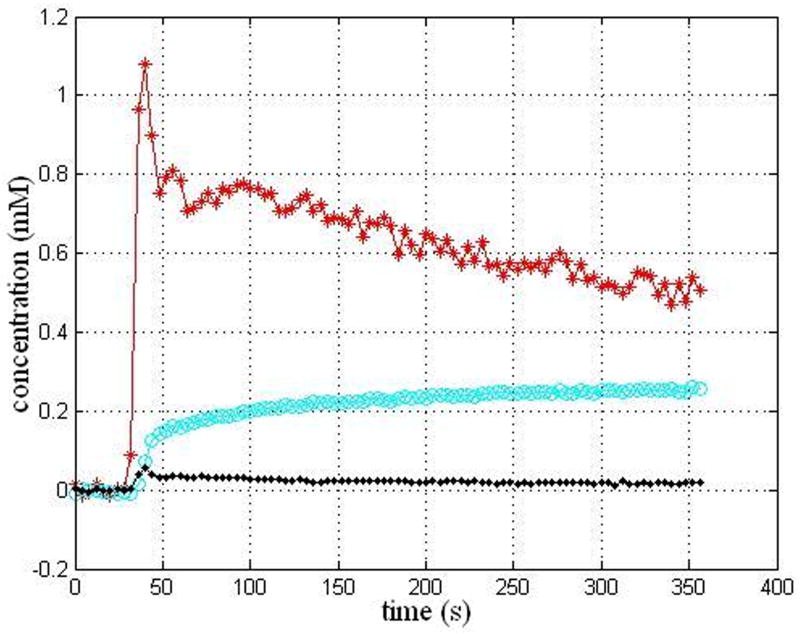
Histopathologic analysis demonstrated there were 14 low grades (8 grade I and 6 grade II) and 14 high grades (6 grade III and 8grade IV). An imaging slice with the ROIs drawn within the tumor and the counterlateral normal areas for a representative patient with a grade III is shown in Figure 1. The artery slice of the patient and the ROI drawn automatically on the arteries is shown in Figure 2. CTCs in the tumor and counterlateral normal ROIs and the iAIF are respectively plotted in Figure 3. The iAIF curve demonstrated sharper wash-in, wash-out, and high concentration characteristics than those in the CTCs.
Figure 1.
An imaging slice of a representative patient with a glioma (III) with the tumor ROI (red circle) and the counterlateral normal ROI (cyan circle).
Figure 2.
The Glioma in the Figure 1 with the iAIF ROI (red box) drawn automatically.
Figure 3.
iAIF determined automatically (red curve) and CTCs within the tumor ROI (cyan curve) and the normal ROI (black curve) for the patient in the Figure 1.
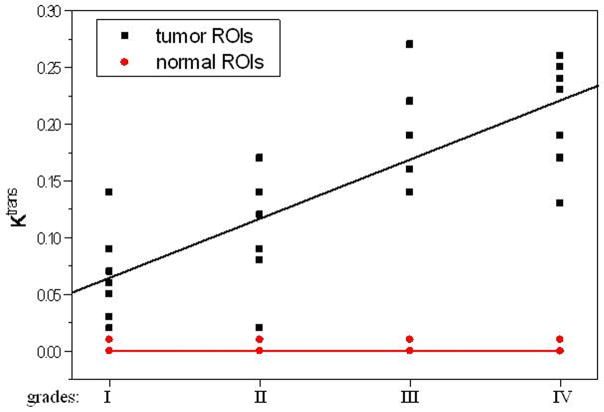
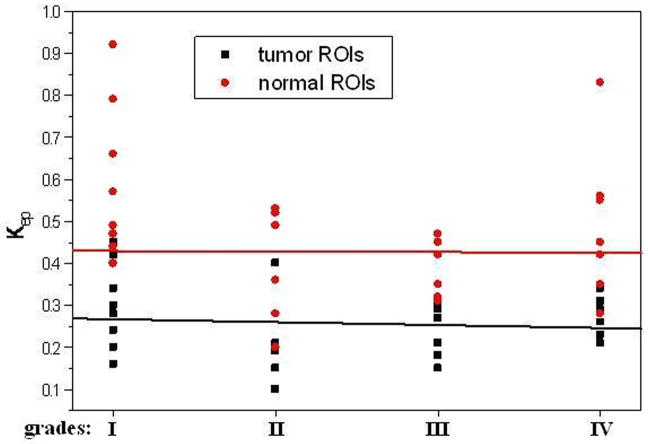
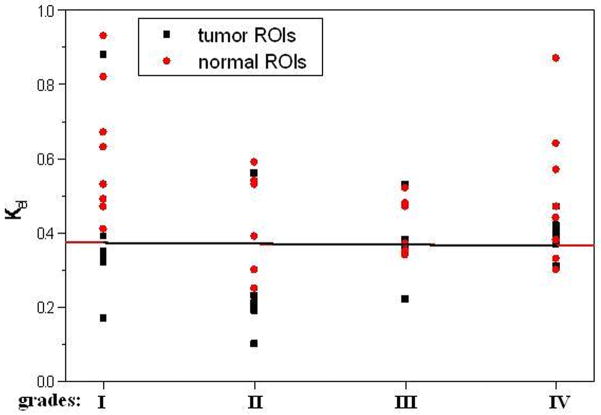
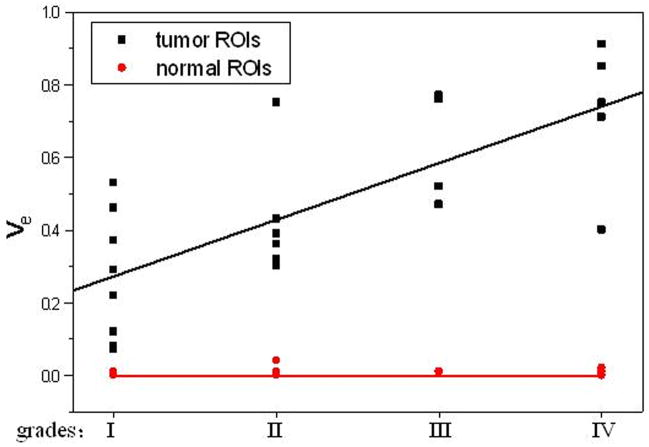
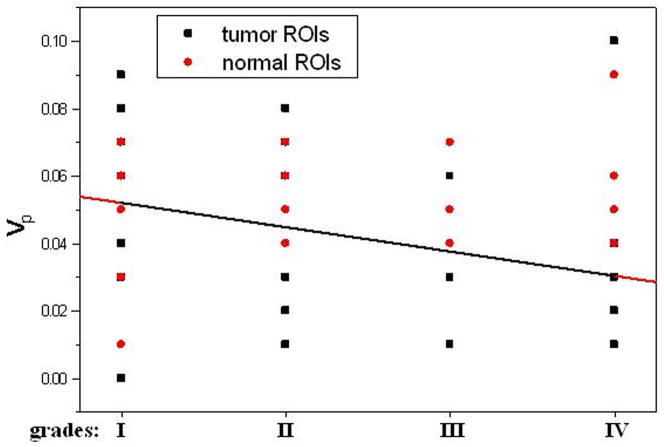
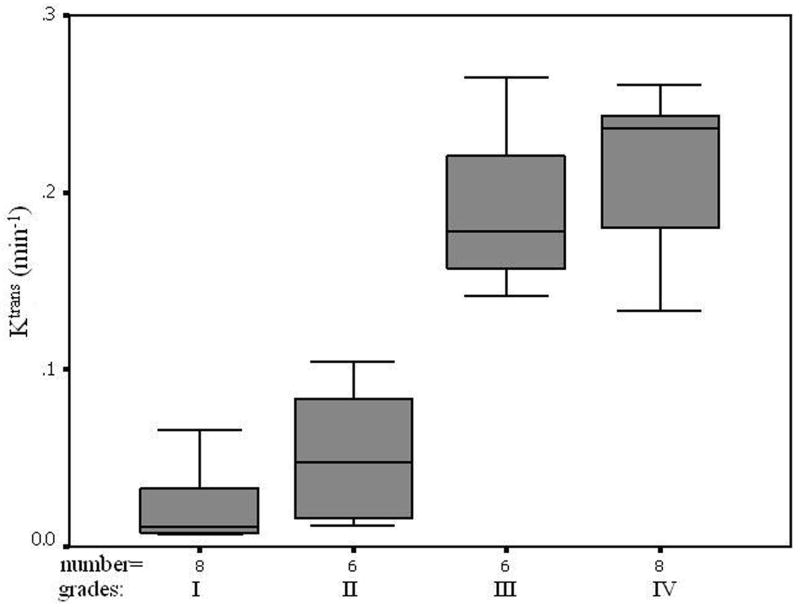
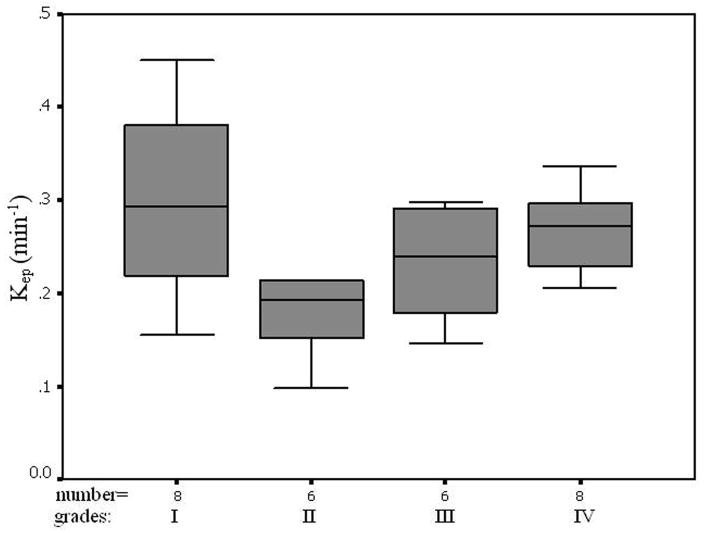
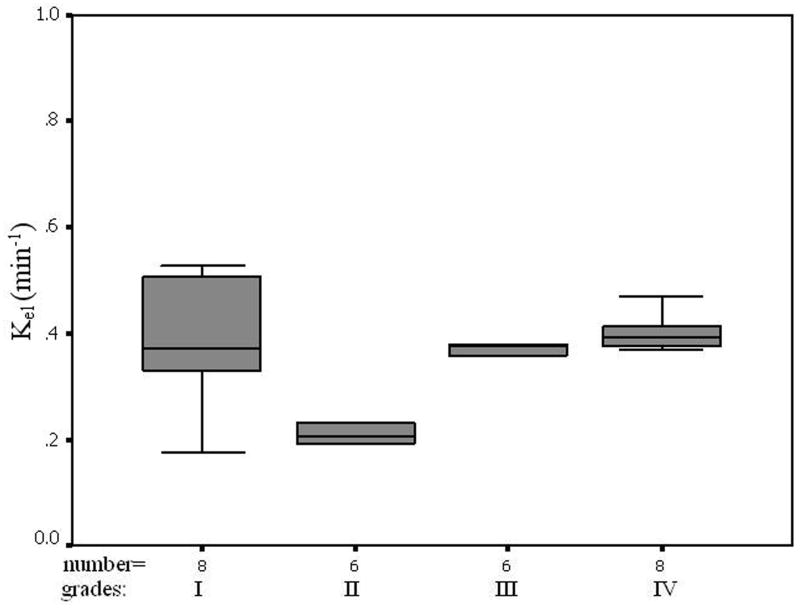
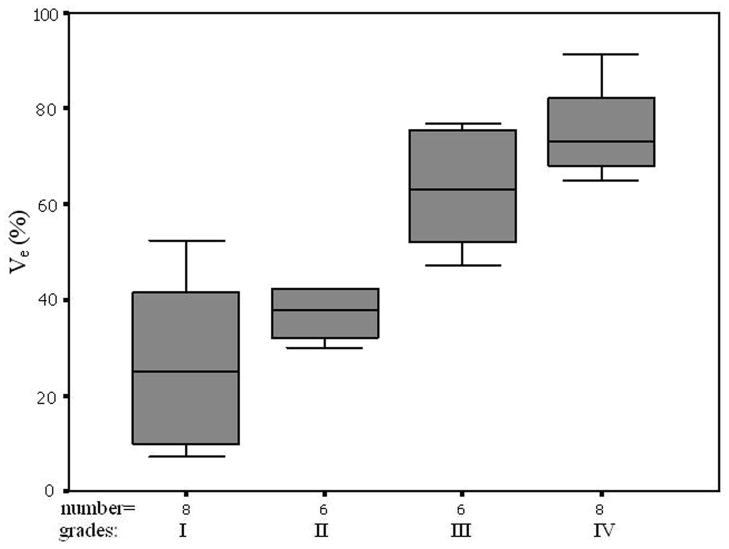
The average pre-contrast T1 value for the arteries and tumors were 1650 ± 170ms and 1195 ± 220 ms, respectively. The means and standard deviations of Ktrans, Kep, Kel, Ve, and Vp within the tumor and the counterlateral normal ROIs in all patients with four tumor grades are calculated and summarized in Table 1. The results of paired t-test when comparing the tumor with counterlateral normal ROIs are listed in the Table 2. The P values revealed a significant difference between the tumor and the normal ROIs in Ktrans, Kep, and Ve (P <0.05). The parameters Ktrans and Ve were significantly higher and Kep was significantly lower in the tumor ROIs compared to the normal ROIs (Figure 4 and Tables of 1 and 2). Kel and Vp were not significantly different between the tumor and normal ROIs (P>0.05).
Table 1.
Summary of measurement of tumor ROIs and counterlateral normal ROIs (5 parameters) in gliomas of grade I to grade IV (mean± standard deviation)
| grades | tumor ROIs | counterlateral normal ROIs | ||||||||
|---|---|---|---|---|---|---|---|---|---|---|
| Ktrans/min−1 | Kep/min−1 | Kel/min−1 | Ve | Vp | Ktrans/min−1 | Kep/min−1 | Kel/min−1 | Ve | Vp | |
| I | 0.066±0.02 | 0.299±0.10 | 0.434±0.20 | 0.267±0.17 | 0.054±0.02 | 0.003±0.00 | 0.594±0.18 | 0.619±0.18 | 0.006±0.00 | 0.042±0.01 |
| II | 0.093±0.03 | 0.209±0.10 | 0.249±0.15 | 0.426±0.16 | 0.044±0.02 | 0.005±0.00 | 0.398±0.13 | 0.433±0.13 | 0.014±0.01 | 0.056±0.01 |
| III | 0.190±0.04 | 0.232±0.06 | 0.374±0.09 | 0.630±0.15 | 0.016±0.01 | 0.004±0.00 | 0.387±0.07 | 0.422±0.07 | 0.010±0.01 | 0.048±0.01 |
| IV | 0.214±0.04 | 0.267±0.04 | 0.392±0.04 | 0.722±0.17 | 0.034±0.02 | 0.004±0.00 | 0.464±0.18 | 0.501±0.18 | 0.010±0.00 | 0.061±0.02 |
Note: Ktrans/min−1: volume transfer constant of contrast agent from a plasma space to an extravascular extracellular space;
Kep/min−1: rate constant of contrast agent reflux to plasma;
Kel/min−1: elimination rate of contrast agent;
Ve: fractional extravascular extracellular space volume;
Vp: fractional plasma volume.
Table 2.
Paired-Samples t Test for the five parameters between the tumor ROIs and the counterlateral normal ROIs
| grades | p value (t test) | ||||
|---|---|---|---|---|---|
| Ktrans/min−1 | Kep/min−1 | Kel/min−1 | Ve | Vp | |
| I | 0.002 | 0.002 | 0.143 | 0.004 | 0.166 |
| II | 0.006 | 0.022 | 0.059 | 0.001 | 0.295 |
| III | <0.001 | 0.011 | 0.140 | 0.004 | 0.241 |
| IV | <0.001 | 0.030 | 0.196 | <0.001 | 0.131 |
Note: Ktrans/min−1: volume transfer constant of contrast agent from a plasma space to an extravascular extracellular space;
Kep/min−1: rate constant of contrast agent reflux to plasma;
Kel/min−1: elimination rate of contrast agent;
Ve: fractional extravascular extracellular space volume;
Vp: fractional plasma volume.
Figure 4.
Trace kinetic parameters of tumor ROIs and counterlateral normal ROIs versus respective glioma grades and the fitting curves.
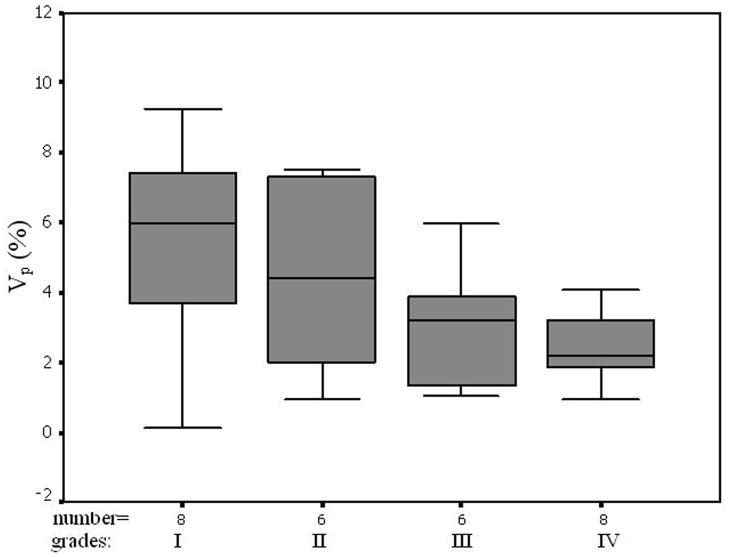
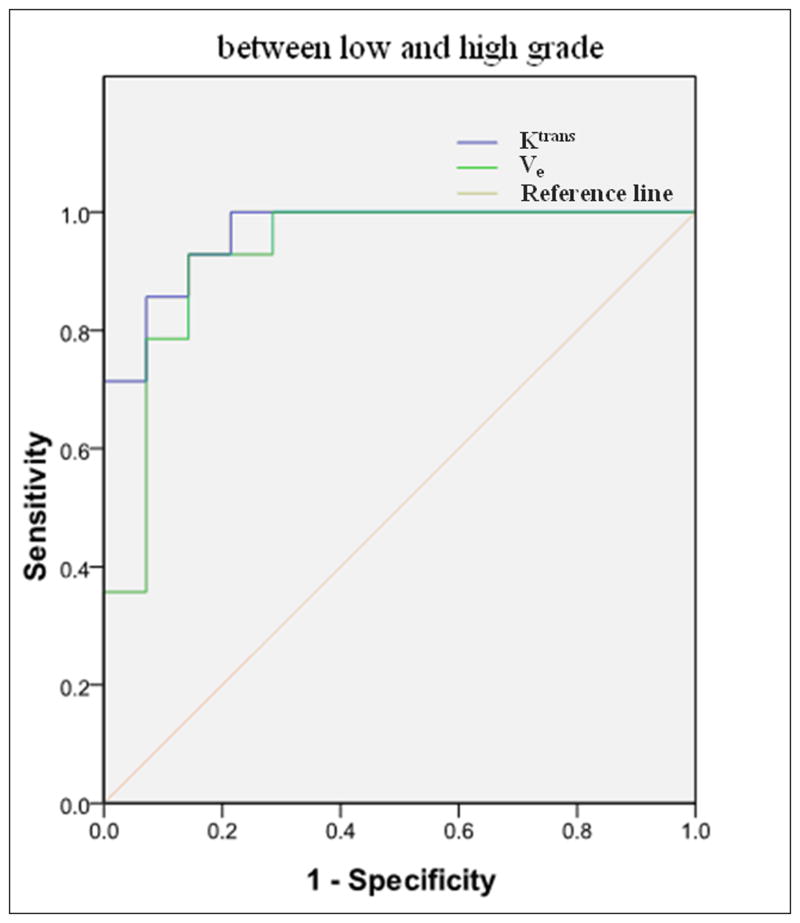
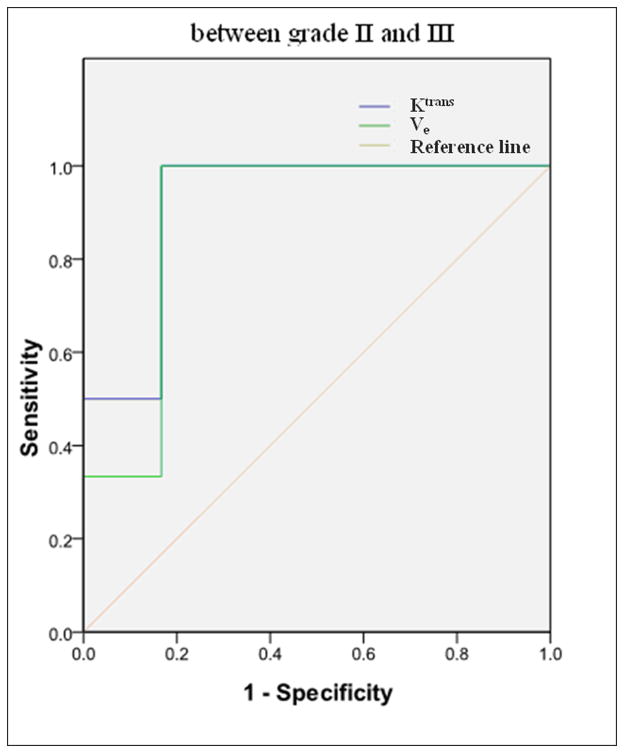
All five parameters from the normal ROIs and Kep, Kel, and Vp from the tumor ROIs did not vary significantly when the histological grades increased (P>0.05, Table 3). Ktrans and Ve from the tumor ROIs increased with an increase in tumor grades (Figures of 4 and 5), and the increases were statistically significant since Kruskal-Wallis H-tests revealed only the Ktrans and Ve values have P < 0.05 (Table 3). In the tumor (I–IV) ROIs, Ktrans were 0.066, 0.093, 0.190, and 0.214, and Ve were 0.267, 0.426, 0.630, and 0.722. The results from the Mann-Whitney U-tests for comparing the two parameters between any two grades or between low grades (I and II) and high grades (III and IV) are listed in Table 4. Specificity Vs Sensitivity (i.e., receiver operating characteristic (ROC)) curves for Ktrans and Ve are drawn in Figure 6.
Table 3.
Kruskal-Wallis H-test deviation for five parameters of tumor ROIs and the counterlateral normal ROIs in four grades
| parameters | tumor ROIs | counterlateral normal ROIs | ||
|---|---|---|---|---|
| χ2 | p | χ2 | p | |
| Ktrans/min−1 | 18.487 | <0.001 | 2.509 | 0.474 |
| Kep/min−1 | 4.921 | 0.178 | 5.645 | 0.130 |
| Kel/min−1 | 5.384 | 0.146 | 5.645 | 0.130 |
| Ve | 12.986 | 0.005 | 5.044 | 0.169 |
| Vp | 4.940 | 0.176 | 3.864 | 0.277 |
Note: Ktrans/min−1: volume transfer constant of contrast agent from a plasma space to an extravascular extracellular space;
Kep/min−1: rate constant of contrast agent reflux to plasma;
Kel/min−1: elimination rate of contrast agent;
Ve: fractional extravascular extracellular space volume;
Vp: fractional plasma volume.
Figure 5.
Values of Trace kinetic parameters in the tumor ROIs. Error bars indicate two standard errors.
Table 4.
Mann-Whitney U-test deviation for five parameters of tumor ROIs in four grades
| grades | p value | |
|---|---|---|
| Ktrans/min−1 | Ve | |
| Ivs II | 0.156 | 0.156 |
| Ivs III | 0.003 | 0.017 |
| Ivs IV | 0.001 | 0.005 |
| IIvs III | 0.016 | 0.033 |
| IIvs IV | 0.005 | 0.037 |
| IIIvs IV | 0.366 | 0.670 |
| Low vs high | <0.001 | 0.001 |
Note: Ktrans/min−1: volume transfer constant of contrast agent from a plasma space to an extravascular extracellular space;
Ve: fractional extravascular extracellular space volume.
Figure 6.
ROC for discrimination between low (I and II) and high (III and IV) grade glioma (a) (AUC = 0.964 for Ktrans and 0.929 for Ve) and between grade II and III (b) (AUC = 0.917 for Ktrans and 0.889 for Ve) by Ktransand Ve respectively.
Discussion
In the study, tracer kinetic parameters of the twenty-eight gliomas were calculated based on the MRI signal and pharmacokinetic models by using the DCE-MRI data to evaluate the optimum parameters for distinguishing tumor grade. Five flip angle data were used to determine the T1 values in artery and tumor ROIs. A new approach using the modified Toft’s model by applying an individual artery input function (iAIF) extracting for each patient was performed. The iAIFs were obtained from the artery’s CTCs. The model with an accurately determined iAIF based on each patient (i.e., iAIF) was applied to obtained Ktrans, Kep, Kel, Ve, and Vp. These parameters were compared against the histopathology grades used to seek the optimum parameter to distinguish tumor grades.
As shown in Figure 3, the CTC of the tumor with grade III demonstrated a quick wash-in and slow wash-out pattern, revealing an immediate and persisting leakage of contrast agent into the EES due to the breakdown of the BBB in the high grade glioma. The difference in the CTCs between grade I and the counterlateral normal, which were not shown, was not obvious. It was known that angiogenesis of a tumor occurs as the tumor grade increases, and the process accelerates from the low grade (I and II) to high grade (III and IV). With the tumor angiogenesis, BBB of tumor neovasculature resulted in the increment of microvascular permeability, which led to an increment of wash-in slope of the CTC in tumor.
In this study we did not find significant difference in Kel and Vp between the tumor and the counterlateral normal ROIs. Since Kel describes elimination of contrast from the vasculature, and hence kidney functions, the results suggested no difference for kidney functions of patients with different grades of gliomas. However, the Ktrans and Ve in tumor were significantly higher than those in normal brain tissue and Kep in tumor was significantly lower than those in normal brain tissue (Table 2 and Figure 4). The results suggest an increase in fractional EES in the tumors and blood flow and microvascular permeability (i.e., leakage of the contrast agent into the EES) of the tumors. The data in Table 1 and the fittings in the Figure 4 demonstrated Kep in tumors was almost a constant with tumor grades, and Ktrans and Ve in tumors increased with the grades. Thus, Ktrans and Ve may be helpful in noninvasively grading tumor.
The data in Table 3 (the comparison of multi groups) suggested that between any two grades, there were no statistical differences for all five parameters in the normal tissues and Kep, Kel, and Vp in the tumor ROIs (p>0.05). Only Ktrans and Ve in the tumor ROIs had significant differences among the grades (Table 3, p<0.005). A Mann-Whitney U-test, which is for the comparison of two groups, was then applied to determine between which two grades Ktrans and Ve were distinct, and the results (Table 4) indicated they were good parameters for distinguishing any two grades except for distinguishing grades I with II and grade III with IV.
In the tumor (I–IV) ROIs the Ktrans were found to be 0.066, 0.093, 0.190, and 0.214 in−1, and the Ve were found to be 0.267, 0.426, 0.630, and 0.722, respectively. It was known that Ktrans depended on both blood flow and the product of the capillary wall permeability and the surface area, and the parameter of Ve was the ratio of quantity of contrast agent leaked into the EES to that returned to the plasma space (i.e., the fraction (%) of a tumor volume occupied by the EES (i.e., the leakage space for contrast agent)). As shown in Figures 4 and 5, Ktrans and Ve increased with the increase of the grades, indicating that the higher the malignant degree was, the higher the contrast agent leakage into EES was. Both Ktrans and Ve could be applied to distinguish low (I and II) from high (III and IV) grade gliomas. This finding is in agreement with a prior study (22) which showed a high correlation between Ktrans or Ve and the grades of gliomas.
Although Ktrans and Ve did not discern well between gliomas of grade III and grade IV (P>0.3) nor between grade I and grade II (P>0.15), there was significant difference of Ktrans and Ve between the low (I and II) and the high (III and IV) and between II and III grades (Table 4: Mann-Whitney U-test, P<0.05), which suggested that Ktrans and Ve could be applied to distinguish low (I and II) from high (III and IV) grades and grade II from III. There was a remarkable difference between the low (I and II) and high (III and IV) grades (Mann-Whitney U-test, p<0.001). The results showed that analyzing the DCE data by using an AIF from each patient (i.e., iAIF)—instead of applying one common AIF for all patients (19, 20, 23–25)—may lead to more accurate Ktrans values for distinguishing tumor grades.
For discrimination between the high (III and IV) and low (I and II) grade gliomas by Ktrans and Ve values, the sensitivity and specificity gave two significant numbers: 0.92 and 0.85 respectively by Ktrans, and 0.90 and 0.78 by Ve. The area under the ROC curves was 0.964 for Ktrans and 0.929 for Ve (Figure 6). Hence, both Ktrans and Ve were capable of distinguishing the high grades from the low grades. With smaller P values (Table 4), Ktrans seemed to be a better parameter for evaluating the tumor grade, especially for differentiating the high grades from low grades and the grade II from grade III. AUC was 0.964 for Ktrans and 0.929 for Ve in distinguish between low and high grade gliomas, and 0.917 for Ktrans and 0.889 for Ve in distinguishing between grade II and III glioma, which indicated that Ktrans was a better parameter to distinguish not only the low (I and II) from high (III and IV) grade gliomas, but also the grade II and III.
Magnetic resonance spectroscopy (MRS) and dynamic susceptibility contrast (DSC) MRI have also been applied to predict tumor grades. A recent study (26) concluded that the indices of Cho/Cre and Lac/Cre from MRS were good for differentiating grade II from III and III from IV, respectively, whereas the parameter of tumor blood volume from DSC-MRI was only useful for distinguishing II from IV. Compared to the indices and parameter, the results of Ktrans in this and previous investigations (6, 11) suggest that Ktrans is a better predictive parameter for grading gliomas. The partial volume effect due to the low spatial resolution data of MRS made the indices less sensitive and specific when distinguishing the grades. Also tumor microvascular permeability exposed by Ktrans maybe better linked to the tumor grade.
There were limitations in this study. We applied a 2D Turbo FLASH sequence for obtaining the baseline T1 value and a 3D Turbo FLASH sequence for DCE data. The internal inconsistency in the imaging sequence and alteration in its sensitivity to the tumor blood supply may lead to variations from case to case. The sample size may need to be increased for each group of tumor grade for an effectively statistical comparison including a significant threshold value to distinguish the groups. Also we are working on obtaining the maps of Ktrans, Kep, Kel, Ve, and Vp.
In conclusion, DCE-MRI is a promising technique that can provide a very important trace kinetic parameter: Ktrans, which is associated with gliomas’ microvascular permeability—a surrogate for tumor grades. Besides Ktrans, Ve can be helpful in grading gliomas; however, Ktrans is preferable as Ktrans can be utilized not only to differentiate the low (I and II) from high (III and IV) grades, but also to differentiate the grade II from III.
Acknowledgments
Grant Support:
National 973 Basic Research Program of China (No. 2010CB732600), Centers of Biomedical Research Excellence (P30 RR031155-01) of NCRR of US and International Cooperation Program on Science and Technology of Shenzhen (ZYA200903260065A) of China.
We appreciate the help of Dr. Weihua Liao in data collection, and thank Dr. Marc Haut of West Virginia University for reviewing and editing the manuscript.
References
- 1.Pope WB, Sayre J, Perlina A, Villablanca JP, Mischel PS, Cloughesy TF. MR imaging correlates of survival in patients with highgrade gliomas. AJNR Am J Neuroradiol. 2005;26:2466–2474. [PMC free article] [PubMed] [Google Scholar]
- 2.Akella NS, Twieg DB, Mikkelsen T, et al. Assessment of brain tumor angiogenesis inhibitors using perfusion magnetic resonance imaging: quality and analysis results of a phase I trial. J Magn Reson Imaging. 2004;20:913–922. doi: 10.1002/jmri.20202. [DOI] [PubMed] [Google Scholar]
- 3.Hasselbalch B, Eriksen JG, Broholm H, et al. Prospective evaluation of angiogenic, hypoxic and EGFR-related biomarkers in recurrent glioblastoma multiforme treated with cetuximab, bevacizumab and irinotecan. APMIS. 2010;118:585–594. doi: 10.1111/j.1600-0463.2010.02631.x. [DOI] [PubMed] [Google Scholar]
- 4.Provenzale JM, Mukundan S, Dewhirst M. The role of blood-brain barrier permeability in brain tumor imaging and therapeutics. AJR Am J Roentgenol. 2005;185:763–767. doi: 10.2214/ajr.185.3.01850763. [DOI] [PubMed] [Google Scholar]
- 5.Provenzale JM, York G, Moya MG, et al. Correlation of relative permeability and relative cerebral blood volume in high-grade cerebral neoplasms. AJR Am J Roentgenol. 2006;187:1036–1042. doi: 10.2214/AJR.04.0676. [DOI] [PubMed] [Google Scholar]
- 6.Mills SJ, Patankar TA, Haroon HA, Balériaux D, Swindell R, Jackson A. Do cerebral blood volume and contrast transfer coefficient predict prognosis in human glioma? AJNR Am J Neuroradiol. 2006;27:853–858. [PMC free article] [PubMed] [Google Scholar]
- 7.Yankeelov TE, Gore JC. Dynamic Contrast Enhanced Magnetic Resonance Imaging in Oncology: Theory, Data Acquisition, Analysis, and Examples. Curr Med Imaging Rev. 2009;3:91–107. doi: 10.2174/157340507780619179. [DOI] [PMC free article] [PubMed] [Google Scholar]
- 8.Mross K, Fasol U, Frost A, et al. DCE-MRI assessment of the effect of vandetanib on tumor vasculature in patients with advanced colorectal cancer and liver metastases: a randomized phase I study. J Angiogenes Res. 2009;1:5. doi: 10.1186/2040-2384-1-5. [DOI] [PMC free article] [PubMed] [Google Scholar]
- 9.Li X, Rooney WD, Várallyay CG, et al. Dynamic-contrast-enhanced-MRI with extravasating contrast reagent: rat cerebral glioma blood volume determination. J Magn Reson. 2010;206:190–199. doi: 10.1016/j.jmr.2010.07.004. [DOI] [PMC free article] [PubMed] [Google Scholar]
- 10.Jain R, Ellika SK, Scarpace L, et al. Quantitative estimation of permeability surface-area product in astroglial brain tumors using perfusion CT and correlation with histopathologic grade. AJNR Am J Neuroradiol. 2008;29:694–700. doi: 10.3174/ajnr.A0899. [DOI] [PMC free article] [PubMed] [Google Scholar]
- 11.Cha S, Yang L, Johnson G, et al. Comparison of Microvascular Permeability Measurements, Ktrans, Determined with Conventional Steady-State T1-Weighted and First-Pass T2*-Weighted MR Imaging Methods in Glioma and Meningiomas. AJNR Am J Neuroradiol. 2006;27:409–417. [PMC free article] [PubMed] [Google Scholar]
- 12.Hou P, De EJ, Kramer LA, Westney OL. Dynamic contrast-enhanced MRI study of male pelvic perfusion at 3T: preliminary clinical report. J Magn Reson Imaging. 2007;25:160–169. doi: 10.1002/jmri.20813. [DOI] [PubMed] [Google Scholar]
- 13.Buckley DL. Uncertainty in the analysis of tracer kinetics using dynamic contrast-enhanced T1-weighted MRI. Magn Reson Med. 2002;47:601–606. doi: 10.1002/mrm.10080. [DOI] [PubMed] [Google Scholar]
- 14.Brix G, Kiessling F, Lucht R, et al. Microcirculation and microvasculature in breast tumors: pharmacokinetic analysis of dynamic MR image series. Magn Reson Med. 2004;52:420–429. doi: 10.1002/mrm.20161. [DOI] [PubMed] [Google Scholar]
- 15.Tofts PS. Modeling tracer kinetics in dynamic Gd-DTPA MR imaging. J Magn Reson Imaging. 1997;7:91–101. doi: 10.1002/jmri.1880070113. [DOI] [PubMed] [Google Scholar]
- 16.Workie DW, Dardzinski BJ, Graham TB, Laor T, Bommer WA, O’Brien KJ. Quantification of dynamic contrast-enhanced MR imaging of the knee in children with juvenile rheumatoid arthritis based on pharmacokinetic modeling. Magn Reson Imaging. 2004;22:1201–1210. doi: 10.1016/j.mri.2004.09.006. [DOI] [PubMed] [Google Scholar]
- 17.Tofts PS, Berkowitz B, Schnall MD. Quantitative analysis of dynamic Gd-DTPA enhancement in breast tumors using a permeability model. Magn Reson Med. 1995;33:564–568. doi: 10.1002/mrm.1910330416. [DOI] [PubMed] [Google Scholar]
- 18.Parker GJ, Jackson A, Waterton JC, Buckley DL. Automated arterial input function extraction for T1-weighted DCE-MRI. Proceedings of the 11th Annual Meeting of ISMRM; Toronto. 2003. p. abstract 1264. [Google Scholar]
- 19.Rijpkema M, Kaanders JH, Joosten FB, van der Kogel AJ, Heerschap A. Method for quantitative mapping of dynamic MRI contrast uptake in human tumors. J Magn Reson Imaging. 2001;14:457–463. doi: 10.1002/jmri.1207. [DOI] [PubMed] [Google Scholar]
- 20.Parker GJ, Roberts C, Macdonald A, et al. Experimentally derived functional form for a population-averaged high-temporal-resolution arterial input function for dynamic contrast-enhanced MRI. Magn Reson Med. 2006;56:993–1000. doi: 10.1002/mrm.21066. [DOI] [PubMed] [Google Scholar]
- 21.Singh A, Rathore RK, Haris M, Verma SK, Husain N, Gupta RK. Improved bolus arrival time and arterial input function estimation for tracer kinetic analysis in DCE-MRI. J Magn Reson Imaging. 2009;29:166–176. doi: 10.1002/jmri.21624. [DOI] [PubMed] [Google Scholar]
- 22.Patankar TF, Haroon HA, Mills SJ, et al. Is volume transfer coefficient (K(trans)) related to histologic grade in human glioma? AJNR Am J Neuroradiol. 2005;26:2455–2465. [PMC free article] [PubMed] [Google Scholar]
- 23.Bokacheva L, Sheikh K, Rusinek H, et al. Characterization of Prostate Cancer with Perfusion MR Imaging. Proc Intl Soc Mag Reson Med. 2008;16:3807. [Google Scholar]
- 24.Wang Y, Huang W, Panicek DM, Schwartz LH, Koutcher JA. Feasibility of using limited-population-based arterial input function for pharmacokinetic modeling of osteosarcoma dynamic contrast-enhanced MRI data. Magn Reson Med. 2008;59:1183–1189. doi: 10.1002/mrm.21432. [DOI] [PMC free article] [PubMed] [Google Scholar]
- 25.Shukla-Dave A, Lee N, Stambuk H, et al. Average arterial input function for quantitative dynamic contrast enhanced magnetic resonance imaging of neck nodal metastases. BMC Med Phys. 2009;9:4. doi: 10.1186/1756-6649-9-4. [DOI] [PMC free article] [PubMed] [Google Scholar]
- 26.Toyooka M, Kimura H, Uematsu H, Kawamura Y, Takeuchi H, Itoh H. Tissue characterization of glioma by proton magnetic resonance spectroscopy and perfusion-weighted magnetic resonance imaging: glioma grading and histological correlation. Clin Imaging. 2008;32:251–258. doi: 10.1016/j.clinimag.2007.12.006. [DOI] [PubMed] [Google Scholar]


