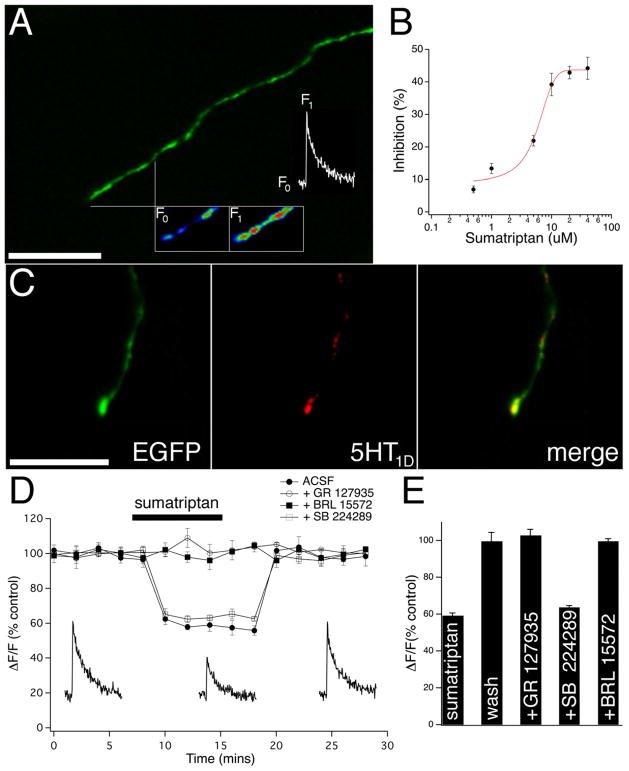
Figure 1. Sumatriptan causes a dose dependent decrease in action potential evoked Ca2+ transient amplitude.
(A) A CGRP-EGFP terminating nociceptive fibre showing a typical region from which fluorescent transients were acquired and quantified, along with a pseudocolour inset of baseline Rhod-2 fluorescence (F0), and a single action potential evoked signal (F1) with the corresponding transient above displayed. (B) The sumatriptan dose-response curve shows that the amplitude of the Ca2+ transient is inhibited with increasing concentrations of sumatriptan. (C) 5-HT1D receptors are co-localized with terminating CGRP nociceptors. (Left) CGRP-EGFP terminating nociceptive fibre shows punctate immunoreactive labeling with a 5-HT1D antibody (middle and merge). (D) Graph of Ca2+ transient amplitude timecourse experiments showing the effect of sumatriptan application in control conditions (solid circles), in the presence of the selective 5-HT1 receptor antagonist GR127935 (hollow circles), the selective 5-HT1D antagonist BRL 15572 (solid squares), and the selective 5-HT1B antagonist SB 224289 (hollow squares). Individual example transients during control, sumatriptan, and wash conditions taken at the relative timepoints on the graph are shown below. (E) Bar graph summary showing that the sumatriptan reduction in the amplitude of the Ca2+ transient was completely reversible with wash, blocked by GR 127935 and BRL 15572, but not by SB 224289. Scale bars = 20 μm.

