

Abstract
Glutathione is an important mediator and regulator of cellular redox processes. Detailed knowledge of local glutathione redox potential (EGSH) dynamics is critical to understand the network of redox processes and their influence on cellular function. Using dynamic oxidant recovery assays together with EGSH-specific fluorescent reporters, we investigate the glutathione pools of the cytosol, mitochondrial matrix and intermembrane space (IMS). We demonstrate that the glutathione pools of IMS and cytosol are dynamically interconnected via porins. In contrast, no appreciable communication was observed between the glutathione pools of the IMS and matrix. By modulating redox pathways in the cytosol and IMS, we find that the cytosolic glutathione reductase system is the major determinant of EGSH in the IMS, thus explaining a steady-state EGSH in the IMS which is similar to the cytosol. Moreover, we show that the local EGSH contributes to the partially reduced redox state of the IMS oxidoreductase Mia40 in vivo. Taken together, we provide a comprehensive mechanistic picture of the IMS redox milieu and define the redox influences on Mia40 in living cells.
Keywords: glutathione, Mia40, mitochondrial intermembrane space, porin, roGFP
Introduction
The tripeptide glutathione (GSH) is a major cellular redox regulator. It plays a prominent role in oxidant scavenging, in reducing disulphide bonds, in protecting cysteines from irreversible overoxidation and in scavenging various electrophilic compounds (Hwang et al, 1992; Grant et al, 1996; Ostergaard et al, 2004). During most of these processes, GSH is oxidized to glutathione disulphide (GSSG), while its targets are kept in a reduced state. While most of these processes are complemented by back-up systems like the thioredoxin-thioredoxin reductase system (Trotter and Grant, 2005; Kumar et al, 2011), GSH does serve an essential role in iron metabolism by cooperating with monothiol glutaredoxins in the assembly of iron-sulphur clusters (Lee et al, 2001; Lopez-Mirabal et al, 2007; Kumar et al, 2011).
To keep GSH in a reduced state, the cytosol and the mitochondrial matrix harbour the NADPH-dependent enzyme glutathione reductase (encoded by GLR1 in Saccharomyces cerevisiae). Glr1 is represented by two isoforms that originate from two alternative start codons on one transcript. If translation is initiated from the first start codon, then Glr1 is encoded with a mitochondrial matrix targeting sequence, while translation from the second start codon leads to a shorter cytosolic protein (Outten and Culotta, 2004). In addition to Glr1, the cytosol and matrix contain various alternative GSSG-reducing enzymes including thioredoxins, peroxiredoxins and glutaredoxins (Pedrajas et al, 1999; Holmgren et al, 2005; Herrero et al, 2006). Moreover, during oxidative stress GSSG can also be exported from the cytosol either to the exterior or, in yeast, to the vacuole to maintain a reducing cytosolic environment (Ballatori et al, 2009; Zechmann et al, 2011).
The enzymes involved in GSSG reduction derive reducing equivalents directly or indirectly from NADPH. In the cytosol, NADPH is mainly produced by the pentose phosphate pathway (e.g., in S. cerevisiae by the enzyme Zwf1), while in the mitochondrial matrix the majority of NADPH is derived from the activity of NADH kinase (e.g., in S. cerevisiae by Pos5; Outten and Culotta, 2003; Miyagi et al, 2009) or by NADP+-dependent isocitrate dehydrogenase (Jo et al, 2001).
GSH is synthesized exclusively in the cytosol and from there transported to other cellular compartments including mitochondria (Griffith and Meister, 1985; McKernan et al, 1991). For import into the mitochondrial matrix GSH has to pass two membranes: (i) the outer membrane (OMM) that contains porins (in S. cerevisiae Por1, Por2) and the translocase of the outer membrane (TOM) which both allow the free diffusion of small molecules (Cortese et al, 1991; Antos et al, 2001; Colombini, 2007; Shoshan-Barmatz et al, 2010; Zeth, 2010) and (ii) the inner membrane (IMM) where in mammalian cells the dicarboxylate carrier and the oxoglutarate carrier have been described to transport the majority of GSH (Chen and Lash, 1998; Chen et al, 2000). However, in yeast it is not known whether their respective homologues facilitate glutathione transport. Electrophysiological recordings suggested that porins can be found in either an open or a closed state in vitro (Colombini, 1989; Mannella, 1997; Summers and Court, 2010). The relevance of these findings for metabolite transport across the OMM in living cells is unclear and controversially discussed. In line with a limited permeability of the OMM, the glutathione pool of the intermembrane space of mitochondria (IMS) was described to be maintained separately from the cytosolic glutathione pool (Hu et al, 2008).
The IMS harbours various redox pathways with the potential to influence the local glutathione pool or in turn become influenced by it (Herrmann and Riemer, 2010). This cross-talk has so far not been investigated. Examples for redox-active IMS enzymes are the subunits of the respiratory chain (complexes III and IV, and the NADH dehydrogenases Nde1 and Nde2), and antioxidant enzymes like superoxide dismutase 1 (Sod1) and cytochrome c peroxidase (Ccp1). The IMS also contains a pathway for oxidative protein folding (Chacinska et al, 2009; Deponte and Hell, 2009; Riemer et al, 2009). This pathway consists of the oxidoreductase Mia40 and the sulphhydryloxidase Erv1. In-vitro studies suggested that reduced glutathione might facilitate a more efficient oxidative folding in the IMS (Bien et al, 2010). Such a role of glutathione has been demonstrated for the endoplasmic reticulum (ER) where glutathione interacts with oxidoreductases like protein disulphide isomerase (Jessop and Bulleid, 2004; Appenzeller-Herzog, 2011).
The redox chemistry of the glutathione pool is characterized by the glutathione redox potential (EGSH). EGSH depends on the ratio of GSH and GSSG as well as on the total glutathione concentration, and thus varies between compartments and physiological conditions. Powerful tools for the in-vivo investigation of local EGSH were developed in the form of redox-sensitive fluorescent proteins, rxYFP (Ostergaard et al, 2001, 2004) and the redox-sensitive green fluorescent proteins (roGFPs; Dooley et al, 2004; Hanson et al, 2004). These genetically encoded probes allow the measurement of EGSH in specific compartments. However, for equilibration with the ambient glutathione pool these probes depend on catalysis by endogenous dithiol glutaredoxins (Ostergaard et al, 2004; Meyer et al, 2007). Thus, a dynamic real-time probe for EGSH was created by directly fusing human glutaredoxin 1 (Grx1) to an roGFP (Grx1-roGFP2) (Gutscher et al, 2008). Since this probe equilibrates rapidly and specifically with the local glutathione pool it allows rapid changes in the EGSH to be followed. Moreover, Grx1-roGFP2 is ratiometric by excitation, and thus the measurement errors resulting from photobleaching, variable cellular sensor concentrations, or variable cell thickness are minimal (Meyer and Dick, 2010). Using different genetically encoded redox probes, steady-state EGSH values were estimated for various compartments in S. cerevisiae: for example, the cytosol (rxYFP: −289 mV (Ostergaard et al, 2004), −286 mV (Hu et al, 2008); Grx1-roGFP2: −310 mV (Morgan et al, 2011), −320 mV (Braun et al, 2010)), the mitochondrial matrix (rxYFP: −296 mV (Hu et al, 2008)) and IMS (rxYFP: −255 mV (Hu et al, 2008)). Moreover, recent studies indicate that glutathione pools in different compartments dynamically, specifically, and often autonomously adapt to physiological changes (Merksamer et al, 2008; Waypa et al, 2010; Morgan et al, 2011).
So far we lack a comprehensive mechanistic picture of the dynamics of the glutathione pool in the IMS, including its cross-talk with neighbouring compartments and redox pathways. In a previous analysis, steady-state EGSH values of the IMS were measured using rxYFP, which relies on the availability of endogenous dithiol glutaredoxins in the respective compartment (Hu et al, 2008). In this study, an IMS-targeted version of rxYFP was found to be more oxidized than its respective cytosolic and matrix variants. Moreover, EGSH[IMS] was not affected in a Δglr1 strain, while EGSH[cytosol] became significantly more oxidizing than in wild–type (wt) cells. It was thus concluded that the glutathione pools of the cytosol and the IMS are maintained separately.
In the present study, we utilized the dynamic redox probe Grx1-roGFP2 to overcome the limitations of steady-state measurements. We explored the dynamic interplay between the glutathione pools of the cytosol, the IMS and the matrix in S. cerevisiae. To this end, we adapted Grx1-roGFP2 for expression in these compartments, and assessed the recovery of the respective local EGSH after oxidative challenge and subsequent removal of the oxidant. Using this assay we provide evidence that the glutathione pools of the IMS and the cytosol are kinetically connected, and that the IMS relies on cytosolic Glr1, cytosolic NADPH generation and porins in the OMM for the regulation of its EGSH. We also demonstrate that EGSH[matrix] is regulated independently of the cytosol and the IMS. Moreover, we find that selected IMS-localized redox pathways do not significantly contribute to the maintenance of EGSH[IMS]. Thus, we conclude that the main determinant of EGSH[IMS] is the cytosolic glutathione redox system. In agreement with this notion, we find that cytosolic Glr1 exerts a reducing influence on IMS-localized Mia40, which exists in a semi-oxidized (i.e., partially reduced) redox state in vivo.
Results
Establishment of a dynamic assay to assess EGSH
Redox-sensitive fluorescent proteins allow non-invasive monitoring of the composition of the local glutathione redox couple. The Grx1-roGFP2 sensor has two fluorescence excitation maxima at about 405 and 475–490 nm. The relative intensities of the excitation peaks depend on the redox state of the two cysteine residues engineered to be present on the surface of the roGFP2 β-barrel. The specific equilibration of the roGFP2 dithiol-disulphide redox pair with the glutathione redox pair is catalysed by the attached Grx1 moiety. We expressed the sensor in the cytosol of wt S. cerevisiae yeast cells. First, we tested how the sensor responded to the exogenous addition of high concentrations of either the oxidant diamide or the reductant dithiothreitol (DTT) (Figure 1A). To this end, we measured fluorescence excitation spectra of yeast cell suspensions grown on galactose. For Grx1-roGFP2, oxidation (addition of diamide) increased the 405-nm excitation peak while decreasing the 488-nm peak. Upon reduction (addition of DTT), the inverse situation was observed. The curves obtained from untreated and DTT-treated yeast cells ran close to each other, indicating that cytosolic Grx1-roGFP2 is almost fully reduced under steady-state conditions.
Figure 1.

Establishment of an assay to dynamically monitor the glutathione redox potential. (A) Properties of the Grx1-roGFP2 sensor. WT yeast cells expressing Grx1-roGFP2 were grown to mid-log phase in galactose-containing media. Excitation spectra (λemission=511 nm) were recorded on untreated cells (steady state=SS), and on cells pretreated with DTT or diamide (Dia). In parallel, the sensor redox states were analysed by alkylation shift assays (inset). (B) Ratiometric analysis of the steady state of the Grx1-roGFP2 sensor in the cytosol of S. cerevisiae. Excitation spectra were obtained as described in (A). The ratio of the intensities at 405 and 488 nm was formed for the steady state, the DTT and the diamide value. (C) Steady state of the Grx1-roGFP2 sensor in the cytosol of S. cerevisiae. The steady-state ratio from (B) was transformed to the degree of sensor oxidation—OxD (for calculation see Materials and methods) with an OxD=1 for the fully oxidized probe; OxD=0 for the fully reduced probe. (D) Scheme for the set-up of an oxidant recovery experiment. Yeast cells were incubated with 20 mM diamide for 5 min at 30°C under constant agitation, the oxidant was removed by washing twice with measurement buffer, and the recovery of the respective Grx1-roGFP2 sensors was monitored using a fluorescence spectrometer. Excitation spectra were obtained at different times after diamide washout using an emission wavelength of 511 nm. (E) Excitations spectra of an oxidant recovery experiment using Grx1-roGFP2. WT yeast cells expressing Grx1-roGFP2 were grown to mid-log phase in SC galactose media, and treated according to the protocol described in (D). (F) Recovery assay after oxidative shock. As (E) except that the intensities at the excitation wavelengths 405 and 488 nm were normalized to OxD values. The experiment could be repeated with the same sample (recovery 1, recovery 2). In parallel to recovery 1, the sensor redox states were analysed by alkylation shift assays (inset). (G) False colour fluorescence microscopy images of the recovery of the cytosolic redox sensor after oxidative shock in yeast cells.
To confirm that the measured curves represent the fully oxidized and reduced forms of the Grx1-roGFP2 sensor, we correlated the fluorescence measurements with alkylation-based gel-shift assays (Figure 1A, inset). Yeast cells were incubated with diamide or DTT, then precipitated by treatment with trichloroacetic acid (TCA), and then free thiols (i.e., reduced cysteines) were modified with the alkylating agent 4-acetamido-4′-maleimidylstilbene-2,2′-disulfonic acid (AMS). This agent increases the molecular weight of the modified protein, and consequently reduced proteins migrate slower on SDS–PAGE than oxidized proteins. Indeed, we found that DTT treatment resulted in a slower migration of AMS-treated Grx1-roGFP2, compared to diamide-exposed Grx1-roGFP2, and that samples obtained from untreated and DTT-treated cells behaved alike. It is important to note that full oxidation or reduction of Grx1-roGFP2 is not equivalent to full oxidation or reduction of the glutathione pool. The probe is restricted to monitor EGSH within a certain range (approximately from −320 to −240 mV) centred around its midpoint potential (approximately −280 mV; Meyer and Dick, 2010).
The ratios of emitted fluorescence after excitation at 405 and 488 nm (I405/I488) relate to the degree of oxidation (OxD) of the sensor and thus to the EGSH in the surrounding buffer. For the cytosolic Grx1-roGFP2 probe, we observed a steady-state I405/I488 ratio of 0.10±0.01 that was close to the value obtained upon DTT incubation (0.08±0.01). Incubation with diamide resulted in a ratio of 0.41±0.01 (Figure 1B). Thus, the incubations with DTT and diamide indicate a dynamic range of about five which is in line with another study using the same probe in the yeast cytosol (Morgan et al, 2011). The control incubations with DTT and diamide are utilized to calculate from the I405/I488 ratio the degree of roGFP2 oxidation (OxD). The calculation of OxD allows comparison of measurements obtained from independent experiments, and from sensors expressed in different compartments. This term will thus be used in all experiments throughout this study. The OxD of the cytosolic Grx1-roGFP2 sensor at steady state was 0.12±0.01, that is, 12% of the pool of sensor molecules was in an oxidized state (Figure 1C). This OxD translates into an EGSH[cytosol] of approximately −306±1.3 mV, a value slightly more reducing than previously obtained with the rxYFP probe (−289 mV, (Ostergaard et al, 2004); −286 mV (Hu et al, 2008)), and in good agreement with other studies using Grx1-roGFP2 (−310 and −320 mV (Braun et al, 2010; Morgan et al, 2011)), (see Supplementary Table S1 for a complete list of redox potentials).
The measurement of steady-state values alone does not allow comprehensive insights into the dynamics of cellular redox processes. We therefore aimed to establish an assay based on recovery following an oxidative challenge. To this end, cytosolic EGSH was monitored after bolus treatment with the oxidant diamide and subsequent washout (Figure 1D and for the establishment of the diamide concentration Supplementary Figure S1). When we applied this assay to yeast cells expressing Grx1-roGFP2 we found that during recovery the maximum at 405 nm decreased in intensity while the maximum at 488 nm increased (Figure 1E). Accordingly the OxD value decreased and within 4 min reached the steady-state value (Figure 1F). Notably, the diamide treatment did not significantly affect the viability of the yeast cells (Figure S2), and the oxidant recovery assay could be repeated on the same sample without obvious changes in the recovery kinetics (Figure 1F). The latter finding indicates that the capacities of the cellular reductive systems are not exhausted during the initial washout. The recovery of the redox sensor could also be visualized using alkylation shift assays (Figure 1F, inset) and fluorescence microscopy (Figure 1G) confirming the validity of our fluorescence spectroscopic approach.
Detailed analyses of the kinetics of sensor recovery (Supplementary Figure S3) revealed that the resulting recovery curve can be described by three parameters: (i) an initial lag phase that correlates with the maximal EGSH reached upon diamide treatment and thus represents the sensitivity of the cellular redox environment towards oxidant treatment; (ii) the rate of recovery that reflects the different cellular systems that influence sensor reduction, and (iii) the steady-state OxD of Grx1-roGFP2 that indicates the degree of probe oxidation and thus the balance between oxidizing and reducing contributions acting on the local glutathione pool.
EGSH in the mitochondrial matrix, the IMS and the cytosol recovers with similar kinetics
To investigate the interplay of the glutathione pools of the cytosol, the IMS and the matrix, we first adapted the Grx1-roGFP2 sensor for measurements in the mitochondrial compartments. Thus, we equipped the sensor with mitochondrial targeting sequences for the IMS (b2-Grx1-roGFP2) and the mitochondrial matrix (Su9-Grx1-roGFP2). We then verified the correct targeting of the respective sensors by cellular fractionation and mitochondrial subfractionation (Figure 2A). Grx1-roGFP2 localized exclusively to the cytosol (Figure 2A, top). The b2-Grx1-roGFP2 localized to the mitochondrial fraction and could be completely protease digested in mitoplasts (i.e., mitochondria with a ruptured outer membrane) demonstrating its localization to the IMS (Figure 2A, middle, lane 5). Su9-Grx1-roGFP2 also localized to the mitochondrial fraction but was only protease accessible in completely lysed mitochondria and not in intact mitochondria or in mitoplasts (Figure 2A, bottom, lane 6), therefore indicating its matrix localization.
Figure 2.

EGSH[cytosol], EGSH[IMS] and EGSH[matrix] recover fast and with similar kinetics to their steady-state values after oxidative shock. (A) Mitochondria-targeted constructs of Grx1-roGFP2 and their subcellular localization. The white box represents the Grx1-roGFP2 protein, the helix represents the amphipathic helix required for matrix targeting, and the grey box represents the hydrophobic sorting domain required for IMS targeting. The targeting sequences of the mitochondrial proteins subunit 9 of the ATPase (Su9, aa 1–69) and cytochrome b2 (aa 1–86) were fused to Grx1-roGFP2. The subcellular localization of Grx1-roGFP2, Su9-Grx1-roGFP2 and b2-Grx1-roGFP2 was assessed in WT yeast cells (BY4742) expressing Grx1-roGFP2, Su9-Grx1-roGFP2 and b2-Grx1-roGFP2. Cells were grown to mid-log phase in SLac+0.1% galactose media, they were lysed and fractionated, and fractions were analysed by SDS–PAGE and immunoblotting using antibodies directed against roGFP2, 3-phosphoglycerate kinase (Pgk1) and actin (Act1; both cytosol), the mitochondrial ribosomal protein Mrpl36 (matrix), Mia40 (IMS), or the subunit of the translocase of the outer membrane Tom70 (OMM). Cells were fractionated into post-mitochondrial supernatant (C) and mitochondria (M). Mitoplasts (MP) were generated from mitochondria by hypo-osmotic swelling. Mitochondria were also lysed with Triton X-100 (TX-100), and all fractions were treated with proteinase K (PK) as indicated. (B) Recovery of the redox states of Grx1-roGFP2 probes in different compartments after diamide washout. WT yeast cells expressing Grx1-roGFP2, Su9-Grx1-roGFP2 and b2-Grx1-roGFP2 were analysed as described in Figure 1F (growth on galactose as carbon source). In addition, the redox states of the sensors at steady state were obtained as described in Figure 1C. Reported values are the mean of three independent experiments. Error bars are the means±s.d.
The steady-state OxD for the IMS and the matrix was 0.17±0.04 and 0.17±0.02, respectively (Figure 2B, bars). These values translate to redox potentials of −301±5 and −301±2 mV, respectively. In the oxidant recovery assay both mitochondrial sensors behaved like the cytosolic sensor—following diamide washout they recovered rapidly to the respective steady states with similar kinetics (Figure 2B). This indicates that all three compartments either harbour GSSG-reducing systems or are in contact with compartments in which GSSG can be reduced. Taken together, we established the dynamic measurement of the EGSH in the matrix, the IMS and the cytosol. This newly established assay should allow the investigation of different redox influences on the glutathione pool in different compartments with high temporal resolution.
The cytosolic Glr1 system maintains EGSH of the IMS
It has previously been reported that the glutathione pool of the IMS is maintained independently from its cytosolic counterpart (Hu et al, 2008). In this study, the composition of the glutathione pool at steady state was analysed by redox western blots of rxYFP probes. EGSH was thereby determined in the IMS, the matrix and the cytosol of strains lacking Glr1 (Δglr1), or harbouring it only in the cytosol and not in the mitochondrial matrix (Δglr1+cyto-GLR1) (Figure 3A). Hu et al (2008) observed that the IMS-targeted redox-sensitive probe was significantly more oxidized than the respective cytosolic and matrix variants of this sensor. Furthermore, EGSH[IMS] was not affected in a Δglr1 strain, while EGSH[cytosol] and EGSH[matrix] became significantly more oxidizing than in wt cells.
Figure 3.

The cytosolic glutathione reductase system is the major determinant of EGSH[IMS]. (A) Scheme of the enzymes analysed in these experiments. (B) Steady states of the cytosolic and mitochondrial sensors (Grx1-roGFP2, Su9-Grx1-roGFP2, b2-Grx1-roGFP2) in yeast mutants of the glutathione system. Experiment was performed as described in Figure 1C. (C–F) Recovery kinetics after diamide shock on mutants of the glutathione reductase system. WT yeast cells were compared to cells from Δglr1 (C), Δglr1+GLR1 (D) Δglr1+cyto-GLR1 (E) or Δzwf1 (F) strains, respectively. Cells expressing Grx1-roGFP2, Su9-Grx1-roGFP2 and b2-Grx1-roGFP2 were analysed as described in Figure 1F (growth on galactose as carbon source). Reported values are the mean of three independent experiments. Error bars are the means±s.d.
Using Grx1-roGFP2 we could not confirm these findings. In wt cells, the OxD values differed only slightly between the three compartments and deletion of GLR1 resulted in increased OxD values at steady state in all three compartments (Figure 3B). This increase was most pronounced in the matrix (OxD[Δglr1]=0.78±0.03 compared to OxD[wt]=0.17±0.02), and it was reversed for all three compartments upon complementation of the Δglr1 strain with Glr1 expressed from a plasmid. The complementation of the Δglr1 strain specifically with the cytosolic form of Glr1 resulted in wt-like OxD values in both the cytosol and the IMS, but not in the mitochondrial matrix (Figure 3B).
We could not assess a situation where Glr1 is exclusively localized to the mitochondrial matrix because this strain also contains significant amounts of active Glr1 in the cytosol, presumably due to inefficient targeting (Outten and Culotta, 2004). Instead we chose to analyse a Δzwf1 strain. ZWF1 encodes glucose-6-phosphate dehydrogenase, the enzyme that provides the majority of NADPH for the cytosol, but not for the matrix. In this strain, the cytosolic sensor was more oxidized compared to the wt, however not to the extent found in a Δglr1 strain, while the matrix sensor exhibited a steady state almost identical to the sensor expressed in the wt background. The IMS-localized sensor exhibited only a slightly more oxidized state compared to the wt (Figure 3B).
Next, we examined how changes in the compartmental expression pattern of Glr1 influenced the respective recovery kinetics. When comparing wt with Δglr1 cells we found that in all three compartments the recovery of the Grx1-roGFP2 probes after diamide challenge was strongly impaired by the absence of Glr1 (Figure 3C). Interestingly, the cytosolic sensor appeared to show some recovery—although with much slower kinetics as compared to the wt—and after an extended lag phase. The IMS probe recovered very slowly following an initial lag phase of similar duration to that of the cytosolic sensor, while the matrix Grx1-roGFP2 sensor remained almost completely oxidized for the duration of the experiment. The residual recovery is presumably facilitated by the thioredoxin system, which functionally overlaps with the glutathione system (Trotter and Grant, 2005; Kumar et al, 2011), or by export of GSSG from the cytosol to the vacuole (Zechmann et al, 2011). These findings also correlate with the OxD values at steady state in these strains, which are lowest in the cytosol (Figure 3B). The Δglr1 strain could be complemented by the reintroduction of Glr1 (Figure 3D). However, the reintroduction of only the cytosolic form of Glr1 resulted in a strongly impaired recovery in the matrix while the recovery kinetics of the sensors in the cytosol and the IMS paralleled those in the wt (Figure 3E).
In the Δzwf1 strain, the recovery of the matrix sensor appeared to be almost like in wt cells (Figure 3F). In the cytosol and in the IMS, the Grx1-roGFP2 probe exhibited an extended lag phase indicating an increased sensitivity of the respective glutathione pools to diamide treatment. After the lag phase, sensor recovery proceeded only slightly slower compared to the wt. This suggests that sufficient amounts of NADPH are generated by backup systems to facilitate efficient EGSH recovery after oxidative stress but not to withstand prolonged oxidant treatment. This NADPH is likely supplied by the activity of Ald6 an aldehyde dehydrogenase which has previously been shown to be critical in the absence of a functional pentose phosphate pathway (Grabowska and Chelstowska, 2003). We could not analyse a Δzwf1/Δald6 strain, because the concomitant deletion of ALD6 and ZWF1 is not viable (Grabowska and Chelstowska, 2003). The results obtained in the Δzwf1 strain further highlight the advantage of the oxidant recovery assay over the sole determination of steady-state OxD values as OxD[IMS] and OxD[cytosol] at steady state differed only slightly from the respective value in the wt; only the dynamic analysis revealed differences between the two strains. Taken together, our data indicate that the cytosolic and the IMS glutathione pools are kinetically connected—that is, they might readily exchange glutathione, while the glutathione pool in the matrix is maintained separately.
The IMS redox sensor in isolated mitochondria is accessible to exogenous GSH
Our data so far indicated that the glutathione pools of the IMS and cytosol are connected. Conversely, it appears that the IMM prevents rapid equilibration of the IMS and matrix glutathione pools. To verify these findings, we analysed the reaction of the Grx1-roGFP2 sensors in isolated mitochondria towards exogenously added GSH (Figure 4). After isolation of mitochondria, both b2-Grx1-roGFP2 and the Su9-Grx1-roGFP2 were fully oxidized. Upon addition of a system that supplies GSH (GSSG, NADPH, Glr1), the IMS sensor became more reduced. This reduction did not take place when mitochondria were only supplied with NADPH and GSSG, indicating that the IMS does not harbour an NADPH-dependent GSSG reductase. Contrary to the IMS probe, the OxD of the matrix Grx1-roGFP2 did not change upon addition of GSSG, Glr1 and NADPH (Figure 4). Only upon lysis of mitochondria by the addition of the detergent Triton X-100 did the matrix-localized probe became quickly reduced.
Figure 4.

The IMS is accessible to exogenous GSH. Mitochondria from WT yeast cells harbouring either b2-Grx1-roGFP2 or Su9-Grx1-roGFP2 were isolated and analysed in a fluorescent spectrometer upon incubation with glutathione reductase, NADPH, GSH and Triton X-100 (TX-100) as indicated. After isolation of mitochondria, the respective probes are fully oxidized (=100% oxidized Grx1-roGFP2). The incubation with DTT at the end of the kinetics served as control for fully reduced proteins (=0% Grx1-roGFP2).
Modulation of IMS redox pathways influences EGSH[IMS] only to a minor extent
Due to its proximity to the respiratory chain, the IMS glutathione pool might be influenced by the activity of the respiratory chain, for example, by release of reactive oxygen species (ROS). We investigated such an influence on EGSH[IMS], and assessed whether and how it might be counterbalanced by the connection of the glutathione pools of cytosol and IMS (Figure 5). To this end, we first assessed EGSH upon cell growth on fermentable (galactose) and non-fermentable (glycerol) carbon sources—the latter requiring activity of the respiratory chain (Figure 5A). EGSH[cytosol] and EGSH[IMS] at steady state were similar in galactose and glycerol grown cells, but not EGSH[matrix] that was slightly more oxidizing upon growth on glycerol. These findings were paralleled by our analyses of EGSH recovery after oxidative shock. EGSH[IMS] and EGSH[cytosol] measured in cells grown on galactose and glycerol recovered similarly, while EGSH[matrix] recovered in cells grown on glycerol to the more oxidized EGSH found at steady state (Figure 5B).
Figure 5.

IMS redox pathways exert only a limited influence on EGSH[IMS]. (A) Steady states of the cytosolic and mitochondrial sensors (Grx1-roGFP2, Su9-Grx1-roGFP2, b2-Grx1-roGFP2) in wt cells grown on galactose (Gal) or glycerol (Glyc). Experiment was performed as described in Figure 1C. Reported values are the mean of three independent experiments. Error bars are the means±s.d. (B) Recovery kinetics after diamide shock in wt cells grown on galactose or glycerol. Cells expressing Grx1-roGFP2, Su9-Grx1-roGFP2 and b2-Grx1-roGFP2 were analysed as described in Figure 1F. Reported values are the mean of three independent experiments. Error bars are the means±s.d. (C) Scheme of the investigated IMS redox pathways. (D) Scheme depicting the three parameters to evaluate the recovery kinetics after oxidative shock: (i) apparent lag phase, (ii) recovery rate and (iii) steady-state OxD. For full description, see Supplementary Figure S2. (E) Qualitative representation of the results obtained from the analysis of (i) chemical treatments to inhibit complexes of the respiratory chain (antimycin A (AntA), potassium cyanide (KCN) to inhibit complexes III and IV, respectively, and paraquat to induce mitochondrial oxidative stress), (ii) mutants that result in defective respiratory chain complexes (Δrip1, Δcox17, Δnde1 and Δnde2), (iii) deletions of enzymes counteracting ROS (Δsod1, Δsod2, Δccp1) and (iv) strains that express Erv1 and Mia40 under the control of regulatable promoters. The full set of data is presented in Supplementary Figures S4–S8, respectively.
We next wanted to investigate the contributions of IMS-localized redox processes to EGSH[IMS] including the respiratory chain, antioxidative systems and the Erv1-Mia40 machinery for protein oxidation (Figure 5C). Thus, we investigated mutants that result in defective respiratory chain complexes (Δnde1, Δnde2, Δrip1 and Δcox17), chemical treatments to inhibit complexes of the respiratory chain (antimycin A (AntA), potassium cyanide (KCN) to inhibit complexes III and IV, respectively, and paraquat to induce mitochondrial oxidative stress), mutants of pathways counteracting ROS (Δccp1, Δsod1, Δsod2), and strains that express Mia40 and Erv1 under the control of regulatable promoters (Figure 5D and E; Supplementary Figures S4–S8). Notably, in most mutants and upon most chemical treatments EGSH was not or was only mildly affected. The exception was the treatment with AntA of cells grown on glycerol. OxD recovery in these strains exhibited an elongated apparent lag phase in all compartments. In summary, our data indicate that the cytosolic and the IMS glutathione pools are physically connected, and that cytosolic redox systems and not IMS-localized pathways constitute the major determinants of the glutathione pool in the IMS.
Por1 couples the glutathione pools of the IMS and the cytosol
The cytosol and IMS are separated by the OMM, which contains porins as the major gateways for the exchange of small molecules. Of the two porins in yeast, Por1 is the predominant isoform. A study by Cummings et al (2000) on isolated mitochondria from cells lacking porins indicated that in this in-vitro setting porins do not contribute to glutathione transport to the mitochondrial matrix which might be due to a rate limiting transport of glutathione over the IMM (see Figure 4). The Grx1-roGFP2 sensor provides a tool to study glutathione transport into the IMS in vivo, and we thus analysed the glutathione pools in a Δpor1 mutant (Figure 6). The OMM of the Δpor1 mutant has previously been shown to have a limited permeability towards small molecules (Lee et al, 1998) that is not fully complemented by the adaptive upregulation of the TOM pore (Antos et al, 2001; Kmita et al, 2004). In Δpor1 cells, the steady-state OxD remained unchanged for both the cytosol and the matrix, as compared to wt cells. In contrast, the IMS was clearly more oxidized with an OxD of 0.67±0.17, a value comparable to the one found in the Δglr1 strain for the IMS. Thus, in the absence of Por1 the IMS glutathione redox pool no longer equilibrates with the cytosol. Moreover, the unaffected matrix sensor OxD is in support of there being little or no glutathione redox communication between the IMS and the matrix.
Figure 6.

Porins control EGSH[IMS]. (A) Scheme of the strain used. (B) Steady states of the cytosolic and mitochondrial sensors (Grx1-roGFP2, Su9-Grx1-roGFP2, b2-Grx1-roGFP2) in Δpor1 cells. Experiment was performed as described in Figure 1C. Reported values are the mean of three independent experiments. Error bars are the means±s.d.
The IMS oxidoreductase Mia40 in vivo retains a semi-oxidized redox state by the activity of Erv1 and cytosolic Glr1
After determining the processes that maintain EGSH[IMS], we asked whether the IMS glutathione pool influences redox processes in the IMS (Figure 7). The machinery for oxidative protein folding in the IMS is an obvious candidate for such a cross-talk since it has previously been shown that at least in vitro GSH increases the efficiency of target protein oxidation (Bien et al, 2010). Moreover, for the ER an influence of glutathione on protein oxidation has already been demonstrated. Here, GSH reduces oxidoreductases that can subsequently partake in isomerization reactions. On the other hand, GSSG can oxidize oxidoreductases and thus contributes oxidizing equivalents to oxidative folding (Jessop and Bulleid, 2004; Appenzeller-Herzog, 2011).
Figure 7.

The in-vivo redox state of Mia40 is partially reduced. (A) The pathway for disulphide bond formation in the IMS. Reduced substrates are oxidized by Mia40 which in turn is re-oxidized by Erv1. From Erv1 electrons can be passed on directly to oxygen or to respiratory chain complex IV. (B) In-vivo redox state of Mia40 in wild-type yeast cells. Cells were precipitated with TCA. The resulting pellet was resuspended in a buffer containing 50 mM NEM. The samples were analysed on non-reducing SDS–PAGE followed by immunoblotting against Mia40. SS; steady state. Reported values are the mean of three independent experiments. Error bars are the means±s.d. (C) Erv1 levels in cells that express Erv1 under the control of a regulatable promoter. Cells were grown either in galactose or in glucose to raise or lower cellular Erv1 levels, respectively. Erv1 levels were tested by western blot analysis. (D) Redox state of Mia40 in cells with different Erv1 levels. As (B), except that cells expressed Erv1 under the control of a regulatable promoter. Cells were grown either in galactose or in glucose to raise or lower cellular Erv1 levels, respectively. Reported values are the mean of three independent experiments. Error bars are the means±s.d. (E) Redox state of Mia40 in Δrip1 and Δcox17 cells in the presence of 20 or 1% oxygen. As (B), except that the experiment was performed with Δrip1 and Δcox17 cells in the presence of different oxygen concentrations. The experiments have been performed three times independently. Error bars are the means±s.d. Figure source data can be found with the Supplementary data.
The oxidoreductase of the IMS is Mia40. It carries one redox-active cysteine pair that directly interacts with cysteines in unfolded substrates (Figure 7A). In principle, Mia40 could facilitate oxidizing and reducing reactions depending on whether its redox-active cysteines are in their oxidized or reduced state, respectively. Notably, so far the redox state of Mia40 has only been analysed in isolated mitochondria, and not in intact cells. It is likely that under in-vitro conditions the Mia40 redox state is distorted by air oxidation. We thus applied an alkylation-based gel shift assay with N-ethylmaleimide (NEM) to wt cells to determine the in-vivo redox state of Mia40 (Figure 7B). We found that Mia40 existed as a mixture of oxidized and reduced molecules contrary to most in-vitro studies that found Mia40 mainly in the oxidized state (Mesecke et al, 2005; Bihlmaier et al, 2007).
Following substrate oxidation, Mia40 is re-oxidized by the sulphhydryloxidase Erv1 (Figure 7A). To test whether an oxidizing influence of Erv1 can also be observed in vivo, we modulated the concentration of Erv1 using a strain that expresses Erv1 under the control of a regulatable promoter (Figure 7C). The Mia40 redox state did not change significantly upon overexpressing Erv1, indicating that Erv1 is not limiting for Mia40 re-oxidation (Figure 7D). Conversely, in cells with lower Erv1 levels Mia40 was almost completely reduced, suggesting that reducing influences, e.g., glutathione or substrate oxidation supersede the limited oxidizing capacity of the remaining Erv1.
The final electron acceptor for Mia40 re-oxidation by Erv1 is oxygen. In isolated mitochondria and in vitro Erv1 can transfer electrons either directly to oxygen or via cytochrome c and complex IV of the respiratory chain (Figure 7A). To test the contribution of these pathways to the re-oxidation of Mia40 in vivo, we analysed deletion mutants of RIP1 and COX17 in the presence of either 20 or 1% oxygen. The deletions of these genes result in the absence of functional respiratory chain complexes III and IV, respectively. Notably, we did not observe a difference in the Mia40 redox state in any of these strains in the presence of 20% oxygen (Figure 7E, lanes 1, 3 and 5). However, when analysing the redox state under oxygen-limited conditions Mia40 became more reduced in the Δcox17 strain, while Mia40 in wt and Δrip1 cells exhibited a similar redox state (Figure 7E, lanes 2, 4 and 6). Taken together, these data indicate that Erv1 can in vivo transfer electrons via complex IV to oxygen. Oxygen does not directly act on Mia40 since Erv1 depletion leads to almost completely reduced Mia40 even in the presence of 20% oxygen. Moreover, our results suggest that at oxygen concentrations of 20% the re-oxidation of Mia40 can in vivo be efficiently driven by the direct interaction of Erv1 and oxygen.
After verifying oxidizing influences on Mia40 in vivo, we next wanted to test which reducing pathways act on Mia40 or more specifically whether the redox state of Mia40 is susceptible to changes in EGSH (Figure 8A). To this end, we investigated a Δglr1-based strain in which we can control the expression of Erv1 (Figure 8B). Cells lacking GLR1 have a more oxidizing EGSH[IMS] compared to the wt (Figure 3B). In addition, the recovery of EGSH[IMS] after oxidant treatment is strongly impaired in Δglr1 cells compared to wt cells (Figure 3C). However, the Mia40 redox state did not significantly differ in Δglr1 cells compared to wt cells (Figure 8C). Cells depleted of Erv1 exhibit a more reduced Mia40 redox state, but also in these cells the additional deletion of GLR1 did not affect the Mia40 redox state (Figure 8C). We thus decided to apply a dynamic oxidant recovery assay (Figure 8D) on the cells depleted of Erv1 since a recovery of Mia40 after oxidation is easier to follow if the redox state at steady state is reduced. The recovery after oxidative shock to this more reduced steady state of Mia40 proceeded faster in the strain depleted of Erv1 compared to the strain depleted of Erv1 that additionally lacked Glr1 (Figure 8E), indicating that Glr1 influences the Mia40 redox state.
Figure 8.

EGSH[IMS] is a determinant of the Mia40 redox state. (A) Scheme depicting the hypothetical influence of the glutathione pool on Mia40 thus giving rise to a partially reduced Mia40 at steady state. (B) Protein levels in wild type, Δglr1, GalL-Erv1 and GalL-Erv1/Δglr1 cells. (C) Redox states of Mia40 in wild type, Δglr1, GalL-Erv1 and GalL-Erv1/Δglr1 cells. Cells were analysed as described in Figure 7B. Reported values are the mean of three independent experiments. Error bars are the means±s.d. (D) Scheme for the set-up of an oxidant recovery experiment. Yeast cells were incubated with 20 mM diamide for 5 min at 30°C under constant agitation, the oxidant was removed by washing twice with measurement buffer, and the recovery of the Mia40 redox state was assessed at different times using the NEM alkylation-based gel shift assay. (E) Oxidant recovery kinetics of Mia40 in GalL-Erv1 and GalL-Erv1/Δglr1 cells. Cells were analysed as described in (C). Reported values are the mean of two independent experiments. Figure source data can be found with the Supplementary data.
Taken together, we determined for the first time the in-vivo redox state of the oxidoreductase Mia40, and found it to be semi-oxidized. Moreover, we confirmed the oxidizing influence of Erv1 (and the respiratory chain and oxygen) on Mia40, and we found a reducing influence of cytosolic Glr1 and thus of the glutathione pool in the IMS on the Mia40 redox state.
Discussion
The glutathione pools of the cytosol and the IMS are connected by the porins in the OMM
In this study, we developed an approach to investigate the dynamics of EGSH in different cellular compartments. By using this assay we demonstrate that the glutathione pools of the IMS and the cytosol are kinetically connected, that is, that they quickly equilibrate with each other (Figure 9A). This notion is supported by the following results: (i) The maintenance of the Grx1-roGFP2 redox state in the IMS is dependent on the presence of porins (Por1) in the OMM (Figure 6). (ii) In strains expressing only the cytosolic version of Glr1, the cytosolic and IMS glutathione pools recover with similar kinetics (Figure 3E), whilst matrix recovery is strongly impaired. (iii) The recovery of EGSH in both the cytosol and the IMS depend on cytosolic NADPH levels (Figure 3F). Moreover, (iv) the addition of GSH to isolated mitochondria rapidly reduces Grx1-roGFP2 in the IMS (Figure 4) and (v) the absence of Glr1 hampers the redox state recovery after oxidative shock of the IMS-localized oxidoreductase Mia40 (Figure 8E). Taken together, these data imply that the cytosolic glutathione pool is kept reduced by Glr1, and this pool equilibrates with its counterpart in the IMS mainly via Por1 in the OMM. Consequently, our data support the idea that the OMM is permeable for glutathione (GSH diffusing into the IMS, or GSSG diffusing out) under the conditions investigated. We also conclude that the IMS does not contain its own GSSG-reducing machinery.
Figure 9.

Model for the dynamics, interplay and physiological impact of the cytosolic and mitochondrial glutathione pools. (A) Fast cross-talk via porins in the OMM takes place between the glutathione pools of the IMS and the cytosol. Because of this dynamic glutathione exchange the cytosolic glutathione reductase system exerts the major influence on the composition of the IMS glutathione pool. Although the matrix relies on glutathione delivery from the cytosol for replenishing its glutathione pool, EGSH[matrix] is maintained by matrix-localized reducing systems as GSSG cannot be exported from the matrix. (B) The oxidoreductase of the IMS Mia40 is in vivo partially reduced. Its redox state is maintained by reducing influences from the local glutathione pool (and newly imported reduced substrates), and oxidizing influences from the sulphhydryloxidase Erv1. In-vivo Erv1 can shuttle its electrons either directly to oxygen or via the respiratory chain. This latter pathway might only be required under conditions of low oxygen.
Contrary to our results, a previous study (Hu et al, 2008) concluded—from redox western blot-based experiments performed with rxYFP—that the glutathione pools of the IMS and the cytosol are independently regulated, and thus that cytosolic Glr1 does not support the maintenance of EGSH[IMS]. How can these differences be explained? In our study and in the one by Hu and colleagues the genetic background and the applied IMS targeting sequence were identical. However, Hu et al utilized an rxYFP variant that was not fused to a glutaredoxin and therefore relied on endogenous glutaredoxins for the rapid and complete equilibration with the surrounding glutathione pool. If endogenous glutaredoxin availability or activity is limiting, then rxYFP may become oxidized by other processes (e.g., by ROS from the respiratory chain) and thus lose its ability to act as a specific reporter for the glutathione redox couple. In mammalian cells, Grx1 has been shown to localize to the IMS (Pai et al, 2007). However, it remains unclear if yeast contains a glutaredoxin in the IMS, and, if so it is not clear whether it reaches a concentration that is not rate limiting for the equilibration of the sensor with the glutathione pool. Taken together, it is possible that the conventional rxYFP sensor does not fully equilibrate with the IMS glutathione pool but instead becomes a target of direct oxidation from different sources. This could explain the more oxidized EGSH[IMS] found by Hu and colleagues.
The glutathione redox state of the matrix is maintained separately from the IMS and the cytosol
Our results also imply that the IMM prevents the equilibration of the glutathione pools in matrix and IMS in vivo and in vitro, and that the matrix has to rely on its own glutathione reduction machinery for maintaining EGSH. Our dynamic experiments rely on the recovery of oxidized glutathione pools (either because we treated cells with diamide or we used isolated mitochondria containing an oxidized sensor and thus GSSG). The recovery of EGSH[matrix] under these conditions likely relies on the efficient removal of GSSG (i.e., by reduction or export from the matrix), and not the import of GSH from the IMS/cytosol since extremely large amounts of GSH had to be imported to balance the GSSG and reach steady-state EGSH[matrix]. In wt cells recovery is mediated by matrix-localized Glr1. In cells lacking Glr1 in the matrix, EGSH[matrix] does not recover. We therefore conclude that no transporter in the IMM exports GSSG in appreciable amounts. We can however not draw any conclusions on the rate of GSH import over the IMM.
Using the dynamic recovery assay, we also found various conditions that resulted in isolated differences of the three parameters of the recovery curve of the matrix and IMS sensors as defined in Figure 5D and Supplementary Figure S3 (Δsod2 strain; treatment with AntA of cells grown on galactose and treatment with paraquat; Erv1 overexpression). Treatment with AntA of cells grown on galactose resulted in an elongated lag phase in the matrix, treatment with paraquat in a higher OxD at steady state in the matrix and in Δsod2 cells the matrix sensor exhibited a flatter slope of the recovery curve (Supplementary Figures S5 and S7). Conversely, the overexpression of Erv1 led to a higher OxD at steady state in the IMS (Supplementary Figure S8). This isolated modulation of the different parameters of the recovery curve might provide a valuable tool that in future studies will help to exactly define the molecular basis of these parameters.
The cytosolic Glr1 system is the major determinant of the EGSH in the IMS
Steady-state EGSH[cytosol] and EGSH[IMS] as well as their recovery after oxidative challenge are similar (Figure 2B). Moreover, the modulation of IMS-localized redox pathways did not result in large changes in steady-state EGSH[IMS] or in the recovery kinetics following diamide washout (Supplementary Figures S4–S8), except for the AntA treatment of glycerol-grown cells that affected the lag phase of recovery in cytosol, matrix and IMS alike. However, the modulation of the cytosolic Glr1 levels led to major differences in both steady-state EGSH and reductive recovery kinetics. We thus propose that cytosolic redox systems are the major determinants of EGSH[IMS]. IMS-localized proteins and enzymatic machineries might benefit from the reducing conditions in the IMS by a faster reversal of glutathionylation in vivo, and by the abundance and fast replenishment of GSH as an antioxidative defence system.
However, the cytosol-like EGSH[IMS] might not be advantageous for oxidative folding that facilitates the major pathway for protein import into the IMS. In contrast, the ER which serves as the major site of oxidative folding in eukaryotic cells is known to maintain a more oxidizing EGSH compared to the cytosol. It has also been shown that rat liver microsomes are impermeable to GSSG (Banhegyi et al, 1999), suggesting that removal of GSSG from the IMS might be as critical as GSH import to maintain the reducing EGSH[IMS]. The high stability of the structural disulphide bonds found in the IMS (redox potentials in the range of −320 mV) and the low redox potential of the active site cysteine pair of the oxidoreductase Mia40 (−290 mV; Tienson et al, 2009) compared to ER oxidoreductases thus may represent adaptations to the low EGSH found in the IMS. The reducing EGSH[IMS] further opens up the possibility of redox regulation by reversible disulphide bond formation upon slight deflections of EGSH (Riemer et al, 2009; Meyer and Dick, 2010).
The cytosolic glutathione pool influences the Mia40 redox state
The possibility of reversible disulphide bond formation in the IMS is supported by the effects of varying EGSH[IMS] on the redox state of Mia40 (Figure 9B). The in-vivo redox state of Mia40 at steady state is about 70% oxidized (Figure 7B). It strongly depends on the oxidizing activity of Erv1 (Figure 7D), while at least at ambient oxygen concentrations (20%) complex IV activity appears to be dispensable (Figure 7E). Upon depletion of Erv1, Mia40 becomes significantly more reduced suggesting a reducing pressure on Mia40, most likely exerted by the local glutathione pool. This concept is supported by the impaired recovery of the Mia40 redox state in cells lacking Glr1 (Figure 8E). We thus propose that the local glutathione pool provides reducing equivalents to Mia40. However, it is not clear whether glutathione directly interacts with Mia40 or whether Mia40 reduction is mediated by a catalyst such as a glutaredoxin.
The reduced fraction of Mia40 cannot contribute to oxidation of proteins, but might for example be involved in isomerization of more complex substrates, in deglutathionylation of proteins, in reduction of proteins prior to their degradation, or in reduction of proteins to regulate their activity. Most of these functions have been attributed to oxidoreductases in other cellular compartments. However, at present it remains unclear which of these functions might be fulfilled by Mia40. In Δglr1 cells, the simple proteins (helix-loop-helix conformation with two disulphides) so far identified as targets for Mia40 do not exhibit changes in their levels which in past studies served as a measure for the efficiency of the Mia40 import pathway (Chacinska et al, 2004; Naoe et al, 2004; Mesecke et al, 2005; Supplementary Figure S9). Therefore, in future studies it will be exciting to identify more complex substrates of Mia40 that might interact with the reduced oxidoreductase in one of the above described processes so as to clarify the role of reduced Mia40 in the IMS.
Materials and methods
Primers, plasmids, yeast strains and media
For primers, plasmids and yeast strains see Supplementary Tables S2 and S3. For all experiments using Grx1-roGFP2, cells were grown in synthetic medium (0.17% yeast nitrogen base, 0.5% (NH4)2SO4, pH 5.5) containing drop-out-mix lacking uracil and leucine, respectively (20 mg/l L-adenine sulphate, 20 mg/l, L-arginine, 20 mg/l histidine, 30 mg/l L-isoleucine, 30 mg/l L-lysine, 20 mg/l L-methionine, 50 mg/l L-phenylalanine, 20 mg/l L-threonine, 20 mg/l tryptophane, 20 mg/l L-tyrosine, 150 mg/l L-valine) supplemented with 2% galactose. For growth on non-fermentable carbon sources, galactose was replaced by 2% glycerol. For drop dilution assays, 5 μl of ten-fold dilutions of 1 OD600/ml cells was plated on YPD.
Antibodies
The following antibodies were used: anti-roGFP2 (this study), anti-Pgk1 (Invitrogen), anti-Tom70 (Bien et al, 2010), anti-Erv1 and anti-Mia40 (Bien et al, 2010), anti-Mrpl36 (Gruschke et al, 2010), anti-Mrpl40 (Gruschke et al, 2010), anti-Act1 (Novus Biologicals) and anti-Glr1 (antibodies online). To generate the roGFP2 antibody, roGFP2 was purified and used for immunization of rabbits.
Isolation of mitochondria, subcellular fractionation and in-vivo redox state analyses using AMS
These methods were performed as described previously (Kloppel et al, 2011).
In-vivo redox state analyses of Mia40 using NEM
This method was essentially performed as described previously (Bien et al, 2010), except that 1 OD600 unit of cells were lysed and precipitated in 10% TCA. Subsequently, cells were resuspended in SDS-loading buffer containing 50 mM NEM and analysed in western blots against Mia40. For oxidant recovery assays, cells were incubated with 20 mM diamide for 5 min at 30°C. Then, cells were washed twice and recovery was monitored.
Fluorescence measurements and assay to monitor the recovery after oxidative shock
Fluorescence measurements were performed with a spectrofluorometer FP6500 (Jasco) at 30°C with constant stirring. Spectra were recorded using excitation wavelengths from 390 to 500 nm (bandwith ±1.5–2.5 nm) and an emission wavelength of 511 nm (bandwith ±1.5–5 nm). Measurements were performed in a quartz cuvette (Hellma Analytics, light path 5 mm). For the measurements, yeast cells were grown to mid-log phase, 20 OD600 units of cells (∼1.5 × 10⁸ cells) were harvested and centrifuged at 4700 g for 2 min at 25°C. The pellet was resuspended in 2 ml measurement buffer (0.1 M Sorbitol, 0.1 M NaCl, 0.1 M Tris–HCl pH 7.4) and split into 4 × 500 μl aliquots for the measurement of the steady state, the oxidized and reduced controls, and the recovery experiment, respectively. The samples were centrifuged at 4700 g for 2 min at 25°C. The pellets were resuspended in 450 μl measurement buffer. For the measurement of the reduced and oxidized controls, 50 μl 1 M DTT or 50 μl 200 mM diamide was added to 450 μl cell suspension, respectively. The cells were incubated for 5 min at 30°C with constant shaking at 400 r.p.m. The reduced control was measured directly. For the oxidized control the diamide was removed, the pellet was resuspended in 500 μl measurement buffer and fluorescence was measured immediately. The samples were monitored for 2 min. During this time the signals remained constant. For the steady state, 50 μl measurement buffer was added to 450 μl cell suspension and fluorescence was measured for 2 min. During this time the signals remained constant. To assess the dynamic recovery of the glutathione redox state after oxidative shock 50 μl 200 mM diamide was added to 450 μl cell suspension and incubated for 5 min at 30°C with constant shaking at 400 r.p.m. Cells were centrifuged and the pellet was washed in 500 μl measurement buffer. After a second centrifugation step, the pellet was resuspended in 500 μl measurement buffer and fluorescence was measured immediately for 10 min.
Chemical treatments
Yeast strains were grown to mid-log phase, 21 OD600 units of cells were harvested and centrifuged at 4700 g for 2 min at 25°C. The pellet was resuspended in 6.5 ml measurement buffer and treated with 5 mM Paraquat or 10 μM AntA (2 μM for growth on glycerol) for 30 min at 30°C or with 1 mM KCN for 1 h at 30°C, respectively. After the treatments, 20 OD600 units of cells were harvested and fluorescence measurements were performed as described above.
Assays on isolated mitochondria
In all, 50 μg mitochondria isolated from wt cells expressing either Su9-Grx1-roGFP2 or b2-Grx1-roGFP2 were resuspended in SH/KCl buffer (0.6 M Sorbitol, 80 mM KCl, 20 mM Hepes pH 7.4), and treated with 5 mM NADPH and 1 mM GSSG. The redox states of Grx1-roGFP2 sensors were monitored as described above. At indicated time points buffer or Glr1 (1.25 U/ml final concentration; Sigma-Aldrich) was added. To lyse mitochondria, Triton X-100 was added to a final concentration of 3%, and the mix was incubated for 10 min on ice.
OxD and EGSH calculations
OxD calculations were performed as described in Meyer and Dick (2010) and Morgan et al (2011). In short, the emission intensities derived after excitation at 405 and 488 nm were used to calculate the OxD of the probe using the following equation:
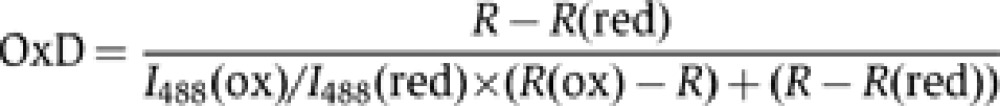 |
In=intensity at a given wavelength n; I488(ox), I488(red)=intensities at 488 nm upon complete oxidation by diamide or reduction by DTT, respectively; R=I405/I488; R(ox)=I405/I488 upon complete oxidation by diamide; R(red)=I405/I488 upon complete reduction by DTT.
Upon full equilibration of the sensor with the surrounding glutathione pool EGSH can be calculated from OxD as follows:
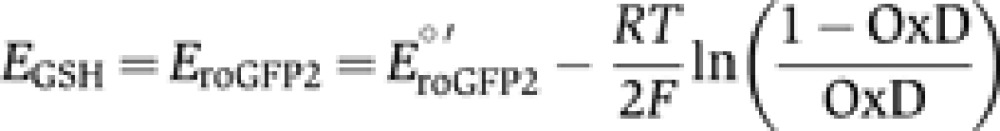 |
E°′roGFP2=−280 mV (Dooley et al, 2004). For accurate determination of EGSH, the temperature is controlled in all measurements.
Supplementary Material
Acknowledgments
We thank Caryn Outten (University of South Carolina) for the strains expressing different forms of Glr1. We thank Vera Nehr for technical assistance, Johannes Herrmann, Martin Ott and all members of the Riemer group for critical reading of the manuscript and the Deutsche Forschungsgemeinschaft as well as the Landesschwerpunkt Membrantransport for financial support. The work of JR on this project was supported by an EMBO Long Term Fellowship.
Author contributions: JR designed the study. JR and KK designed the experiments. KK, HG and MB performed the experiments. JR, KK and MB analysed the experiments with input from BM and TPD. JR wrote the manuscript with input from KK, BM and TPD.
Footnotes
The authors declare that they have no conflict of interest.
References
- Antos N, Budzinska M, Kmita H (2001) An interplay between the TOM complex and porin isoforms in the yeast Saccharomyces cerevisiae mitochondria. FEBS Lett 500: 12–16 [DOI] [PubMed] [Google Scholar]
- Appenzeller-Herzog C (2011) Glutathione- and non-glutathione-based oxidant control in the endoplasmic reticulum. J Cell Sci 124: 847–855 [DOI] [PubMed] [Google Scholar]
- Ballatori N, Krance SM, Marchan R, Hammond CL (2009) Plasma membrane glutathione transporters and their roles in cell physiology and pathophysiology. Mol Aspects Med 30: 13–28 [DOI] [PMC free article] [PubMed] [Google Scholar]
- Banhegyi G, Lusini L, Puskas F, Rossi R, Fulceri R, Braun L, Mile V, di Simplicio P, Mandl J, Benedetti A (1999) Preferential transport of glutathione versus glutathione disulfide in rat liver microsomal vesicles. J Biol Chem 274: 12213–12216 [DOI] [PubMed] [Google Scholar]
- Bien M, Longen S, Wagener N, Chwalla I, Herrmann JM, Riemer J (2010) Mitochondrial disulfide bond formation is driven by intersubunit electron transfer in Erv1 and proofread by glutathione. Mol Cell 37: 516–528 [DOI] [PubMed] [Google Scholar]
- Bihlmaier K, Mesecke N, Terziyska N, Bien M, Hell K, Herrmann JM (2007) The disulfide relay system of mitochondria is connected to the respiratory chain. J Cell Biol 179: 389–395 [DOI] [PMC free article] [PubMed] [Google Scholar]
- Braun NA, Morgan B, Dick TP, Schwappach B (2010) The yeast CLC protein counteracts vesicular acidification during iron starvation. J Cell Sci 123: 2342–2350 [DOI] [PMC free article] [PubMed] [Google Scholar]
- Chacinska A, Koehler CM, Milenkovic D, Lithgow T, Pfanner N (2009) Importing mitochondrial proteins: machineries and mechanisms. Cell 138: 628–644 [DOI] [PMC free article] [PubMed] [Google Scholar]
- Chacinska A, Pfannschmidt S, Wiedemann N, Kozjak V, Sanjuan Szklarz LK, Schulze-Specking A, Truscott KN, Guiard B, Meisinger C, Pfanner N (2004) Essential role of Mia40 in import and assembly of mitochondrial intermembrane space proteins. EMBO J 23: 3735–3746 [DOI] [PMC free article] [PubMed] [Google Scholar]
- Chen Z, Lash LH (1998) Evidence for mitochondrial uptake of glutathione by dicarboxylate and 2-oxoglutarate carriers. J Pharmacol Exp Ther 285: 608–618 [PubMed] [Google Scholar]
- Chen Z, Putt DA, Lash LH (2000) Enrichment and functional reconstitution of glutathione transport activity from rabbit kidney mitochondria: further evidence for the role of the dicarboxylate and 2-oxoglutarate carriers in mitochondrial glutathione transport. Arch Biochem Biophys 373: 193–202 [DOI] [PubMed] [Google Scholar]
- Colombini M (1989) Voltage gating in the mitochondrial channel, VDAC. J Membr Biol 111: 103–111 [DOI] [PubMed] [Google Scholar]
- Colombini M (2007) Measurement of VDAC permeability in intact mitochondria and in reconstituted systems. Methods Cell Biol 80: 241–260 [DOI] [PubMed] [Google Scholar]
- Cortese JD, Voglino AL, Hackenbrock CR (1991) Ionic strength of the intermembrane space of intact mitochondria as estimated with fluorescein-BSA delivered by low pH fusion. J Cell Biol 113: 1331–1340 [DOI] [PMC free article] [PubMed] [Google Scholar]
- Cummings BS, Angeles R, McCauley RB, Lash LH (2000) Role of voltage-dependent anion channels in glutathione transport into yeast mitochondria. Biochem Biophys Res Commun 276: 940–944 [DOI] [PubMed] [Google Scholar]
- Deponte M, Hell K (2009) Disulphide bond formation in the intermembrane space of mitochondria. J Biochem 146: 599–608 [DOI] [PubMed] [Google Scholar]
- Dooley CT, Dore TM, Hanson GT, Jackson WC, Remington SJ, Tsien RY (2004) Imaging dynamic redox changes in mammalian cells with green fluorescent protein indicators. J Biol Chem 279: 22284–22293 [DOI] [PubMed] [Google Scholar]
- Grabowska D, Chelstowska A (2003) The ALD6 gene product is indispensable for providing NADPH in yeast cells lacking glucose-6-phosphate dehydrogenase activity. J Biol Chem 278: 13984–13988 [DOI] [PubMed] [Google Scholar]
- Grant CM, MacIver FH, Dawes IW (1996) Glutathione is an essential metabolite required for resistance to oxidative stress in the yeast Saccharomyces cerevisiae. Curr Genet 29: 511–515 [DOI] [PubMed] [Google Scholar]
- Griffith OW, Meister A (1985) Origin and turnover of mitochondrial glutathione. Proc Natl Acad Sci USA 82: 4668–4672 [DOI] [PMC free article] [PubMed] [Google Scholar]
- Gruschke S, Grone K, Heublein M, Holz S, Israel L, Imhof A, Herrmann JM, Ott M (2010) Proteins at the polypeptide tunnel exit of the yeast mitochondrial ribosome. J Biol Chem 285: 19022–19028 [DOI] [PMC free article] [PubMed] [Google Scholar]
- Gutscher M, Pauleau AL, Marty L, Brach T, Wabnitz GH, Samstag Y, Meyer AJ, Dick TP (2008) Real-time imaging of the intracellular glutathione redox potential. Nat Methods 5: 553–559 [DOI] [PubMed] [Google Scholar]
- Hanson GT, Aggeler R, Oglesbee D, Cannon M, Capaldi RA, Tsien RY, Remington SJ (2004) Investigating mitochondrial redox potential with redox-sensitive green fluorescent protein indicators. J Biol Chem 279: 13044–13053 [DOI] [PubMed] [Google Scholar]
- Herrero E, Ros J, Tamarit J, Belli G (2006) Glutaredoxins in fungi. Photosynth Res 89: 127–140 [DOI] [PubMed] [Google Scholar]
- Herrmann JM, Riemer J (2010) The intermembrane space of mitochondria. Antioxid Redox Signal 13: 1341–1358 [DOI] [PubMed] [Google Scholar]
- Holmgren A, Johansson C, Berndt C, Lonn ME, Hudemann C, Lillig CH (2005) Thiol redox control via thioredoxin and glutaredoxin systems. Biochem Soc Trans 33: 1375–1377 [DOI] [PubMed] [Google Scholar]
- Hu J, Dong L, Outten CE (2008) The redox environment in the mitochondrial intermembrane space is maintained separately from the cytosol and matrix. J Biol Chem 283: 29126–29134 [DOI] [PMC free article] [PubMed] [Google Scholar]
- Hwang C, Sinskey AJ, Lodish HF (1992) Oxidized redox state of glutathione in the endoplasmic reticulum. Science 257: 1496–1502 [DOI] [PubMed] [Google Scholar]
- Jessop CE, Bulleid NJ (2004) Glutathione directly reduces an oxidoreductase in the endoplasmic reticulum of mammalian cells. J Biol Chem 279: 55341–55347 [DOI] [PubMed] [Google Scholar]
- Jo SH, Son MK, Koh HJ, Lee SM, Song IH, Kim YO, Lee YS, Jeong KS, Kim WB, Park JW, Song BJ, Huh TL (2001) Control of mitochondrial redox balance and cellular defense against oxidative damage by mitochondrial NADP+-dependent isocitrate dehydrogenase. J Biol Chem 276: 16168–16176 [DOI] [PubMed] [Google Scholar]
- Kloppel C, Suzuki Y, Kojer K, Petrungaro C, Longen S, Fiedler S, Keller S, Riemer J (2011) Mia40-dependent oxidation of cysteines in domain I of Ccs1 controls its distribution between mitochondria and the cytosol. Mol Biol Cell 22: 3749–3757 [DOI] [PMC free article] [PubMed] [Google Scholar]
- Kmita H, Antos N, Wojtkowska M, Hryniewiecka L (2004) Processes underlying the upregulation of Tom proteins in S. cerevisiae mitochondria depleted of the VDAC channel. J Bioenerg Biomembr 36: 187–193 [DOI] [PubMed] [Google Scholar]
- Kumar C, Igbaria A, D'Autreaux B, Planson AG, Junot C, Godat E, Bachhawat AK, Delaunay-Moisan A, Toledano MB (2011) Glutathione revisited: a vital function in iron metabolism and ancillary role in thiol-redox control. EMBO J 30: 2044–2056 [DOI] [PMC free article] [PubMed] [Google Scholar]
- Lee AC, Xu X, Blachly-Dyson E, Forte M, Colombini M (1998) The role of yeast VDAC genes on the permeability of the mitochondrial outer membrane. J Membr Biol 161: 173–181 [DOI] [PubMed] [Google Scholar]
- Lee JC, Straffon MJ, Jang TY, Higgins VJ, Grant CM, Dawes IW (2001) The essential and ancillary role of glutathione in Saccharomyces cerevisiae analysed using a grande gsh1 disruptant strain. FEMS Yeast Res 1: 57–65 [DOI] [PubMed] [Google Scholar]
- Lopez-Mirabal HR, Thorsen M, Kielland-Brandt MC, Toledano MB, Winther JR (2007) Cytoplasmic glutathione redox status determines survival upon exposure to the thiol-oxidant 4,4'-dipyridyl disulfide. FEMS Yeast Res 7: 391–403 [DOI] [PubMed] [Google Scholar]
- Mannella CA (1997) Minireview: on the structure and gating mechanism of the mitochondrial channel, VDAC. J Bioenerg Biomembr 29: 525–531 [DOI] [PubMed] [Google Scholar]
- McKernan TB, Woods EB, Lash LH (1991) Uptake of glutathione by renal cortical mitochondria. Arch Biochem Biophys 288: 653–663 [DOI] [PubMed] [Google Scholar]
- Merksamer PI, Trusina A, Papa FR (2008) Real-time redox measurements during endoplasmic reticulum stress reveal interlinked protein folding functions. Cell 135: 933–947 [DOI] [PMC free article] [PubMed] [Google Scholar]
- Mesecke N, Terziyska N, Kozany C, Baumann F, Neupert W, Hell K, Herrmann JM (2005) A disulfide relay system in the intermembrane space of mitochondria that mediates protein import. Cell 121: 1059–1069 [DOI] [PubMed] [Google Scholar]
- Meyer AJ, Brach T, Marty L, Kreye S, Rouhier N, Jacquot JP, Hell R (2007) Redox-sensitive GFP in Arabidopsis thaliana is a quantitative biosensor for the redox potential of the cellular glutathione redox buffer. Plant J 52: 973–986 [DOI] [PubMed] [Google Scholar]
- Meyer AJ, Dick TP (2010) Fluorescent protein-based redox probes. Antioxid Redox Signal 13: 621–650 [DOI] [PubMed] [Google Scholar]
- Miyagi H, Kawai S, Murata K (2009) Two sources of mitochondrial NADPH in the yeast Saccharomyces cerevisiae. J Biol Chem 284: 7553–7560 [DOI] [PMC free article] [PubMed] [Google Scholar]
- Morgan B, Sobotta MC, Dick TP (2011) Measuring E(GSH) and H(2)O(2) with roGFP2-based redox probes. Free Radic Biol Med 51: 1943–1951 [DOI] [PubMed] [Google Scholar]
- Naoe M, Ohwa Y, Ishikawa D, Ohshima C, Nishikawa S, Yamamoto H, Endo T (2004) Identification of Tim40 that mediates protein sorting to the mitochondrial intermembrane space. J Biol Chem 279: 47815–47821 [DOI] [PubMed] [Google Scholar]
- Ostergaard H, Henriksen A, Hansen FG, Winther JR (2001) Shedding light on disulfide bond formation: engineering a redox switch in green fluorescent protein. EMBO J 20: 5853–5862 [DOI] [PMC free article] [PubMed] [Google Scholar]
- Ostergaard H, Tachibana C, Winther JR (2004) Monitoring disulfide bond formation in the eukaryotic cytosol. J Cell Biol 166: 337–345 [DOI] [PMC free article] [PubMed] [Google Scholar]
- Outten CE, Culotta VC (2003) A novel NADH kinase is the mitochondrial source of NADPH in Saccharomyces cerevisiae. EMBO J 22: 2015–2024 [DOI] [PMC free article] [PubMed] [Google Scholar]
- Outten CE, Culotta VC (2004) Alternative start sites in the Saccharomyces cerevisiae GLR1 gene are responsible for mitochondrial and cytosolic isoforms of glutathione reductase. J Biol Chem 279: 7785–7791 [DOI] [PMC free article] [PubMed] [Google Scholar]
- Pai HV, Starke DW, Lesnefsky EJ, Hoppel CL, Mieyal JJ (2007) What is the functional significance of the unique location of glutaredoxin 1 (GRx1) in the intermembrane space of mitochondria? Antioxid Redox Signal 9: 2027–2033 [DOI] [PubMed] [Google Scholar]
- Pedrajas JR, Kosmidou E, Miranda-Vizuete A, Gustafsson JA, Wright AP, Spyrou G (1999) Identification and functional characterization of a novel mitochondrial thioredoxin system in Saccharomyces cerevisiae. J Biol Chem 274: 6366–6373 [DOI] [PubMed] [Google Scholar]
- Riemer J, Bulleid N, Herrmann JM (2009) Disulfide formation in the ER and mitochondria: two solutions to a common process. Science 324: 1284–1287 [DOI] [PubMed] [Google Scholar]
- Shoshan-Barmatz V, De Pinto V, Zweckstetter M, Raviv Z, Keinan N, Arbel N (2010) VDAC, a multi-functional mitochondrial protein regulating cell life and death. Mol Aspects Med 31: 227–285 [DOI] [PubMed] [Google Scholar]
- Summers WA, Court DA (2010) Origami in outer membrane mimetics: correlating the first detailed images of refolded VDAC with over 20 years of biochemical data. Biochem Cell Biol 88: 425–438 [DOI] [PubMed] [Google Scholar]
- Tienson HL, Dabir DV, Neal SE, Loo R, Hasson SA, Boontheung P, Kim SK, Loo JA, Koehler CM (2009) Reconstitution of the mia40-erv1 oxidative folding pathway for the small tim proteins. Mol Biol Cell 20: 3481–3490 [DOI] [PMC free article] [PubMed] [Google Scholar]
- Trotter EW, Grant CM (2005) Overlapping roles of the cytoplasmic and mitochondrial redox regulatory systems in the yeast Saccharomyces cerevisiae. Eukaryot Cell 4: 392–400 [DOI] [PMC free article] [PubMed] [Google Scholar]
- Waypa GB, Marks JD, Guzy R, Mungai PT, Schriewer J, Dokic D, Schumacker PT (2010) Hypoxia triggers subcellular compartmental redox signaling in vascular smooth muscle cells. Circ Res 106: 526–535 [DOI] [PMC free article] [PubMed] [Google Scholar]
- Zechmann B, Liou LC, Koffler BE, Horvat L, Tomasic A, Fulgosi H, Zhang Z (2011) Subcellular distribution of glutathione and its dynamic changes under oxidative stress in the yeast Saccharomyces cerevisiae. FEMS Yeast Res 11: 631–642 [DOI] [PMC free article] [PubMed] [Google Scholar]
- Zeth K (2010) Structure and evolution of mitochondrial outer membrane proteins of beta-barrel topology. Biochim Biophys Acta 1797: 1292–1299 [DOI] [PubMed] [Google Scholar]
Associated Data
This section collects any data citations, data availability statements, or supplementary materials included in this article.