

Abstract
Objectives
To compare oral health status by ethnicity and socioeconomic status among African American (AA), American Indian (AI), and white dentate and edentulous community-dwelling older adults.
Design
Cross-sectional study; data from self-reports and oral examinations.
Participants
A multi-stage cluster sampling design was used to recruit 635 participants aged 60+ from rural North Carolina counties with substantial AA and AI populations.
Measurements
Participants completed in-home interviews and oral examinations. Self-reported data included socio-demographic indicators, self-rated oral health status, and presence/absence of periodontal disease, bleeding gums, oral pain, dry mouth, and fit of prostheses. Oral examination data included number of teeth and numbers of anterior and posterior functional occlusal units.
Results
Compared to whites, AAs and AIs had significantly lower incomes and educational attainment. Self-rated oral health was significantly higher in whites, compared to both AAs and AIs. Prevalence of self-reported periodontal disease and bleeding gums was lower in whites. Among dentate participants, AAs were significantly more likely than whites to have moderately reduced numbers of teeth (11–20 teeth) and posterior occlusal contacts. Oral health deficits remained associated with ethnicity when adjusted for socioeconomic variables.
Conclusions
Oral health disparities in older adults in a multi-ethnic rural area are largely associated with ethnicity and not socioeconomic status. Clinicians should be aware of these health disparities in oral health status and their possible role in disparities in chronic disease. Further research is necessary to understand whether these oral health disparities reflect current or lifetime access to care, diet, or attitudes toward oral health care.
Introduction
Oral health is central to both physical and psychosocial well-being. Deficits in oral health are associated with a variety of systemic chronic diseases and their risk factors. Periodontal disease has been associated with ischemic stroke and fatal coronary heart disease (1–3). Tooth loss has been associated with low functional status, subclinical cardiovascular disease, cognitive decline, ischemic stroke, coronary heart disease, diabetes, and mortality (1,2–10).
The effects of oral health on chronic disease risk most likely occur through multiple pathways, including altered nutritional status. Oral health deficits influence nutritional status through constraining dietary choices. Older adults make dietary accommodations to tooth loss and other deficits without realizing the declining quality of the diet (11). Over time, the loss of teeth leads to avoidance of hard-to-chew items such as meat and fresh fruits and vegetables (12). This results in measurable declines in diet quality (13).
Oral health deficits can also impair social interaction and integration due to pain, communication disorders, and embarrassment (14–16). Despite dramatic advances in preventive dentistry, oral health disparities persist.
Ethnic disparities in oral health among older adults are striking. African Americans have higher rates of edentulism than whites, as well as higher prevalence of periodontal disease and untreated dental decay (17). Few data exist for American Indian older adults; their small numbers in national surveys prevent comparisons with other ethnic groups. However, data from compilations of clinical data (18) and from combined regional surveys (19) have found edentulism, decay, periodontal disease, and other conditions to be common. These suggest that oral health disparities are significant for American Indians.
Older adults in rural communities are at particularly high risk for oral health disparities due to factors such as limited access to oral health care and, for many, to lack of fluoridated water throughout their lifetimes. Rural participants 65 years and older in the National Health Interview Survey (NHIS) had higher rates of edentulism than urban residents, regardless of poverty status (20). These data were consistent with NHIS findings that rural residents of all ages combined were less likely than urban residents to have private dental insurance, were less likely to have had a dental visit in the past year, and were more likely to report poor dental health (21,22). The high proportion of ethnic minorities in some rural regions makes disparities in oral health within rural populations likely.
Although a significant amount of literature has documented racial and ethnic disparities in oral health, notably lacking in the literature has been an analysis that includes American Indians and that includes both minority and white residents from the same geographic region. Such a comparison is useful because it can reduce the confounding of ethnic health disparities by environmental factors. This paper addresses this gap by presenting data from a population-based survey of oral health among persons 60 and older from a rural population with significant numbers of African American and American Indian residents. This study provides an opportunity to compare these two minority groups with whites from the same communities. The objectives of the paper are to (1) describe the oral health status of these elders and (2) compare oral health status by ethnicity and socioeconomic status indicators in this tri-ethnic geographic region.
Methods
Sample and Recruitment
The Rural Nutrition and Oral Health (RUN-OH) Study was conducted in two rural counties. Inclusion criteria were: ≥ 60 years; community-dwelling; cognitively and physically able to complete a survey interview; and self-ascribed ethnicity of African American, American Indian, or white. Participants were located using a random dwelling selection and screening procedure based on a multistage cluster sampling design in which the primary sampling units (clusters) were stratified and selected with probability proportionate to their sizes. This procedure was designed and implemented by the investigators in consultation with the University of Illinois Survey Research Laboratory.
First, clusters were selected in each county. The 2000 SF1 census data for the two counties were sorted according to GISID, a variable on the census file indicating geographic location. Once sorted by this variable, blocks were ordered by geographic proximity. After sorting, contiguous records were summed until a minimum of 75 dwelling units was reached. In addition to summing the dwelling units across all blocks in the cluster, the total population by race/ethnicity was summed for each group to obtain the necessary data for stratifying the cluster. Clusters were stratified into 4 categories, based on the racial/ethnic composition of their residents as predominantly (more than 50%) African American, American Indian or white, or mixed (no ethnic group comprising 50% of the residents). We randomly selected 20 clusters from each of the four types with probabilities proportionate to size, where size was measured by the number of dwelling units, for a total of 80 clusters. This process ensured that the proportion of dwellings randomly selected for the sample was roughly one-third each African American, American Indian and white.
Second, maps of the selected clusters were created with GIS software. Project staff visited each cluster and visually verified the dwelling units on the maps, adding any missing units to the file for each sampled cluster. Third, a random sample of 70 dwelling units was selected for each cluster once all the dwelling units were listed (all dwellings were selected in clusters with 70 or fewer dwellings). To maximize coverage of survey eligible dwelling units, a standard half-open interval procedure was used to allow dwelling units missed during the original listing process to enter the sample. The field interviewer checked the geographic listing interval between each sampled dwelling unit and the next listed unit for presence of any unlisted dwellings. Any dwelling units found were added to the sample.
Fourth, dwelling units in each cluster were screened in random order. Interviewers contacted each of the dwellings selected. If no one was at home at the initial visit, the interviewer made at least three additional attempts to contact the dwelling residents, each at different times of the day (morning, afternoon, evening), and on at least one weekend day. Once interviewers made contact with a dwelling resident, the interviewer screened the household for residents who met the inclusion criteria. If more than one resident who met the inclusion criteria lived in a dwelling, one resident was selected using a random respondent selection key to ensure men and women had an equal chance of being interviewed. This also avoided interviewer discretion in designation of a sample member. Replacements were not made for non-cooperating sample persons. Interviewers were trained to detect confusion or inconsistent answers indicative of dementia. If dementia was suspected, the interviewer administered the Mini Mental State Examination (MMSE) (24). Persons scoring 17 or less (with eight or fewer years of education) or 23 or less (with nine or more years of education) were excluded from the study (25).
Within the 80 mapped clusters, 5,545 dwellings units were identified (Figure 1). Thirty-nine of these dwelling units were not screened, 4,647 were screened but did not include an eligible participant, and 859 included an eligible participant. The screening rate was 99.3%. Among the dwelling units that did not include an eligible participant, 4,082 had no resident aged 60 years or older, 444 were vacant, 104 were not actually dwelling units, 6 included no resident who spoke English, in 9 the potential participant failed the MMSE, indicating that they were not able to give informed consent, and in 2 the potential participant was physically unable to complete the interview.
Figure 1.
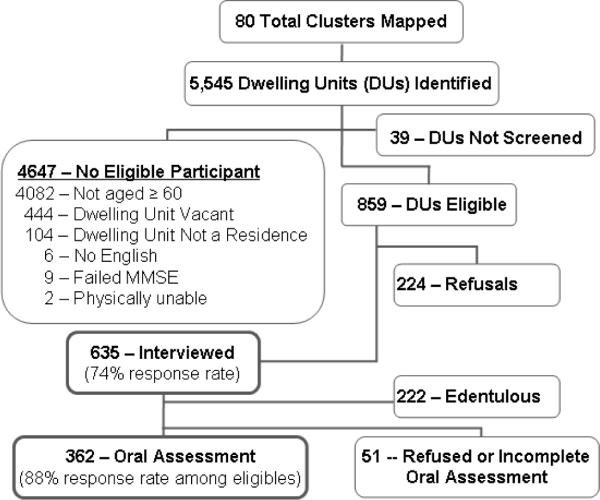
Flow Diagram of Sampling and Recruitment.
Finally, interviewers attempted to recruit participants who met the inclusion criteria in each randomly selected dwelling in a cluster, regardless of participant ethnicity and the predominant ethnic group of the cluster. Once an eligible resident was identified, the interviewer asked to speak with that individual. If the individual was not at home, the interviewer made an appointment to return. The interviewer made at least three additional attempts to contact the selected individuals at times at which other residents indicated the individual would normally be at home. All randomly selected dwellings were maintained in the sample until their dispositions were finalized.
The eligible resident in 635 of the 859 eligible dwelling units completed the interview, and 224 refused to complete the interview, for a response rate of 74%. The University of Illinois Survey Research Laboratory provided weights for each participant based on size of the cluster from which he/she was selected, and his/her probability of selection within each dwelling unit.
Data Collection and Quality Control
Data were collected by experienced interviewers in face-to-face home interviews lasting 1.5 to 2.5 hours. Questions were read to participants and cue cards with response categories were used when appropriate. All interviewers completed one day of didactic training, and each recorded practice interviews that were reviewed and approved. Ten percent of each interviewer's interviews were verified by telephone. Persons with at least one natural tooth were asked to undergo an in-home oral examination. Among 413 dentate participants, 362 completed the oral examination, for a participation rate of 88%. Oral examinations were conducted by licensed dental hygienists who performed tooth counts and assessed functional occlusal contacts. Two hygienists conducted all study examinations. They underwent an initial one day training and one day calibration with a research dentist using volunteers who were representative of the study population. Calibration was repeated annually. The research dentist conducted five replicate examinations with each hygienist and performed an ongoing review of data collection forms to check for correct logic, legal values, and data ranges.
Measures
Ethnicity was self-defined by participants and categorized as white, American Indian or African American. Education was reported as highest grade completed and is categorized as grade 6 or less, grades 7 or 8, grade 9 to less than high school graduate, high school graduate, and more than high school. Income is dichotomized as (0) above and (1) below the poverty line, using current federal poverty guidelines appropriate for the respondent's household size.
Self-rated oral health was obtained by asking participants to rate the condition of their mouth and teeth, including dentures, as excellent, very good, good, fair or poor. Participants reported mouth pain, dentures or partials that did not fit, gum soreness or bleeding, dry mouth, bad breath, and periodontal disease. All were coded as present (1) or absent (0). Periodontal disease was coded as present if participants reported ever having been told by a dentist that they had periodontal or gum disease OR reported ever having had a loose tooth as an adult (not including trauma). Removable prostheses were coded as present (if the participant reported having at least one partial or full upper or lower plate) or absent.
Number of teeth was a categorical variable with values 0 teeth, 1–10 teeth, 11–20 teeth, and 21 or more teeth. For dentate participants, tooth counts were obtained from the oral examination. If the participant refused the oral examination (n=51), self-reported number of teeth obtained at the survey was used. The correlation of self-report and examination in those who had both was 0.92 (p<0.0001).
Functional units were counted if a functional contact existed between two natural teeth, a natural tooth and a fixed prosthesis, or two fixed prostheses. Functional anterior units were ordered categories 0 functional units, 1–3 functional units, and 4–6 functional units. Functional posterior units were ordered categories 0 functional units, 1–2 functional units, 3–5 functional units, and 6–10 functional units. Data on functional contacts are only available for those 362 who participated in the oral examination.
Data Analysis
All data analyses took into account the complex survey design of our study. The association between two categorical variables was examined using Wald log-linear Chi-square tests. Logistic regression models were used for binary outcomes to obtain odds ratio estimates. For ordinal variables, we first assessed the assumption of proportional odds ratios using Score tests. This assumption appeared reasonable for outcomes such as self-rated oral health and functional anterior occlusal units, and therefore, proportional odds models were employed. When the proportional odds assumption failed, nominal logistic regression models were used instead to allow the association between predictors and outcome to differ across outcome levels. All analyses were performed using SAS 9.1 (Cary, NC) and a p-value of <0.05 was considered statistically significant.
Results
Mean (± SE) age of the sample was 72.2 ± 0.7 years for whites, 72.2 ± 0.8 for African Americans, and 70.1 ± 0.6 for American Indians. About 2 in 5 minority participants, and 1 in 4 whites, were below the poverty level (Table 1). Educational attainment had significant ethnic differences. Only 26% of American Indians had at least a high school diploma, compared to 43% for African Americans and 56% of whites. Dental insurance coverage was low, varying from 12% of African Americans to 7% for American Indians.
Table 1.
Personal Characteristics, by Ethnicity, n=635.1
| White | African American | American Indian | p-value | ||||
|---|---|---|---|---|---|---|---|
|
|
|||||||
| Characteristic | Mean | SE | Mean | SE | Mean | SE | |
|
| |||||||
| Age | 72.2 | 07 | 72.2 | 08 | 70.1 | 06 | 0.0665 |
|
| |||||||
| Sex | N | % | N | % | N | % | 0.0016 |
| Female | 139 | 45.7 | 83 | 61.1 | 122 | 62.5 | |
| Male | 165 | 54.3 | 53 | 38.9 | 73 | 37.5 | |
| Poverty | 0.0017 | ||||||
| Above poverty line | 234 | 77.0 | 82 | 60.7 | 115 | 58.7 | |
| Below poverty line | 70 | 23.0 | 53 | 39.3 | 81 | 41.3 | |
| Education | 0.0002 | ||||||
| ≤ Grade 6 | 30 | 9.9 | 17 | 12.3 | 62 | 31.9 | |
| Grade 7 and 8 | 43 | 14.0 | 21 | 15.7 | 37 | 18.9 | |
| > Grade 8 and < HS | 60 | 19.7 | 39 | 28.8 | 45 | 23.0 | |
| HS graduate | 90 | 29.7 | 35 | 25.5 | 31 | 15.8 | |
| > HS | 81 | 26.7 | 24 | 17.7 | 20 | 10.4 | |
| Dental insurance | 0.3901 | ||||||
| Yes | 34 | 11.2 | 16 | 11.7 | 14 | 7.4 | |
| No | 270 | 88.8 | 120 | 88.3 | 180 | 92.6 | |
N=weighted n
Whites reported significantly better self-rated oral health (Table 2), with 64% reporting the condition of teeth, mouth, and gums to be good, very good, or excellent, compared to 47% and 46% of African American and American Indian elders, respectively. Minority elders reported a significantly higher prevalence of periodontal disease and bleeding gums. There were no ethnic differences in oral pain, dry mouth, or bad breath.
Table 2.
Bivariate Comparisons of Oral Health Status, by Ethnicity.
| White | African American | American Indian | p-value | ||||
|---|---|---|---|---|---|---|---|
|
| |||||||
| Characteristics | N1 | % | N | % | N | % | |
| Self-rated oral health2 | 0.0005 | ||||||
| Excellent | 44 | 14.4 | 12 | 9.2 | 7 | 3.5 | |
| Very good | 58 | 19.0 | 11 | 8.6 | 18 | 9.3 | |
| Good | 94 | 31.0 | 39 | 29.1 | 64 | 32.9 | |
| Fair | 62 | 20.5 | 43 | 31.8 | 65 | 33.7 | |
| Poor | 46 | 15.1 | 29 | 21.3 | 40 | 20.6 | |
| Periodontal disease2 | 0.0002 | ||||||
| Yes | 123 | 40.5 | 87 | 63.8 | 101 | 51.8 | |
| No | 181 | 59.5 | 49 | 36.2 | 94 | 48.2 | |
| Bleeding gums2 | 0.0002 | ||||||
| Yes | 39 | 13.1 | 36 | 26.6 | 60 | 30.8 | |
| No | 261 | 86.9 | 100 | 73.4 | 135 | 69.2 | |
| Oral pain2 | 0.2624 | ||||||
| Yes | 24 | 8.1 | 18 | 13.3 | 27 | 13.8 | |
| No | 279 | 91.9 | 118 | 86.7 | 168 | 86.2 | |
| Dry mouth2 | 0.8028 | ||||||
| Yes | 147 | 48.4 | 62 | 45.9 | 99 | 50.9 | |
| No | 157 | 51.6 | 73 | 54.1 | 96 | 49.1 | |
| Bad breath2 | 0.4111 | ||||||
| Yes | 51 | 16.7 | 35 | 25.8 | 41 | 21.0 | |
| No | 251 | 83.3 | 100 | 74.2 | 153 | 79.0 | |
| Number of teeth2 | 0.0131 | ||||||
| 0 | 110 | 36.2 | 43 | 31.7 | 68 | 35.1 | |
| 1–10 | 52 | 17.0 | 21 | 15.2 | 33 | 16.7 | |
| 11–20 | 46 | 15.2 | 41 | 30.1 | 43 | 22.2 | |
| 21+ | 96 | 31.5 | 31 | 22.9 | 51 | 26.0 | |
| Removable prosthesis2 | 0.9297 | ||||||
| Yes | 180 | 59.2 | 82 | 60.2 | 119 | 61.0 | |
| No | 124 | 40.8 | 54 | 39.8 | 76 | 39.0 | |
| Dentures ill fitting2 | 0.6151 | ||||||
| Yes | 59 | 19.6 | 32 | 23.7 | 44 | 22.7 | |
| No | 242 | 80.4 | 104 | 76.3 | 150 | 77.3 | |
| Functional occlusal units, anterior3 | 0.7522 | ||||||
| 0 | 37 | 24.8 | 25 | 30.5 | 34 | 30.0 | |
| 1–3 | 22 | 14.7 | 16 | 19.2 | 18 | 15.9 | |
| 4–6 | 90 | 60.5 | 42 | 50.3 | 61 | 54.1 | |
| Functional occlusal units, posterior3 | 0.0019 | ||||||
| 0 | 45 | 30.3 | 23 | 27.0 | 37 | 33.3 | |
| 1–2 | 10 | 7.0 | 21 | 24.9 | 19 | 17.1 | |
| 3–5 | 30 | 20.3 | 22 | 25.9 | 31 | 27.2 | |
| 6–10 | 63 | 42.5 | 19 | 22.2 | 25 | 22.4 | |
N=weighted n
Self-report
Data collected only from participants in oral assessment (n=362)
Thirty-five percent of the sample was edentulous, including 36% of whites, 32% of African Americans, and 35% on American Indians. Among dentate participants, there were significant ethnic differences in number of teeth. Whites had more individuals in the highest category (21 or more teeth) (Table 2). There were no ethnic differences related to removable prostheses.
Among persons with at least one tooth, ethnic groups did not differ in anterior functional occlusal contacts, with 50–60% having 4 to 6 contacts. In contrast, there were significant differences for posterior contacts. Almost twice as many whites had 6 to 10 contacts (43%) as did African Americans (22%) and American Indians (22%).
Table 3 presents the unadjusted odds ratios (OR) and corresponding 95% confidence interval (95% CI) for each measure of oral health predicted by ethnicity. The table also presents the OR and CI adjusted by demographic and socioeconomic variables. The ethnic differences in oral health status measures observed in the bivariate analyses were sustained in the unadjusted regression analyses. For number of teeth, the significant ethnic differences were found in those with 11–20 teeth, compared with 21+ teeth. Similarly, the ethnic differences in posterior functional occlusal contacts were between those with 1–2 and 3–5 contacts and those with 6 or more, and not with those having 0 contacts.
Table 3.
Oral Health Status by Ethnicity, Unadjusted and Adjusted for Demographic and Socioeconomic Characteristics.
| Ethnicity | Sex | Age | Education | Income | Dental Ins. | ||||||
|---|---|---|---|---|---|---|---|---|---|---|---|
|
|
|||||||||||
| AA vs. W | AI vs. W | AI vs. AA | Male | Grade 7–8 vs Grade <7 | <HS vs Grade <7 | HS vs Grade<7 | >HS vs Grade<7 | Below Poverty Line | No | ||
|
|
|||||||||||
| OR (95%CI) | OR (95%CI) | OR (95%CI) | OR (95%CI) | OR (95%CI) | OR (95%CI) | OR (95%CI) | OR (95%CI) | OR (95%CI) | OR (95%CI) | OR (95%CI) | |
| Self-rated oral health | |||||||||||
| Unadjusted | 0.5 (0.3, 0.8)* | 0.4 (0.3, 0.7)* | 0.9 (0.6, 1.4) | ||||||||
| Adjusted | 0.5 (0.3, 0.9)* | 0.6 (0.4, 0.9)* | 1.1 (0.7, 1.6) | 0.9 (0.6, 1.3) | 1.2 (1.1, 1.4)* | 1.4 (0.7, 2.8) | 1.1 (0.6, 1.9) | 1.6 (0.8, 3.3) | 1.6 (0.7, 3.4) | 0.8 (0.5, 1.3) | 0.5 (0.3, 0.8)* |
| Periodontal Disease | |||||||||||
| Unadjusted | 2.6 (1.6, 4.2)* | 1.6 (1.0, 2.4)* | 0.6 (0.4, 1.0)* | ||||||||
| Adjusted | 2.5 (1.6, 4.0)* | 1.2 (0.8, 1.9) | 0.5 (0.3, 0.7)* | 0.9 (0.6, 1.4) | 0.9 (0.8, 1.1) | 0.8 (0.4, 1.6) | 0.9 (0.5, 1.6) | 0.3 (0.1, 0.5)* | 0.4 (0.2, 0.7)* | 0.7 (0.4, 1.0) | 1.3 (0.7, 2.2) |
| Bleeding Gums | |||||||||||
| Unadjusted | 2.4 (1.3, 4.5)* | 3.0 (1.5, 5.9)* | 1.2 (0.7, 2.0) | ||||||||
| Adjusted | 2.2 (1.3, 4.0)* | 2.0 (1.0, 4.0)* | 0.9 (0.5, 1.6) | 0.8 (0.4, 1.4) | 0.9(0.8, 1.0) | 0.8 (0.4, 1.7) | 0.3 (0.2, 0.6)* | 0.5 (0.2, 0.6)* | 0.2 (0.1, 0.5)* | 1.1 (0.7, 1.9) | 1.0 (0.4, 2.3) |
| N of teeth (0) | |||||||||||
| Unadjusted | 1.2 (0.7, 2.2) | 1.2 (0.7, 2.0) | 1.0 (0.5, 1.8) | ||||||||
| Adjusted | 0.9 (0.5, 1.8) | 0.7 (0.4, 1.2) | 0.7 (0.4, 1.5) | 2.0 (0.8, 4.8) | 1.1 (0.9, 1.3) | 0.4 (0.1, 0.9)* | 0.3 (0.1, 0.9)* | 0.2 (0.1, 0.8)* | 0.1, (0.0, 3.0)* | 2.5 (1.2, 5.6)* | 2.6 (0.6, 11.2) |
| N of teeth (1–10) | |||||||||||
| Unadjusted | 1.2 (0.6, 2.5) | 1.2 (0.6, 2.5) | 1.0 (0.5, 2.0) | ||||||||
| Adjusted | 1.1 (0.5, 2.5) | 0.9 (0.4, 1.9) | 0.8 (0.4, 1.6) | 1.7 (0.9, 3.4) | 1.0 (0.8, 1.2) | 0.3 (0.1, 1.0) | 0.4 (0.1, 1.5) | 0.4 (0.1, 1.2) | 0.2 (0.1, 0.8)* | 2.2 (0.8, 6.0) | 1.3 (0.5, 3.5) |
| N of teeth (11–20) | |||||||||||
| Unadjusted | 2.7 (1.6, 4.6)* | 1.8 (1.1, 2.9)* | 0.7 (0.4, 1.2) | ||||||||
| Adjusted | 2.5 (1.5, 4.3)* | 1.4 (0.9, 2.2) | 0.6 (0.3, 1.1) | 1.2 (0.5, 2.8) | 0.9 (0.7, 1.1) | 0.7 (0.3, 1.7) | 0.6 (0.2, 1.7) | 0.6 (0.2, 1.8) | 0.5 (0.2, 1.5) | 1.5 (0.6, 3.3) | 1.1 (0.4, 2.8) |
| Post. Contact (0) | |||||||||||
| Unadjusted | 1.7 (0.7, 4.2) | 2.1 (0.9, 4.7) | 1.2 (0.5, 3.3) | ||||||||
| Adjusted | 1.6 (0.6, 4.0) | 1.7 (0.7, 3.8) | 1.1 (0.4, 2.9) | 2.0 (1.0, 4.2) | 1.1(0.8, 1.3) | 0.6 (0.1, 2.8) | 0.7 (0.2, 3.2) | 0.5 (1.1, 1.8) | 0.5 (0.1, 1.8) | 2.5 (0.7, 8.8) | 1.1 (0.4, 3.3) |
| Post. Contact (1–2) | |||||||||||
| Unadjusted | 6.9 (2.6, 18.3)* | 4.7 (1.8, 12.0)* | 0.7 (0.2, 1.9) | ||||||||
| Adjusted | 6.4 (2.3, 18.1)* | 4.0 (1.3, 12.8)* | 0.6 (0.2, 2.0) | 0.9 (0.3, 2.2) | 1.1 (0.8, 1.6) | 0.9 (0.2, 3.8) | 0.7 (0.2, 2.7) | 0.7 (0.2, 3.1) | 0.6 (0.2, 2.8) | 1.8 (0.6, 5.9) | 1.0 (0.3, 3.2) |
| Post. Contact (3–5) | |||||||||||
| Unadjusted | 2.4 (0.9, 6.6) | 2.6 (1.1, 5.7)* | 1.0 (0.4, 2.6) | ||||||||
| Adjusted | 2.4 (0.9, 6.5) | 2.6 (1.1, 6.1)* | 1.1 (0.4, 2.9) | 1.2 (0.5, 2.6) | 1.1 (0.8, 1.6) | 1.2 (0.2, 6.6) | 2.5(0.5, 13.7) | 1.2 (0.2, 6.9) | 1.0 (0.2, 5.6) | 1.0 (0.3, 3.5) | 1.0 (0.3, 3.4) |
P<.05
In the adjusted regression analysis, self-rated oral health remained associated with ethnicity, with both African American and American Indians significantly lower than whites. Age and having dental insurance were also associated with higher levels of self-rated oral health. Periodontal disease differed only between African Americans and whites, once adjusted for other variables. Ethnic differences in bleeding gums were unchanged by adjusting for the variables; low educational attainment was also significantly associated with bleeding gums. The edentulous category (0 teeth) was related to low education and to income below the poverty level. For the third category, 11–20 teeth, ethnicity remained related to number of teeth, but only for African Americans once adjusted for other variables. African Americans had 2.5 times the likelihood of having only 11–20 teeth, compared to whites. For posterior functional occlusal contacts, ethnicity remained the only predictor even when adjusted for other variables. African Americans had 6.4 times the odds of having only 1–2 posterior contacts, compared to whites. American Indians had 4 times the odds of having 1–2 posterior contacts and 2.6 times the odds of having 3–5 contacts, compared to whites.
Discussion
Disparities in oral health status have been documented nationally. Members of ethnic minorities have been shown consistently to have poorer oral health, whether measured objectively through oral examinations or subjectively as self-rated oral health (17). The present analysis focused on ethnic disparities, but in a population derived from a single region where residents have, theoretically, access to much the same health care resources. Ethnic disparities are apparent in this population for specific conditions—periodontal disease, bleeding gums, number of teeth, and functional occlusal contacts—as well as subjectively rated oral health. In all comparisons, whites as a group had better oral health than the African American and American Indian respondents.
Self-rated oral health provides a global measure of the respondent's perceived oral health status. Almost two-thirds (64%) of whites rated their oral health as excellent, very good, or good, compared to fewer than half of African Americans (47%) and American Indians (46%). Disparities in self-reported periodontal disease and bleeding gums paralleled those in self-rated oral health and may provide explanation for the lower minority ratings of oral health. This disparity in self-rated oral health is striking, though not as large as that between whites and African Americans 65 years and older in the 1999–2004 National Health and Nutrition Examination Survey (NHANES) (65.3% vs. 38.8%) (17).
The percentage of edentulous participants in this sample exceeded the comparable percentage for persons 65 years and older (35% vs. 27%) in the 1999–2004 NHANES (17). This difference is largely due to the higher proportion of whites (36% vs. 26%) who are edentulous. Although more African Americans than whites were edentulous in the NHANES, the opposite was true in this study. This may reflect the overall poor oral health status of this rural population and possibly greater access to dental care or financial resources among whites to have teeth extracted and obtain dentures (23). Whites also had the greatest proportion with 21 or more teeth, while African Americans and, to a lesser extent American Indians, had larger percentages of persons with 11–20 teeth, compared with whites. Having no teeth or 1–10 teeth were associated with socioeconomic factors (lower education and income below the poverty line) in this sample, while having 11–20 teeth was associated with ethnicity. This, too, suggests greater access to care among whites to preserve or restore dentition.
Fewer numbers of functional posterior occlusal contacts have been associated with less effective mastication and problems of swallowing and choking (26). Over time, such problems lead to avoidance of brittle and tough foods such as nuts and meat (27). In this study, African Americans who were dentate were over six times more likely to have only one or two contacts, compared to whites who were dentate. American Indians were also more likely to have one or two contacts, as well as three to five contacts, compared to six to ten.
This study was able to assess only a small portion of factors that might be related to these measures of oral health status. Adjusting for commonly-assessed measures of socioeconomic status (education, dental insurance, and poverty status) did not eliminate the effect of ethnicity on oral health status.
This study provides data on oral health status among older American Indians. Too few American Indians are included in national samples to be able to quantify their oral health disparities; few published studies include this group. The analyses presented here demonstrate oral health disparities largely consistent with those of African Americans, except for periodontal disease. When adjusted for socioeconomic factors, American Indians had less periodontal disease than African Americans and were not different from whites.
These results should be interpreted in light of specific limitations. The research used a cross-sectional survey design; it was not possible to document causal relationships. The results were subject to the recall bias of the participants. No data were available on lifetime access to care. The research was conducted in two rural southern counties; this may limit generalization of results to adults in other regions. However, the research included a large, random, ethnically diverse sample. The survey was complemented by an oral examination, which provided results consistent with self-reported oral health status.
These results indicate that a substantial proportion of older rural adults have oral health deficits. This includes white older adults, but African American and American Indian elders had significantly greater deficits. Although some deficits are linked to differences in socioeconomic status, most are not. Further research is needed to examine whether these disparities reflect lifetime or current differences in access to care, in diet, or in attitudes toward oral health.
A variety of oral health deficits assessed in this study, including periodontal disease and tooth loss, have been linked to chronic diseases and their risk factors (1–10). Clinicians treating older adults should be aware of their patients' oral health status and promote dental treatment as a means of addressing a range of health conditions. The impact of ethnic oral health disparities on overall health, particularly on chronic disease and nutritional status, deserves further examination.
Acknowledgments
The authors thank John R. Elter, DMD, PhD, for training and supervising staff for the dental examinations. They also thank Emily Cottle, RDH, and Kristy Bryant, RDH, for conducting the oral assessments.
Financial Disclosure: This study was funded by the National Institute for Dental and Craniofacial Research, grant R01 DE017092.
This research was funded by the National Institute for Dental and Craniofacial Research, grant R01 DE017092. This paper was presented at the annual meeting of the Gerontological Society of America, National Harbor, Maryland, November 23, 2008.
Footnotes
Author Contributions: Sara Quandt: study design, acquisition of subjects, data interpretation and manuscript preparation. Haiying Chen: study design, data analysis and interpretation and manuscript preparation. Ronny Bell: study design and data interpretation. Andrea Anderson: data analysis. Margaret Savoca: study design and data interpretation. Teresa Kohrman: acquisition of subjects and manuscript preparation. Gregg Gilbert: data interpretation and manuscript preparation. Thomas Arcury: study design, data interpretation, and manuscript preparation.
References Cited
- 1.Joshipura KJ, Hung HC, Rimm EB, et al. Periodontal disease, tooth loss, and incidence of ischemic stroke. Stroke. 2003;34:47–52. doi: 10.1161/01.str.0000052974.79428.0c. [DOI] [PubMed] [Google Scholar]
- 2.Morrison HI, Ellison LF, Taylor GW. Periodontal disease and risk of fatal coronary heart and cerebrovascular diseases. J Cardiovasc Risk. 1999;6(1):7–11. doi: 10.1177/204748739900600102. [DOI] [PubMed] [Google Scholar]
- 3.Wu T, Trevisan M, Genco RJ, et al. Periodontal disease and risk of cerebrovascular disease: the first national health and nutrition examination survey and its follow-up study. Arch Intern Med. 2000;160(18):2749–55. doi: 10.1001/archinte.160.18.2749. [DOI] [PubMed] [Google Scholar]
- 4.Hung HC, Joshipura KJ, Colditz G, et al. The association between tooth loss and coronary heart disease in men and women. J Public Health Dent. 2004;64(4):209–15. doi: 10.1111/j.1752-7325.2004.tb02755.x. [DOI] [PubMed] [Google Scholar]
- 5.Cabrera C, Hakeberg M, Ahlqwist M, et al. Can the relation between tooth loss and chronic disease be explained by socio-economic status? A 24-year follow-up from the population study of women in Gothenburg, Sweden. Eur J Epidemiol. 2005;20(3):229–36. doi: 10.1007/s10654-004-5961-5. [DOI] [PubMed] [Google Scholar]
- 6.Morita I, Nakagaki H, Kato K, et al. Relationship between survival rates and numbers of natural teeth in an elderly Japanese population. Gerodontology. 2006;23(4):214–8. doi: 10.1111/j.1741-2358.2006.00134.x. [DOI] [PubMed] [Google Scholar]
- 7.Avlund K, Holm-Pedersen P, Morse DE, et al. Tooth loss and caries prevalence in very old Swedish people: the relationship to cognitive function and functional ability. Gerodontology. 2004;21(1):17–26. doi: 10.1046/j.1741-2358.2003.00003.x. [DOI] [PubMed] [Google Scholar]
- 8.Avlund K, Holm-Pedersen P, Schroll M. Functional ability and oral health among older people: a longitudinal study from age 75 to 80. J Am Geriatr Soc. 2001;49(7):954–62. doi: 10.1046/j.1532-5415.2001.49187.x. [DOI] [PubMed] [Google Scholar]
- 9.Demmer RT, Jacobs DR, Jr, Desvarieux M. Periodontal disease and incident type 2 diabetes: results from the First National Health and Nutrition Examination Survey and its epidemiologic follow-up study. Diabetes Care. 2008;31(7):1373–9. doi: 10.2337/dc08-0026. [DOI] [PMC free article] [PubMed] [Google Scholar]
- 10.Desvarieux M, Demmer RT, Rundek T, et al. Relationship between periodontal disease, tooth loss, and carotid artery plaque: the Oral Infections and Vascular Disease Epidemiology Study (INVEST) Stroke. 2003;34(9):2120–5. doi: 10.1161/01.STR.0000085086.50957.22. [DOI] [PMC free article] [PubMed] [Google Scholar]
- 11.Daly RM, Elsner RJF, Allen PF, et al. Associations between self-reported dental status and diet. J Oral Rehabil. 2003;3:964–970. doi: 10.1046/j.1365-2842.2003.01169.x. [DOI] [PubMed] [Google Scholar]
- 12.Hung H-C, Colditz G, Joshipura KJ. The association between tooth loss and the self-reported intake of selected CVD-related nutrients and foods among US women. Community Dent Oral Epidemiol. 2005;33:167–173. doi: 10.1111/j.1600-0528.2005.00200.x. [DOI] [PubMed] [Google Scholar]
- 13.Hung HC, Willett W, Ascherio A, et al. Tooth loss and dietary intake. J Am Dent Assoc. 2003;134(9):1185–92. doi: 10.14219/jada.archive.2003.0353. [DOI] [PubMed] [Google Scholar]
- 14.Siriphant P, Drury TF. Healthy practices, social relationships, and dental perceptions among US dentate adults. J Public Health Dent. 2005;65:36–42. doi: 10.1111/j.1752-7325.2005.tb02784.x. [DOI] [PubMed] [Google Scholar]
- 15.Huff M, Kinion E, Kendra MA, et al. Self-esteem: a hidden concern in oral health. Journal of Community Health Nursing. 2006;23:245–255. doi: 10.1207/s15327655jchn2304_5. [DOI] [PubMed] [Google Scholar]
- 16.Gilbert GH, Duncan RP, Heft MW, et al. Oral disadvantage among dentate adults. Community Dent Oral Epidemiol. 1997;25:301–313. doi: 10.1111/j.1600-0528.1997.tb00944.x. [DOI] [PubMed] [Google Scholar]
- 17.Dye BA, Tan S, Smith V, et al. Trends in oral health status: United States 1988–1994 and 1994–2004. National Center for Health Statistics, Vital Health Stat. 2007;11(248) [PubMed] [Google Scholar]
- 18.Jones DB, Niendorff WJ, Broderick EB. A review of the oral health of American Indian and Alaska Native elders. J Public Health Dent. 2000;60(Suppl 1):256–60. doi: 10.1111/j.1752-7325.2000.tb04071.x. [DOI] [PubMed] [Google Scholar]
- 19.Indian Health Service . An Oral Health Survey of American Indian and Alaska Native Dental Patients: Findings, Regional Differences and National Comparisons. Indian Health Service; Washington DC: 1999. [Google Scholar]
- 20.Vargas CM, Yellowitz JA, Hayes KL. Oral health status of older rural adults in the United States. J Am Dent Assoc. 2003;134:479–486. doi: 10.14219/jada.archive.2003.0199. [DOI] [PubMed] [Google Scholar]
- 21.Vargas CM, Dye BA, Hayes KL. Oral health status of rural adults in the United States. J Am Dent Assoc. 2002;133:1672–81. doi: 10.14219/jada.archive.2002.0120. [DOI] [PubMed] [Google Scholar]
- 22.Vargas CM, Dye BA, Hayes K. Oral health care utilization by US rural residents, National Health Interview Survey 1999. J Public Health Dent. 2003;63:150–7. doi: 10.1111/j.1752-7325.2003.tb03493.x. [DOI] [PubMed] [Google Scholar]
- 23.Guay AH. Access to dental care: solving the problem for underserved populations. J Am Dent Assoc. 2004;135(11):1599–605. doi: 10.14219/jada.archive.2004.0088. [DOI] [PubMed] [Google Scholar]
- 24.Folstein MF, Folstein SE, McHugh PR. “Mini-Mental State” : a practical method for grading the cognitive state of patients for the clinician. J Psychiatr Res. 1975;12:189–198. doi: 10.1016/0022-3956(75)90026-6. [DOI] [PubMed] [Google Scholar]
- 25.Crum RM, Anthony JC, Bassett SS, Folstein MF. Population-based norms for the Mini-Mental State Examination by age and educational level. JAMA. 1993;269:2386–2391. [PubMed] [Google Scholar]
- 26.Hildebrandt GH, Dominguez BL, Schork MA, et al. Functional units, chewing, swallowing, and food avoidance among the elderly. J Prosthet Dent. 1997;77(6):588–95. doi: 10.1016/s0022-3913(97)70100-8. [DOI] [PubMed] [Google Scholar]
- 27.Sheiham A, Steele J. Does the condition of the mouth and teeth affect the ability to eat certain foods, nutrient and dietary intake and nutritional status amongst older people? Public Health Nutr. 2001;4(3):797–803. doi: 10.1079/phn2000116. [DOI] [PubMed] [Google Scholar]