

Abstract
Detection of new designer drugs remains an analytical challenge due to the ability of manufacturers to rapidly substitute closely related analogs for banned substances. Traditional targeted mass spectrometry methods rely on library searches, known masses, or multiple reaction monitoring (MRM) transitions and are therefore often unable to detect or identify recently discovered or yet unreported designer drug analogs. Here, high-resolution mass spectrometry in conjunction with mass defect filtering is presented as a method for non-targeted analysis to detect both known and novel analogs of designer drugs. The technique is applied in depth to a family of designer drugs composed of indole-derived synthetic cannabinoids closely related to JWH-018, a substance recently controlled in the United States. A single mass defect filter with a 50 mDa window encompasses over 80% of all currently published structures in this family. Searching for precursor ions of common fragment ions enables detection of compounds with mass defects that fall outside the range of mass defect filter parameters. Application of a mass defect filter to fragment ions prior to precursor ion searching increases the breadth of analogs that can be detected. The combined approach defines a broad-spectrum search for related molecules.
Keywords: Designer drugs, mass defect filtering, non-targeted analysis, synthetic cannabinoid, JWH-018
INTRODUCTION
Designer drugs are chemical analogs of illegal abused substances, usually devised to circumvent drug laws.1 One family of designer drugs that has gained considerable attention recently is synthetic cannabinoids. Examples such as JWH-018, CP 47,497, and AM-2201 are commonly found in herbal incense blends sold at gas stations, “head shops,” and on the internet. These compounds produce psychotropic effects that mimic those of cannabis, but the frequency and severity of adverse effects are much greater. Commonly reported adverse effects include hypertension, agitation, elevated heart rate, hallucinations, seizures, and panic attacks.2–6 Several countries have passed bans on the most frequently encountered of these compounds, and as of March 1, 2011, JWH-018, JWH-073, JWH-200, CP-47,497, and cannabicyclohexanol are officially classified as schedule 1 controlled substances by the US Drug Enforcement Agency (DEA).7
Detection of designer drugs remains a challenge because as bans on specific compounds go into effect, manufacturers rapidly substitute closely related analogs for the newly banned substances, creating a constantly moving analytical target. Several mass spectrometry (MS) based methods for detection have been published recently including GC-MS,8–10 LC-MS and LC-MS/MS,11–13 and MALDI-TOF.14 However, all of these methods are targeted approaches and rely on library searches, known masses, or multiple reaction monitoring (MRM) transitions, and therefore are often unable to detect recently discovered or unreported designer analogs. A recent study by Uchiyama et al.,15 used GC-MS, LC-MS, LC-UV, DART-TOF, and NMR to identify four new adulterants not previously detected in herbal products. All four adulterants were eventually identified as JWH synthetic cannabinoids, exemplifying the difficulties in detecting and identifying unreported designer analogs.
Due to the recent proliferation of designer drugs available, a non-targeted approach is needed to keep pace with the rapid turnover of compounds being marketed for recreational use. Approaches using full-scan accurate mass instruments partially fill this need by collecting and storing data for all ions in a sample, making retrospective non-targeted analysis possible. Thus, while the initial data inspection may employ a targeted approach, designer analogs that are unreported or unknown at the time of analysis, and therefore not included in the initial targeted screening, can be targeted at a later date in post acquisition data processing. While these types of methods provide some improvement over traditional targeted assays, they still rely on the success of other methods to identify new designer analogs to be targeted in post-acquisition data analysis.
Here, a method using high-resolution MS in conjunction with mass defect filtering is presented as a non-targeted approach to screen for designer cannabinoids. As is the case with many families of designer drugs, including cathinones, piperazines, and phenethylamines, designer analogs of synthetic cannabinoids are made by altering functional groups attached to the core structure of a template compound, often with the intent to elude detection yet preserve desired psychotropic effects. Many of the JWH compounds, including JWH-018, are within a subset of synthetic cannabinoids that are based on an indole core structure. Indole-derived synthetic cannabinoids were originally synthesized in the lab of Dr. John W. Huffman to explore structure-activity relationships at CB1 and CB2 cannabinoid receptors.16, 17 Recently, they have gained popularity for recreational use, and JWH-018 has been widely reported in smokable herbal incense products, along with analogs with minor structural modifications to create JWH-073 and JWH-250.3, 18–20 While most of these structural modifications result in a shift in mass, the mass defect typically remains close to that of the original compound. By applying a mass defect filter to a liquid chromatography-mass spectrometry (LC-MS) data set, ions with mass defects significantly shifted from that of the original compound can be eliminated. This process simplifies data sets and is effective at filtering out potential designer drugs from matrix elements and other components in unknown samples.
The benefit to this approach over traditional targeted analyses, is that it gives an investigator insight into the identities of components of an unknown sample, based on their mass defects. An analytical standard must be run for confirmatory purposes, but it is difficult to run an analytical standard for an unidentified compound. By narrowing the list of possible compounds by structural class based on mass defect, and further elucidating structure by fragmentation patterns, it gives an analytical chemist a reasonable starting place from which to choose appropriate analytical standards. Furthermore, for many newly emerging designer drugs, analytical standards are not available. A method such as this that provides information about possible identity can be used to guide custom synthesis of predicted components, which can then be run as analytical standards for comparison.
EXPERIMENTAL
Materials
All solvents were HPLC grade or better, purchased from Sigma-Aldrich (St. Louis, Missouri), and used without further purification. Synthetic cannabinoid standards were synthesized in the lab of Dr. John W. Huffman and provided by Dr. Jenny L. Wiley, or purchased from Cayman Chemical (Ann Arbor, Michigan). Herbal product samples, sold as incense and advertised as legal, were purchased from head shops and gas stations in and around Chapel Hill, North Carolina in two batches, one prior to and one after the DEA ban on five specific synthetic cannabinoids. Due to rapidly changing drug laws, preventative measures were taken to register all samples with the DEA and add them to our controlled substances inventory.
Sample Preparation
Herbal products were subjected to an ethanol extraction for LC-MS analysis. 10–15 mg of each herbal product were combined with ethanol at a ratio of 70 μL/mg of plant material. This sample size was deemed sufficient to provide representative sampling of the products. Samples were sonicated for 10 min followed by centrifugation at 4°C and 18,000 × g for 10 min. Supernatants were filtered using Durapore PVDF 0.1 μm centrifugal filter units (Millipore Corp, Billerica, MA) and diluted 10-fold with 50:50 ethanol:water (V:V). Extractions were stored at −20 °C and were further diluted 100-fold with 50:50 ethanol:water prior to analysis.
LC-MS
Samples were analyzed using a Waters Synapt G2 HDMS quadrupole time of flight (Q-TOF) instrument interfaced to a Waters Acquity UPLC system. Since this is a non-targeted approach, instrument conditions were chosen that produced optimal responses from a wide variety of synthetic cannabinoids. The Synapt system was operated in resolution mode giving a resolving power of around 20,000. Data were acquired with a 500 ms scan time using positive mode electrospray ionization and a capillary voltage of 2.9 kV, source temperature of 150 °C, desolvation temperature of 500 °C, sampling cone at 31 V, and extraction cone at 4 V. The mass spectrometer was externally calibrated from 50 – 800 Da using a sodium formate solution, and mass shifts during acquisition were corrected for using leucine enkephalin as a lockmass. Data were acquired using a generic data independent MSE method,21 in which low and high collision energy data are collected nearly simultaneously for every m/z. The method consisted of one low energy function with a trap collision energy (CE) of 6 eV, and one high energy function with a trap CE ramp from 20 to 40 eV. Liquid chromatography was performed by injecting 2 uL of sample onto a BEH C18 column (1.7 μm 2.1 × 50 mm) held at 40 °C. A gradient with mobile phase A consisting of 95% 10 mM ammonium acetate with 5% methanol and mobile phase B consisting of 95% methanol with 5% 10 mM ammonium acetate was used at a flow rate of 400 μL/min. The gradient was increased linearly from 50 to 70% B over 2 min, then from 70 to 95% B over 4 min, held at 95% B for 3 min, decreased to 50% B over 0.1 min, then equilibrated at 50% B for 2.9 min. All extracted ion chromatograms were extracted with a mass window of 0.02 Da unless otherwise noted.
Six synthetic cannabinoids (JWH-200, JWH-015, JWH-250, JWH-073, JWH-018, and JWH-019) were quantified in herbal samples using synthetic standards purchased from Cayman Chemical. A seven point calibration curve was prepared in 50:50 ethanol:water over the range from 2.5 to 1250 ng/mL. Peak areas were calculated from extracted ion chromatograms of the exact masses, with a window of 0.02 Da, from the low CE function.
Mass Defect Filtering
The mass defect of a compound refers to the fractional, or non-integer, portion of its monoisotopic mass. A mass defect filter consists of a target mass defect and a specified tolerance range above and below the target. When a filter is applied to an LC-MS data file, ions whose mass defects fall within the specified tolerances are retained, while ions with mass defects outside the range are removed. Filtering of LC-MS data was done using Waters MassLynx software version 4.1 SCN 833.
RESULTS AND DISCUSSION
The composition of the plant material varied greatly in visual appearance between samples, but Damiana (Turnera diffusa), Mugwort (Artemisia vulgaris), Mullein (Verbascum thapsus), and Marshmallow (Althaea officinalis) leaves were commonly advertised on the packaging. (Photographs and spectra of all the materials tested have been made publically available in a searchable database at www.forensicdb.org.) Several methods were examined to extract synthetic additives from the plant material. Methods that included grinding resulted in higher background levels without any apparent increase in synthetic cannabinoid extraction efficiency. This finding is not surprising, considering anecdotal reports on how these products are made—by first dissolving synthetic additives in acetone or another solvent, then spraying the resulting solution on the surface of the plant material. The final method chosen involved a simple sonication in ethanol followed by filtration.
Mass Defect Filtering of Intact Ions
Table 1 lists modifications which, when applied to JWH-018 as a template core structure, can be used to describe all of the published JWH indole-derived synthetic cannabinoids and their corresponding effects on mass defect. Some of the modifications, such as successive alkylations or dealkylations, result in a significant shift in mass defect on their own, but as shown in Table 2, the final molecule resulting from the total of all modifications often has a minimal mass defect shift compared to the core structure.
Table 1.
Modifications in published indole-derived cannabinoid structures.
| Modification | Mass Shift (Da) | Mass Defect Shift (mDa) | Net Formula Change |
|---|---|---|---|
| Methyl | 14.01565 | 15.7 | +CH2 |
| Methoxy | 30.01057 | 10.6 | +OCH2 |
| Hydroxyl | 15.99492 | −5.1 | +O |
| Morpholine | 85.05276 | 52.8 | +C4H7NO |
| Naphthalene | 126.04695 | 46.9 | +C10H6 |
| Benzyl | 90.04695 | 46.9 | +C7H6 |
| Benzene | 76.03130 | 31.3 | +C6H4 |
| Cyclohexane | 82.07825 | 78.2 | +C6H10 |
| Cyclopropyl | 40.03130 | 31.3 | +C3H4 |
| 1–3 benzodioxole | 120.02113 | 21.1 | +C7H4O2 |
| Reduction | 2.01565 | 15.6 | +H2 |
| Fluoro | 17.99058 | −9.4 | −H +F |
| Chloro | 33.96103 | −39.0 | −H +Cl |
| Bromo | 77.91051 | −89.5 | −H +Br |
| Iodo | 125.89665 | −103.3 | −H +I |
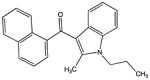
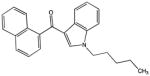
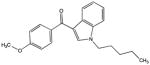
Table 2.
Structures of indole-derived synthetic cannabinoids.
| Compound | Structure | Molecular Weight (Da) | Mass Shift from JWH-018 | Mass Defect Shift from JWH-018 (mDa) | Modifications from JWH-018 |
|---|---|---|---|---|---|
| JWH-015 |
|
327.16231 | −14.01565 | −15.6 | − methyl |
| JWH-018 |
|
341.17796 | 0.00000 | 0.0 | N/A |
| JWH-019 |
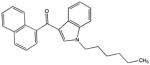
|
355.19361 | 14.01565 | 15.6 | + methyl |
| JWH-073 |
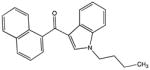
|
327.16231 | −14.01565 | −15.6 | − methyl |
| JWH-081 |

|
371.18853 | 30.01057 | 10.6 | + methoxy |
| JWH-122 |
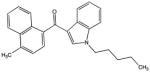
|
355.19361 | 14.01565 | 15.6 | + methyl |
| JWH-200 |
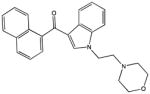
|
384.18377 | 43.00581 | 5.8 | + morpholine − (3)methyl |
| JWH-210 |
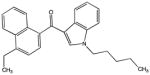
|
369.20926 | 28.03130 | 31.3 | + (2)methyl |
| JWH-250 |
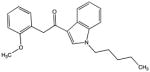
|
335.18853 | −5.98943 | 10.6 | − naphthalene + benzyl + methoxy |
| AM-694 |
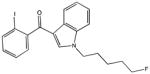
|
435.04954 | 93.87158 | −128.4 | − naphthalene + benzene + fluoro + iodo |
| AM-2201 |
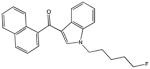
|
359.16854 | 17.99058 | −9.4 | + fluoro |
| RCS-4 |
|
321.17288 | −20.00508 | −5.1 | − naphthalene + benzene + methoxy |
| RCS-8 |
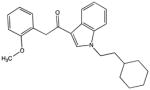
|
375.21983 | 34.04187 | 41.9 | − naphthalene + benzyl + methoxy + cyclohexane − (3)methyl |
| WIN 48,098 (Pravadoline) |
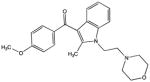
|
378.19434 | 37.01638 | 16.4 | − naphthalene + benzene + methoxy + morpholine − (2)methyl |
As shown in Figure 1, the majority of compounds in this family have mass defects between 0.13 and 0.23 mDa. A mass defect filter centered at 0.185 with a window of ±50 mDa would capture approximately 75% of the currently published structures. The small population of compounds with mass defects less than 0.13 mDa is primarily composed of structures halogenated with Cl, Br, or I. The large mass defect shifts associated with these compounds makes filtering unlikely to capture intact Cl, Br, or I containing analogs. However, Cl and Br produce characteristic isotope patterns that modern software tools can easily detect. If these analogs are removed from the analysis (Figure 1B), a filter centered at 0.185 with a window of ±50 mDa would capture approximately 85% of the compounds. The remaining 15%, with mass defects less than 0.13 mDa and greater than 0.23 mDa, result from iodination and successive alkylation, respectively. These modifications result in large shift in both mass and mass defect, making them better suited to detection by precursor ion searching or mass defect filtering of fragment ions (see below).
Figure 1.

Distribution of mass defects of all published JWH indole-derived synthetic cannabinoids (A) and a subset of structures that do not contain Cl or Br (B).
The utility of mass defect filtering of intact ions is demonstrated with the LC-MS analysis of an ethanol extraction of one of the purchased herbal products, “K2-Summit,” as shown in Figure 2A. This chromatogram is typical of all the products tested, i.e., several small peaks with one or two very intense peaks. Based on its exact mass, fragment ions, and retention time match to a standard, the peak at 4.36 min is readily identified as JWH-018. Without further processing, there are no other obvious indications for the presence of additional synthetic cannabinoids. Application of a filter centered at 0.1859, the mass defect of a protonated JWH-018 ion, with a window of ±50 mDa (0.1359 to 0.2359) significantly reduced the background (Figure 2B), highlighting several additional peaks of potential interest. Narrowing the window to ±20 mDa (0.1659 to 0.2059) almost completely removed the background and isolated an additional peak (and possible indole-derived cannabinoid) at a retention time of 3.80 min (Figure 2C). Further narrowing the window to ±10 mDa (0.1759 to 0.1959) further reduced the background ions and left the two peaks at 3.80 min and 4.36 min (Figure 2D), but the improvement is negligible compared to a ±20 mDa window. Based on its exact mass, fragment ions, and retention time match to a standard, the peak at 3.80 min is identified as JWH-250 (see supporting information).
Figure 2.

Total ion chromatogram of “K2-Summit” with no filtering (A) and with a mass defect filter centered at 0.1859 with a window of ±50 mDa (B), ±20 mDa (C), and ±10 mDa (D).
Precursor Ion Searching
Due to their similar core structures, compounds within a family of designer drugs often have the same fragment ions (see supporting information). Searching for precursor ions of these common fragments leads to compounds that are likely members of the family. This approach may be especially useful to find compounds with intact mass defects that are significantly shifted from the core structure, but where the modification does not affect one or more of the common fragments. Use of an MSE acquisition mode makes a modified precursor ion search with a Q-TOF instrument possible, analogous to traditional precursor ion scanning in a triple quadrupole instrument. In this mode, high collision energy (CE) data are collected nearly simultaneously with low CE data in alternating scans. The high and low CE data are stored in separate functions. Creating extracted ion chromatograms for specific fragment ions common to a family of designer drugs in the high CE function indicates at which retention times those fragments were produced. Masses present at the same retention times in the low CE function are possible precursor ions, and therefore potential members of the family. It should be noted that this acquisition method does not use mass selection prior to fragmentation, so signal purity is dependent on chromatographic resolution. If ambiguity exists due to poor chromatographic resolution, possible precursor ions can be confirmed by traditional MS/MS in a second injection.
The low CE total ion mass chromatogram for “Mr Nice Guy - Herbal Smoke Blend” (Figure 3A) contains an intense peak at 4.36 min corresponding to JWH-018. Applying a mass defect filter centered at 0.1859 with a window of ± 20 mDa effectively filters out background ions and reveals an additional potential indole-derived cannabinoid at a retention time of 4.86 min (Figure 3B). This new peak is also discovered independently of mass defect filtering by using precursor ion searching. For the indole-derived synthetic cannabinoids, fragment ions at 155.0497, 127.0547, and 214.1232 m/z are common. The fragments corresponding to these masses for JWH-018 are shown in Figure 3. Extracted ion chromatograms for the 127.056, 155.051, and 214.124 m/z fragments from the high CE function are shown in Figures 3C, 3D, and 3E respectively. As expected, for JWH-018 there is a peak at 4.36 min in the high CE extracted ion chromatograms for each of these m/z values. For the 127.056 and 155.051 fragments, there is an additional peak at 4.86 min. The presence of these two fragments but not the 214.124 fragment indicates that this is most likely a JWH-018 analog with a modification on the indole side of the carbonyl. Examination of the masses present in the low CE chromatogram at 4.86 min reveals a singly charged ion at 356.2015 m/z (355.1936 Da uncharged mass). The mass, fragmentation pattern, and retention time are a match to a JWH-019 standard (Figure S1). There is not an obvious peak at this retention time in the low CE data, and this minor component would have been overlooked without advanced data processing.
Figure 3.

Low collision energy total ion chromatogram for “Mr. Nice Guy - Herbal Smoke Blend” unfiltered (A) and with a mass defect filter centered at 0.1859 with a window of ±50 mDa (B). Extracted ion chromatograms for high collision energy fragment ions at 127.056 m/z (C), 155.051 m/z (D) and 214.124 m/z (E). The peak at 4.36 min is JWH-018 and the peak at 4.86 min is JWH-019.
Mass Defect Filtering of Fragment Ions
Precursor ion searching based solely on known fragments of a template designer drug structure will only successfully detect analogs with at least one fragment in common with the template structure. Analogs with modifications that shift the masses of all common fragment ions will likely be missed. However, many modifications that alter the fragment masses significantly have a minimal impact on their mass defects (Table 1). Therefore, precursor ion searching based on mass defect filtered fragment ions increases the breadth of analogs that can be detected. This technique is ideally suited to help detect and identify analogs with modifications that produce intact masses and mass defects that are significantly shifted from those of the template core structure, but cause only a minimal shift in mass defect of one or more common fragment ions.
Data from the analysis of “Spice 99 - GI Joe” are shown in figure 4. The high CE total ion chromatogram containing all fragment ions (Figure 4A) has one intense peak at 2.31 min, several smaller peaks, and a high background baseline. Applying a filter centered at 0.051 (the mass defect of a common fragment ion of JWH-018) with a window of ±20 mDa (Figure 4B) produces a chromatogram with virtually no background and a single peak at a retention time of 2.31 min. The high CE mass spectrum at 2.31 min (Figure 4C) contains two fragment ions, 107.0504 and 135.0459 m/z, with mass defects very close to those of common indole-derived cannabinoid fragments. The precursor ion leading to these fragments is likely an indole-derived cannabinoid. Precursor ion information is stored in the low CE data function, and at 2.31 min (Figure 4D) the mass spectrum is dominated by a singly charged precursor at 379.2027 m/z and its sodiated ion at 401.1850 m/z. The retention time, mass, and fragment ions are a match to a WIN 48,098 standard (Figure S1). While not one of the many indole-derived synthetic cannabinoids in the JWH-series, it shares a similar structural core and would be considered a member of the same family of designer drugs (along with many of the compounds synthesized by Alexandros Makriyannis,22 including AM-694 and AM-2201). The structure of WIN 48,098 and fragments leading to the observed masses are shown in Figure 4. This molecule has modifications to both sides of the carbonyl compared to JWH-018, but the mass defects of the resulting fragment ions are very close to those of JWH-018. The mass defect of the intact ion is also only 16.4 mDa from that of JHW-018 and therefore could be found by a mass defect filter of precursor ions, but serves as an example of the utility of this method when modifications alter the mass of all common fragment ions.
Figure 4.

High CE fragment ion chromatogram of “Spice 99 - GI Joe” unfiltered (A) and with a mass defect filter centered at 0.051 with a window of ±20 mDa (B). The peak at 2.31 is identified as WIN 48,098 based on the high CE fragments (C) and the low CE ions present at 2.31 min (D), and retention time match to a standard.
LC-MS Analysis of Herbal Samples
Using these advanced approaches to analyze a set of herbal products, at least one synthetic cannabinoid was found in each sample. The samples were also subjected to a targeted quantitative analysis for JWH-200, JWH-015, JWH-250, JWH-073, JWH-018, and JWH-019. The MSE acquisition method allows quantification based on either exact masses using low CE data or pseudo SRM using fragment ions from high CE data. Signal was sufficient for pseudo SRM quantification, but due to identical fragment ions and less than ideal chromatographic resolution between several of the targeted analytes, and unknown retention times of possible non-targeted analytes, the lack of mass selection prior to fragmentation made this approach unreliable. The results of quantification based on extracted ion chromatograms of exact masses using low CE data are summarized in Table 3.
Table 3.
Synthetic cannabinoids detected in herbal products.a
| Brand Name | Description | JWH-200 | JWH-015 | JWH-250 | JWH-073 | JWH-018 | JWH-019 | Win 48,098 (Pravadoline) | AM-694 | AM-2201 | JWH-081 | JWH-122 | |
|---|---|---|---|---|---|---|---|---|---|---|---|---|---|
| 2.46 | 3.56 | 3.80 | 3.84 | 4.36 | 4.87 | 2.30 | 2.78 | 3.30 | 4.61 | 4.80 | Retention time (min) | ||
| 385.1917 | 328.1702 | 336.1964 | 328.1702 | 342.1859 | 356.2015 | 379.2022 | 436.0574 | 360.1764 | 372.1964 | 356.2015 | Protonated MW (Da) | ||
| ng/mg | |||||||||||||
|
|
|
||||||||||||
| K2 | Summit | 3837 | |||||||||||
| K2 | Summit | 486 | 6066 | ||||||||||
| Happy Shaman Herbs | Humboldt Gold | 10804 | 9898 | ||||||||||
| Happy Shaman Herbs | Pink Tiger | 5428 | 4519 | ||||||||||
| Happy Shaman Herbs | Brain Freeze | 1906 | |||||||||||
| Meditation | Strawberry | 20496 | < 50 | x | |||||||||
| Meditation | Strawberry | 10984 | x | ||||||||||
| Meditation | Mango | 8791 | x | ||||||||||
| Meditation | Blueberry | 7762 | x | ||||||||||
| Spice99 | Bad 2 the Bone (Cinnamon) | 3469 | x | ||||||||||
| Mr. Nice Guy | Herbal Smoke Blend | 14483 | 386 | ||||||||||
| Solowholesale | Cloud 49 (Ultra Strong, Irish Crème) | 209 | x | ||||||||||
| N/A | Ultra Cloud 10 | 11380 | 22440 | ||||||||||
| Generic (Ultimate) | Spice! Double Strength | 11153 | |||||||||||
| Generic (Premium) | Spice! | 5810 | |||||||||||
| Hot Hawaiian | Exotic Herbal Blend | 3562 | |||||||||||
| Tranquility Herbal Incense | Kush | 3299 | |||||||||||
| Deviltracks | Newprot (Mint) | 1175 | x | ||||||||||
| Flawless | Strawberry | 11181 | |||||||||||
| Black Magic Smoke | Herbal Incense | 221 | |||||||||||
| Purple Flake | N/A | 1406 | |||||||||||
| Southern Spice | Herbal Incense (Mango) | 6551 | |||||||||||
| Berry Twist | N/A | 8411 | |||||||||||
| Destiny | Exotic Herbal Blend | 27404 | |||||||||||
| Southern Spice | Blue Dream (Melon) | 2635 | |||||||||||
| Happy Shaman Herbs | Humboldt Gold | 9029 | 8263 | ||||||||||
| Spice99 | Stinger | x | x | ||||||||||
| Spice 99 | GI Joe | x | |||||||||||
| Spice 99 | GI Jane | x | |||||||||||
| Purple Puff | Kush | 5979 | |||||||||||
| Yeah Right | Head Funk | x | |||||||||||
| Happy Tiger | N/A | x | |||||||||||
JWH-200, JWH-015, JWH-250, JWH-073, JWH-018, and JWH-019 were quantified using purchased standards. A number indicates the calculated concentration of the analyte in the sample in ng/mg plant material, and an x indicates that the compound was present, but not quantified. Products in the shaded region were purchased after the US DEA ban went into effect.
JWH-018 was the most commonly found additive prior to the DEA scheduling; however, its prevalence appears to have lessened since then. JWH-250 and JWH-081 were the next two most commonly detected synthetic cannabinoids, followed by JWH-073. These results are in qualitative agreement with results recently obtained in our group using headspace solid-phase micro-extraction and gas chromatography-mass spectrometry (HS-SPME-GC-MS) to analyze the same product samples.10 The two analyses were done independently using samples weighed out by different technicians from the same packages, indicating that the sample sizes for each analysis (50 mg for HS-SPME-GC-MS and 10–15 mg for LC-MS) were sufficient to be representative of the contents of the packages. A great deal of non-uniformity within samples is still expected, and differences were seen between multiple packages of the same product. Similarities were seen for products within the same brand, e.g., JWH-250 in Meditation products and WIN 48,098 in Spice99 products. Interestingly, the generic spice product advertised to be “Double Strength” did contain approximately twice the amount of JWH-018 as its regular strength counterpart. Standards for JWH-073 and JWH-018 produced very high instrument responses, as measured by total area under the chromatographic peak. Instrument responses for JWH-250 and JWH-015 were about 50% and responses for JWH-019 and JWH-200 were only 15% of those for JWH-073 and JWH-018.
CONCLUSIONS
Most compounds within a family of designer drugs are based on a template core structure, and therefore have similar intact structures and common fragments. Modifications to the structural core often result in a substantial shift in mass, with only a minimal shift in mass defect. Searching for related compounds based on mass defect is a common strategy for metabolite identification23 and has proven useful for removing interferences from complex biological matrices.24, 25 The same principle can be applied to screening for designer drugs in a non-targeted analysis, making mass defect filtering an effective tool for selecting chromatographic peaks likely related to structural analogs of known designer drugs. Mass defect filtering can be used on both intact masses and fragment ion chromatograms to identify compounds present at low levels that would otherwise be difficult to discern. The MSE acquisition method allows post acquisition data analysis and quantification based on parent ion exact mass or fragment ions in a pseudo SRM approach. One of the most powerful features of MSE is that it collects data in a non-targeted fashion, without discrimination or preselection. Therefore the data can be re-interrogated at any time. Mass defect filtering combined with MSE acquisition is well suited for use in a non-targeted screening method to identify new analogs to currently banned substances when faced with an unknown sample.
Supplementary Material
Acknowledgments
The authors thank Dr. John W. Huffman for access to JWH synthetic standards. This work was supported by internal research and development funds at RTI International and by National Institute on Drug Abuse grant DA-031988.
Footnotes
SUPPORTING INFORMATION AVAILABLE
Low CE and high CE mass spectra for all standards listed in Table 3
Contributor Information
Megan Grabenauer, Email: mgrabenauer@rti.org.
Wojciech L. Krol, Email: wkrol@rti.org.
Jenny L. Wiley, Email: jwiley@rti.org.
Brian F. Thomas, Email: bft@rti.org.
References
- 1.Buchanan JF, Brown CR. Medical Toxicology and Adverse Drug Experience. 1988;3(1):1–17. doi: 10.1007/BF03259928. [DOI] [PubMed] [Google Scholar]
- 2.Auwarter V, Dresen S, Weinmann W, Muller M, Putz M, Ferreiros N. J Mass Spectrom. 2009;44(5):832–837. doi: 10.1002/jms.1558. [DOI] [PubMed] [Google Scholar]
- 3.Vardakou I, Pistos C, Spiliopoulou C. Toxicol Lett. 2010;197(3):157–62. doi: 10.1016/j.toxlet.2010.06.002. [DOI] [PubMed] [Google Scholar]
- 4.Muller H, Sperling W, Huttner HB, Kornhuber J, Maler JM. Schizophr Res. 2010;118(1–3):309–310. doi: 10.1016/j.schres.2009.12.001. [DOI] [PubMed] [Google Scholar]
- 5.Simmons J, Cookman L, Kang C, Skinner C. Clin Toxicol. 2011;49(5):431–433. doi: 10.3109/15563650.2011.584316. [DOI] [PubMed] [Google Scholar]
- 6.Forrester MB, Kleinschmidt K, Schwarz E, Young A. J Addict Dis. 2011;30(4):351–358. doi: 10.1080/10550887.2011.609807. [DOI] [PubMed] [Google Scholar]
- 7.DEA U. Federal Register. 2011;76(40):11075–11078. [Google Scholar]
- 8.Dresen S, Ferreiros N, Putz M, Westphal F, Zimmermann R, Auwarter V. J Mass Spectrom. 2010;45(10):1186–1194. doi: 10.1002/jms.1811. [DOI] [PubMed] [Google Scholar]
- 9.Kerrigan S, Banuelos S, Perrella L, Hardy B. J Anal Toxicol. 2011;35(7):459–469. doi: 10.1093/anatox/35.7.459. [DOI] [PubMed] [Google Scholar]
- 10.Cox AO, Daw RC, Mason MD, Grabenauer M, Pande PG, Davis KH, Wiley JL, Stout PR, Thomas BF, Huffman JW. J Anal Toxicol. 2012;36(5):293–302. doi: 10.1093/jat/bks025. [DOI] [PMC free article] [PubMed] [Google Scholar]
- 11.Bell C, George C, Kicman AT, Traynor A. Drug testing and analysis. 2011;3(7–8):496–504. doi: 10.1002/dta.306. [DOI] [PubMed] [Google Scholar]
- 12.Dresen S, Kneisel S, Weinmann W, Zimmermann R, Auwärter V. J Mass Spectrom. 2011;46(2):163–171. doi: 10.1002/jms.1877. [DOI] [PubMed] [Google Scholar]
- 13.Kacinko SL, Xu AL, Homan JW, McMullin MM, Warrington DM, Logan BK. J Anal Toxicol. 2011;35(7):386–393. doi: 10.1093/anatox/35.7.386. [DOI] [PubMed] [Google Scholar]
- 14.Gottardo R, Chiarini A, Dal Pra I, Seri C, Rimondo C, Serpelloni G, Armato U, Tagliaro F. J Mass Spectrom. 2012;47(1):141–146. doi: 10.1002/jms.2036. [DOI] [PubMed] [Google Scholar]
- 15.Uchiyama N, Kawamura M, Kikura-Hanajiri R, Goda Y. Forensic Toxicol. 2011;29(1):25–37. [Google Scholar]
- 16.Wiley JL, Compton DR, Dai D, Lainton JAH, Phillips M, Huffman JW, Martin BR. Journal of Pharmacology and Experimental Therapeutics. 1998;285(3):995–1004. [PubMed] [Google Scholar]
- 17.Huffman JW, Mabon R, Wu MJ, Lu J, Hart R, Hurst DP, Reggio PH, Wiley JL, Martin BR. Bioorganic & Medicinal Chemistry. 2003;11(4):539–549. doi: 10.1016/s0968-0896(02)00451-0. [DOI] [PubMed] [Google Scholar]
- 18.Schneir AB, Cullen J, Ly BT. J Emerg Med. 2011;40(3):296–299. doi: 10.1016/j.jemermed.2010.10.014. [DOI] [PubMed] [Google Scholar]
- 19.Uchiyama N, Kikura-Hanajiri R, Kawahara N, Goda Y. Forensic Toxicol. 2009;27(2):61–66. doi: 10.1007/s11419-015-0268-7. [DOI] [PMC free article] [PubMed] [Google Scholar]
- 20.Moller I, Wintermeyer A, Bender K, Jubner M, Thomas A, Krug O, Schanzer W, Thevis M. Drug testing and analysis. 2011;3(9):609–20. doi: 10.1002/dta.158. [DOI] [PubMed] [Google Scholar]
- 21.Bateman RH, Carruthers R, Hoyes JB, Jones C, Langridge JI, Millar A, Vissers JPC. Journal of the American Society for Mass Spectrometry. 2002;13(7):792–803. doi: 10.1016/S1044-0305(02)00420-8. [DOI] [PubMed] [Google Scholar]
- 22.Makriyannis A. Cannabimimetic Indole Derivatives. US Patent 6,900,236. 2005 May 31;:B1.
- 23.Zhang HY, Zhang DL, Ray K. J Mass Spectrom. 2003;38(10):1110–1112. doi: 10.1002/jms.521. [DOI] [PubMed] [Google Scholar]
- 24.Zhu MS, Ma L, Zhang DL, Ray K, Zhao WP, Humphreys WG, Skiles G, Sanders M, Zhang HY. Drug Metab Dispos. 2006;34(10):1722–1733. doi: 10.1124/dmd.106.009241. [DOI] [PubMed] [Google Scholar]
- 25.Bateman KP, Castro-Perez J, Wrona M, Shockcor JP, Yu K, Oballa R, Nicoll-Griffith DA. Rapid Commun Mass Spectrom. 2007;21(9):1485–1496. doi: 10.1002/rcm.2996. [DOI] [PubMed] [Google Scholar]
Associated Data
This section collects any data citations, data availability statements, or supplementary materials included in this article.