

Abstract
Unraveling the mechanisms underlying oscillatory behavior is critical for understanding normal and pathological brain processes. Here we used electrophysiology in mouse neocortical slices and principles of nonlinear dynamics to demonstrate how an increase in the N-methyl-D-aspartic acid receptor (NMDAR) conductance can create a nonlinear whole-cell current-voltage ( I – V ) relationship, which leads to changes in cellular stability. We discovered two behaviorally and morphologically distinct pyramidal cell populations. Under control conditions, both cell types responded to depolarizing current injection with regular spiking patterns. However, upon NMDAR activation, an intrinsic oscillatory (IO) cell type (n = 44) showed a nonlinear whole-cell I – V relationship, intrinsic voltage-dependent oscillations plus amplification of alternating input current, and these properties persisted after disabling action potential generation with TTX. The other non-oscillatory (NO) neuronal population (n = 24) demonstrated none of these behaviors.
Simultaneous intra- and extracellular recordings demonstrated the NMDAR’s capacity to promote low-frequency seizure-like network oscillations via its effects on intrinsic neuronal properties. The two pyramidal cell types demonstrated different relationships with network oscillation: the IO cells were leaders that were activated early in the population activity cycle while the activation of the NO cell type was distributed across network bursts. The properties of IO neurons disappeared in a low magnesium environment where the voltage-dependence of the receptor is abolished; concurrently, the cellular contribution to network oscillation switched to synchronous firing. Thus, depending upon the efficacy of NMDAR in altering the linearity of the whole-cell current-voltage relationship, the two cell populations played different roles in sustaining network oscillation.
Keywords: Neocortex, Pacemaker, Bursting, Compartmental Model, Mouse
Introduction
Oscillatory network behaviors are a hallmark of cortical activity, critical for sleep, neurodevelopment, motor coordination, and possibly binding of sensory perception (Ben-Ari, 2001; Buzsáki, 2006). It is generally accepted that oscillations in the nervous system emerge through an interactive and plastic interplay between synaptic and intrinsic membrane properties (e.g. Chagnac-Amitai and Connors, 1989; van Drongelen et al., 2005, 2006; Purvis et al., 2007; Del Negro et al., 2008; Benayoun et al., 2010). A detailed understanding of this interaction is critical for explaining oscillatory function in the nervous system and why many oscillations turn pathological and result in neurological disorders such as epilepsy (Schwartzkroin, 1993).
The N-methyl-D-aspartic acid receptor (NMDAR) is of particular interest in this context, because it acts as a regulator of both synaptic transmission and intrinsic excitability. As a mediator of synaptic interactions, the NMDA receptor plays an important role in orchestrating the dynamic balance of excitation and inhibition in the cortex (Hull et al., 2009) and inducing activity-dependent plasticity, particularly long-term potentiation (Nicoll, 2003). However, evidence suggests that a large fraction (30–50%) of NMDA receptors are bound at ambient concentrations of glutamate in vivo (Sah et al., 1989; Ashcroft, 2000), highlighting the critical contribution of the NMDAR to intrinsic cell activity. Indeed, previous studies have demonstrated the fundamental role of the NMDAR in the production of regenerative spikes in the thin basal and distant tuft dendrites (Schiller et al., 2000; Rhodes, 2006; Larkum et al., 2009), which can potentially mediate both detection and facilitation of bursting (Polsky et al., 2009). These intrinsic behaviors most likely rely heavily on the interaction of the NMDAR with magnesium ions, which confers it with voltage-dependence near the resting potential (Jahr and Stevens, 1990). This voltage dependence produces an N-shaped I-V relationship that can promote cellular bistability as the NMDAR conductance increases (Schiller and Schiller, 2001). At the whole-cell and circuit level, this property of the NMDAR has been shown to be associated with nonlinear membrane behavior and oscillations in neurons of the spinal cord (Rioult-Pedotti, 1997; Keefer et al., 2001; MacLean and Schmidt, 2001), hippocampus (Bonansco et al., 2002), and neocortex (Kobayashi et al., 1993; Minlebaev et al., 2007). Furthermore, disturbances of NMDAR function have been associated with neurological disease (Cull-Candy et al., 2001; Kalia et al., 2008; Bayreuther et al., 2009). This is especially true in tissue from surgical patients with epilepsy where pathological oscillation is the signature network behavior (Najm et al., 2004; Marcuccilli et al., 2010) suggesting a possible relationship between NMDAR-associated cellular oscillation and larger-scale network behavior.
Here, we examined how the NMDAR interacts at multiple levels of integration in the neonatal mouse neocortex, from the voltage dependence of the NMDA channel to the intrinsic behavior of layer V pyramidal neurons to the network. We hypothesized that cellular oscillation can be explained with principles of nonlinear dynamics and validated this with an experimental and computational approach. Our findings confirmed that the dynamics of network oscillation are related to the regenerative properties of the NMDAR promoting intrinsic excitability in a subpopulation of layer V neocortical pyramidal neurons. The contribution of pyramidal cells during network oscillations were shown to differ significantly from their role in network oscillation evoked in a low magnesium condition where voltage-dependence of the NMDAR is absent.
Materials and Methods
All experiments and protocols conformed to the guidelines for the care and use of animals approved by the Animal Care and Use Committee at the University of Chicago.
Slices
CD-1 mice, ages P8-12, were deeply anesthetized with halothane to minimize pain and discomfort, decapitated and the brain was isolated in ice-cold artificial cerebrospinal fluid (aCSF) consisting of (mM): 126 NaCl, 25 NaHCO2, 10 glucose, 5.4 sucrose, 3.5 KCl, 1.25 NaH2PO4, 2.0 CaCl2, and 1.0 MgCl2 equilibrated with 95% O2 and 5% CO2. Coronal slices (300 μm) of frontal cortex (between 600–1800 μm caudal from the rostral tip, containing a mixture of motor and association cortices) were cut on a vibrating tissue slicer and transferred to aCSF at room temp. These slices were incubated for a minimum of 30 minutes. Recordings were performed in a submersion chamber and perfused at 5–10 ml/min with the temperature raised to 30° C.
Recording
Patch pipettes (3–6 MΩ) were manufactured from filamented borosilicate glass capillaries and filled with intracellular solution containing (mM): 115 K-gluconate, 10 HEPES, 2 MgCl2, 20 KCL, 2 MgATP, 2 Na2ATP, 0.3 GTP, and 1% biocytin. Layer V pyramidal neurons in the frontal cortex were identified using infrared microscopy with a 40× water-immersion objective. Both current and voltage clamp measurements (Fig. 1A) were performed with the Axopatch 200B computer-controlled amplifier, which was connected to the computer with a Digidata 1320 ADC, and recorded at a sampling rate of 10 kHz (Axon Instruments, Sunnyvale, CA, USA). We did not correct for the junction potential of 12.5 mV. Only neurons with a membrane resistance >100 MΩ, an access resistance <20 MΩ, and a resting membrane potential below −55 mV were included.
Figure 1.
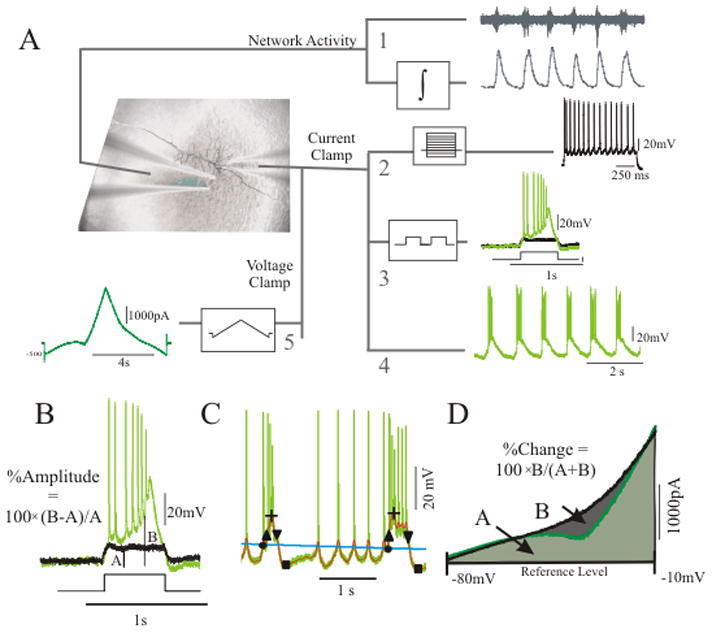
Network activity was recorded by an extracellular electrode placed within 150 μm from the intracellular electrode (van Drongelen et al., 2003). Signals were amplified 10,000 times and band pass filtered (30–2000 Hz) (npi electronic GmbH, Tamm, Germany); the filtered data was then rectified and integrated (using a low pass filter with a time constant of 50 ms) to produce integrated extracellular activity, an index of spiking activity in the network (Fig. 1A–1). Extracellular signals were digitized at 10 kHz (Digidata 1320 ADC, Axon Instruments, Sunnyvale, CA, USA).
Morphology
To assess dendritic and somatic structure, cells were filled with an internal solution containing 1% biocytin. Slices were then fixed in a 30% sucrose in formalin solution for > 12 hrs. Sections were washed in PBS with 0.3% Triton X-100 three times for 20 min each and were then incubated for overnight with a 1:500 dilution of streptavidin-conjugated Alexafluor 594 (Molecular Probes, Eugene, OR) PBS with 0.3% Triton X-100. Sections were then thoroughly washed again in PBS, mounted with an aqueous medium.
The structure was visualized using confocal microscopy with a Zeiss Axiovert 100 using LSM 510 software at 25× in 1-μm optical sections. Image stacks were viewed and Z-projected using ImageJ (National Institutes of Health, Bethesda, MD) or LSM Viewer (Zeiss). Three dimensional images were taken and these images were projected into two dimensions. The morphology was quantified by measuring the distance between the cell soma and the pia, the widest diameter of the cell soma orthogonal to the apical dendrite, the width of the apical dendrite halfway between the soma and the first dendritic branch, and the width of the tuft in layer I (Adobe Photoshop, Adobe Systems Incorporated, San Jose, CA). In addition, the dendritic area around the soma in the 25X objective view was assessed by using the image processing toolbox in Matlab. In standardized images, where the soma was in the center, the background white noise was removed and the picture was converted to an image with black and white pixels only. The ratio of the white to black pixels was taken as an index of the dendritic area.
Measurements
(1) Response to current steps (Fig. 1A – 2)
Figure 2.
The membrane and spiking characteristics were assessed by injection of a series of hyperpolarizing and depolarizing one second current steps from −0.20 nA to 0.30 nA (in increments of 0.05 nA). Action potential times were detected by recording the time at which the positive slope of the membrane potential crossed 0 mV. From the action potential times, the instantaneous frequency for each action potential was determined (1/inter spike interval) as well as the average action potential frequency for each current step. Action potential rate as a function of current injection was examined by plotting average frequency versus current amplitude.
Furthermore, we determined a set of characteristics from the step response at 0.25 nA. The amplitude of the first action potential was found by measuring the voltage difference between the peak voltage of the action potential and the subsequent minimum voltage prior to the next action potential. The half width of the action potential was determined as the average duration of the action potentials at half the amplitude. The frequency adaptation of each cell was the difference between the first and last instantaneous firing frequency divided by the first instantaneous firing frequency. The effect of the IH current was assessed by measuring the change in voltage between the maximum hyperpolarization and the steady state potential for the −0.20 nA current injection.
(2) Response to square wave input (Fig. 1A – 3)
Figure 3.
To assess how the cell responds to input or voltage fluctuations, the cell was injected with a 1 Hz square wave signal consisting of a train of seven square waves repeated at eight different amplitudes, ranging from 0.02 nA to 0.2 nA in steps of 0.025 nA. During this time, the cell was held to a baseline membrane potential of −65 mV to minimize the variability in voltage-dependent channels open at rest. With this protocol we determined whether the cell responded to change in input with a linearly increasing function or with an abrupt nonlinear jump in its response. In a simple fashion, this protocol evaluated how the cell might respond to oscillatory input as might occur during oscillatory input as in seizure propagation. The amplification of step input was quantified for different drug conditions by calculating the difference between the average response amplitude during control (Fig. 1B – amplitude A) and the average amplitude in the test condition (Fig. 1B – amplitude B) divided by the control value (i.e., %Amplitude = 100×(B−A)/A).
(3) The presence and analysis of spontaneous oscillation (Fig. 1A – 4)
Figure 4.

The presence of oscillation was determined by continuous recording of the membrane potential in current clamp while holding the cell at several potentials for 10 s. Membrane potentials from −80 mV to −20 mV were examined by testing a range of holding currents from −0.2 nA to 0.3 nA. Analysis of oscillation was performed using a pair of second order Butterworth filters and thresholds (Hill and Upadhyaya, 2009). Briefly, a cascade of two low pass filters was used to remove the action potentials from the raw signal to obtain signal 1 (thick grey outline - Fig. 1C) and another low pass filter was used to obtain a slow varying threshold, signal 2 (light grey line- Fig. 1C)). A burst was detected if signal 1>signal 2 by an amplitude >10 mV and for a duration >50 ms. The cutoff frequency of the threshold-generating filter was set at 0.3 Hz, and for each cell the cutoff frequency of the cascade of filters was tuned between 20–100 Hz to ensure detection of all bursts as assessed by visual inspection. Burst amplitude was measured from the peak of the depolarization to the trough before the next depolarization (plus sign and square -Fig. 1C). Burst frequency was determined from the inverse of the interval between the peaks of the oscillations. The burst duration was measured as the half width of the amplitude for that depolarization (interval between up and down pointing triangles in Fig. 1C).
(4) Steady state whole-cell I – V curve (Fig. 1A – 5)
Figure 5.

The whole-cell steady-state current-voltage ( I – V ) curve was measured using a slow voltage ramp while the cell was in voltage clamp mode. To ensure adequate space clamp, these recording were performed in the presence of 1.5 μM TTX to block the fast sodium channels. In 11 well-clamped neurons, recordings were also performed without TTX to verify that sodium channels did not significantly alter the subthreshold portion of the I – V curve. Starting with the cell being held at −60 mV, a slow ramp from −90 to +10 mV and back to −90 mV was then injected over an eight second interval. The resulting current trace reflected how an increasing and decreasing change in voltage manipulates the ion channels producing the current underlying an oscillation.
To validate the procedure with the voltage ramp, we also determined the I – V characteristic by using a series of (one second) voltage steps. Prior to each step, the cell was held at −60 mV for 1 s. The steps increased in ascending order from −90 mV to +10 mV in 2 mV increments. The last 200 ms of each step response was averaged and the current was compared to the current produced by the voltage ramp. In five neurons, the quantitative change in inward current and the shape of the current-voltage relationship as measured by both methods was identical. Therefore, only the voltage ramp protocol was used for the remaining neurons. The relative change in inward current between pairs of voltage ramps was determined as follows. Both curves were superimposed (Fig. 1D) and the minimum current value between −80 and −10 mV, for both curves, was determined. The lowest minimum value was chosen as the reference level (Fig. 1D- dashed line) for calculation of the area under the curve as well as the difference between the curves (Fig. 1D- areas A and B, respectively). The percent change (%Change) between curves was calculated as 100×B/(A + B). All signal analysis was done in Matlab 7.1 (Mathworks, Natick, MA).
Experiments
Our goal was to determine the mechanism behind N-methyl-D-aspartic acid (NMDA) induced oscillatory behavior in intrinsic oscillatory (IO) neurons. Therefore, we compared the activities in control conditions and after addition of 10 μM NMDA (n = 68). Next, tetrodotoxin (TTX, 1.5 μM) was used to block sodium channels including the persistent sodium channel (van Drongelen et al., 2006) and to isolate the cell from the surrounding network. If oscillations were present at this stage (n = 44), we performed one out of four tests.
One test was to evaluate the involvement of the NMDAR in the oscillation by blocking the receptor with 20 μM of CPP (3-(2-carboxypiperazine-4-yl) propyl-1-phosphate), (n = 14). A second test was to manipulate the voltage-dependence of the NMDA channel current directly by removing magnesium ions from the bath, thereby reducing the [Mg2+] to nominally 0 mM (Jahr and Stevens, 1990). Washing out Mg2+ reduces the magnesium-dependent blockade of the NMDA conductance at hyperpolarized potentials and the associated nonlinearity of the NMDA I – V curve. The 0 Mg2+ experiments were performed in two ways. In one case, the concentration of NMDA remained at 10 μM while [Mg2+] was washed out to nominally 0 mM (n = 3). This resulted in a deletion of the RNSC in the I – V relationship wile the maximum slope of the curve was maintained. In this approach, the maximum NMDA current increased, leading to strongly depolarized neurons. In addition, we used an alternative approach to avoid this excessive depolarization; here the amount of NMDA receptor current was controlled by reducing the NMDA concentration to 4 μM (n = 8). This concentration reduced the NMDA current found in 0 mM Mg2+ to levels similar to the current in 1 mM Mg2+ (Jahr and Stevens, 1990). To finalize the 0 Mg2+ test, 20 μM of CPP was employed to block the NMDA channel.
A third and fourth test was done to examine the role of the L-type calcium channel (Marcantoni et al., 2007; Cheong et al., 2008), and the R- and T-type calcium channels (Cheong et al., 2008). Nifedipine (NIF, 10 μM; n = 10) was used to block the L-type calcium channel and mibefradil (MIB, 5 μM; n = 7) to block the R- and T-type calcium channels.
All drugs were obtained from Sigma-Aldrich (St. Louis, MO). Throughout the analysis, the reference condition for evaluation of oscillation, response to step input, and the shape of the I – V curve was the behavior of IO neurons in 10 μM NMDA+1.5 μM TTX. This was done to ensure that the oscillations were truly intrinsic by blocking the network input through abolishment of action potentials from fast sodium channel activation.
Signal Analysis of Cell-Network Interaction
(1) Network Oscillation
Simultaneous neuronal and network oscillation was initiated in two ways: (a) oscillation with a nonlinear NMDA conductance was obtained by bath application of 10 μM NMDA in normal aCSF with 1 mM Mg2+; (b) oscillation with a linear NMDA conductance was acquired by equilibrating slices in aCSF with 0 mM Mg2+ and then applying 4 μM NMDA. Since our main interest was low-frequency and high-amplitude seizure-like network signals, we analyzed signals with network oscillations between 0.1 and 5 Hz and with a coefficient of variation (standard deviation divided by the mean) of both amplitude and duration < 30%. To ensure that the neuron was functionally embedded in the network producing the oscillation, we analyzed recordings where the neuron was active during the network bursts at least 80% of the time. This resulted in the analysis of 40% of recordings of type (a) and 88% of type (b).
(2) Frequency Analysis
Frequency synchronization was evaluated by computing the power spectra of the integrated extracellular network activity (Fig. 1A – 1, lower trace) and the membrane potential of the cell (Fig. 1A – 4) over a period of 13.1 s. The spectra were calculated using the fft command in Matlab and analyzed between 0–10 Hz. Each spectrum was normalized by dividing the signal by the maximum value between 0–10 Hz. The percentage overlap between the normalized membrane potential spectrum and the normalized network spectrum was assessed for each recording. The percentage overlap between both curves was defined as 100× the ratio between intersection (∩) and union (∪) of the areas under the curves.
(3) Phase Analysis
Phase synchronization was assessed in two ways: analysis of the phase differences between the cell and network spiking activity derived via the Hilbert transform (Pikovsky et al., 2001) and analysis of network burst-triggered raster plots (van Drongelen et al., 2003).
The instantaneous phase differences between the cell and network were obtained as follows. For the network, the extracellular activity was band-passed between 30–2000 Hz and for the cell, a signal of 1’s and 0’s was created from the voltage trace, where 1 indicated an action potential at that point in time (defined as the membrane potential above 0 mV). These two signals where then sent through a second order, leaky integrator (using a low pass filter with a time constant of 50 ms). These integrated signals, representing spiking activity, were used as input to the Hilbert transform (using the Matlab hilbert command). Subtracting the cellular phase vector from the network phase vector gave the instantaneous phase difference and from this data, we quantified the mean phase difference as well as its variance. Thus, a negative phase difference implied that the cell was firing before the network, while a positive phase difference represented the opposite. Variance quantified how tightly the neuron was firing within a particular phase of the network oscillation.
A network burst-triggered raster plot was produced by using the previously described technique in van Drongelen et al. (2003). Briefly, a threshold applied to the integrated network signal (Fig. 1A – 1, bottom trace) was used as trigger for averaging ten network bursts and aligning the associated spike rasters. The threshold used for triggering the network burst was determined visually in each recording and placed just above the noise level. The phase of the network burst was scaled between 0–1 with the burst threshold arbitrarily set at a phase of 0.3. For each recording, the instantaneous frequency of the first spike, the phase of the first spike, the maximum instantaneous frequency, and the number of spikes per network burst were measured.
Statistical Analysis
To determine statistical differences between oscillations which occur at different holding currents and in different drug conditions, a three level hierarchical statistical model (Bryk and Raudenbush, 1992) was used to fit oscillation amplitude, duration, and frequency using STATA (StataCorp LP, College Station, TX). With this model we evaluated the relationships between the oscillation parameters (the dependent variable - duration, amplitude, frequency) and drug condition plus current level (the independent variables). The linearity of the relationship between the oscillation parameter and current level was evaluated by including the appropriate higher order polynomial characterizing current level. The restricted maximum likelihood (REML) method was used to estimate the model coefficients that best account for the measured variability in oscillation amplitude, duration, and frequency. A series of linear models were then generated from the simplest null model (including no independent variables) to increasingly complex models (including many independent variables and correlations among measurements) (Hox, 1995). The criterion used to select the statistical model that best fit the data was the Bayesian information criterion (Schwarz, 1978). Each of these models (frequency, amplitude, and duration model) examines whether oscillation changes as a function of current injection, drug condition, or an interaction between drug and current injection (the fixed effects) as compared to the reference condition (i.e. the oscillation in 10 μM NMDA+1.5 μM TTX at a current injection of 0 nA). The model also investigated how much of the variability in the data was accounted for by looking at correlations within cells and drug conditions (the random effects). For some parameters, the best fitting model only contained a few of the above mentioned independent variables, while other parameters used all of these independent variables. The statistical significance of the fixed effects was evaluated by z statistics which test the Null hypothesis of no effect of the drug condition and current injection on the oscillation parameter. The statistical significance of the random effects was evaluated by the Likelihood Ratio statistic which tested the Null hypothesis of no oscillation parameter variability associated with the random variable. The likelihood for a given model was the joint probability of the observed outcomes given the model parameters.
In direct comparisons of measurement pairs, statistical significance was determined using a student’s t-test and p values below 0.05 were considered significant. Data are represented as the mean ± standard error of the mean (SEM). Basic statistics were computed with Matlab or Microsoft Excel.
Computational Model
We integrated our findings on the role of the NMDA receptor conductance in oscillatory behavior, the response to square wave input, and the whole-cell I – V relationship in a computational model of pyramidal cell excitability. The excitability of layer V pyramidal neurons was simulated by a two compartment model: a soma and a dendrite. Each compartment was represented by a passive neuronal membrane modeled as an RC circuit plus additional conductances modeled by variable resistors and batteries that represent the electrochemical driving force for each ion species. This circuit was described by , where C and V represent the membrane capacitance and potential for each compartment, in represented the membrane current for ion channel n, IC represented the current from the neighboring compartment, and Iinj is the injected current. The current for each ion channel was expressed as in = Gn (V − En), where Gn represented the channel conductance and En the reversal potential. Voltage-gated conductances were treated in the Hodgkin-Huxley fashion (Hodgkin and Huxley, 1952): Gn = Gmax mx hy. Here, Gmax was the maximum conductance and the variable m represented probability of activation; while h represented the probability of not being inactivated; exponents x and y are adapted for each ion species. These were modeled by the equations: and , where τm and τh are membrane potential-dependent time constants, m∞ and h∞ are the steady state activations (also a function of membrane potential V). The Hodgkin-Huxley-like conductances in this model included the delayed-rectified potassium current ( IK–dr), the slowly activated potassium current (IK–S), the fast sodium current (INa–f), and the persistent sodium current (INa–p). Details of constants and channel dynamics are based on Golomb and Amitai (1997) and Traub et al. (2003) and are summarized in Tables 1 and 2. Voltage-sensitive calcium channels were not included because of their minimal involvement in oscillation as revealed by experimental data.
Table 1.
Parameters used in the compartmental model.
| Constant | Soma | Dendrite |
|---|---|---|
|
| ||
| IK – dr | ||
| Gmax (S*m−2) | 800 | 440 |
| E (mV) | −82 | −82 |
|
| ||
| IK – S | ||
| Gmax (*m−2) | 4 | 1.5 |
| E (mV) | −82 | −82 |
|
| ||
| INa – f | ||
| Gmax (S*m−2) | 740 | 80 |
| E (mV) | 55 | 55 |
|
| ||
| INa – p | ||
| Gmax (S*m−2) | 0.315 | 0.15 |
| E (mV) | 55 | 55 |
|
| ||
| IL | 1/ | 1/ |
| Gmax (S*m−2) | Rm | Rm |
| E (mV) | −70 | −70 |
|
| ||
| IK – Na/Ca | ||
| Gmax | 0.3 | 0.7 |
| E (mV) | −70 | −70 |
| γ | 0.02 | 0.02 |
Table 2.
The model’s gating parameters and their voltage-dependence. The dynamics are based on Golomb and Amitai (1997) and Traub et al. (2003).
| Conductance | Gating | x∞ | τx(ms) | ||
|---|---|---|---|---|---|
| IK – dr | m4 |
|
|
||
| IK–S | m4 |
|
75 | ||
| INa–f | m3 |
|
if V < 26.5 else |
||
| h |
|
|
|||
| INa–p | m |
|
if V < −40 else |
The cation-activated potassium current ( IK–Na/Ca), leak current (IL), and the NMDA current (INMDA) were represented in a different fashion. For the IK–Na/Ca channel, the conductance was directly proportional to the cation concentration: GK–Na/Ca = Gmaxγ [Cat].
Here γ is a constant and [Cat] the cation concentration. The cation concentration for each compartment was determined by the differential equation: , where τCat is the time constant representing the chelation by various buffers, and B is a constant factor multiplied by ICat (the current carrying sodium and calcium ions). The INMDA conductance was determined by the following equations:
where the maximum conductance Gmax was multiplied by the proportion of channels blocked by magnesium represented by sigmoid function MgB(V ), a voltage dependent process; S, L and k were constants which shape the voltage dependence of magnesium block. The values for these constants were taken from Jahr and Stevens (1990) and Huss et al. (2008). A constant level of NMDA receptors was bound to glutamate to mimic tonic activation of the NMDA current. This intrinsic component was modeled based on the high affinity of these receptors for glutamate. One can estimate that 30–50% of NMDA receptors are bound at ambient concentrations (Sah et al., 1989; Ashcroft, 2000). In addition, the magnesium blocking dynamics were assumed to be instantaneous in relation to the other dynamics of the model. See Table 1 for a summary of the constants for these channels.
The current from the neighboring compartment was represented by , where V′ was the membrane voltage of the neighboring compartment, Ra was the axial resistance of the current compartment and Ra′ was the axial resistance of the neighboring compartment. We used Matlab for all simulations.
Results
Voltage-dependence of the NMDAR is critical for producing a saddle node bifurcation governing oscillatory behavior
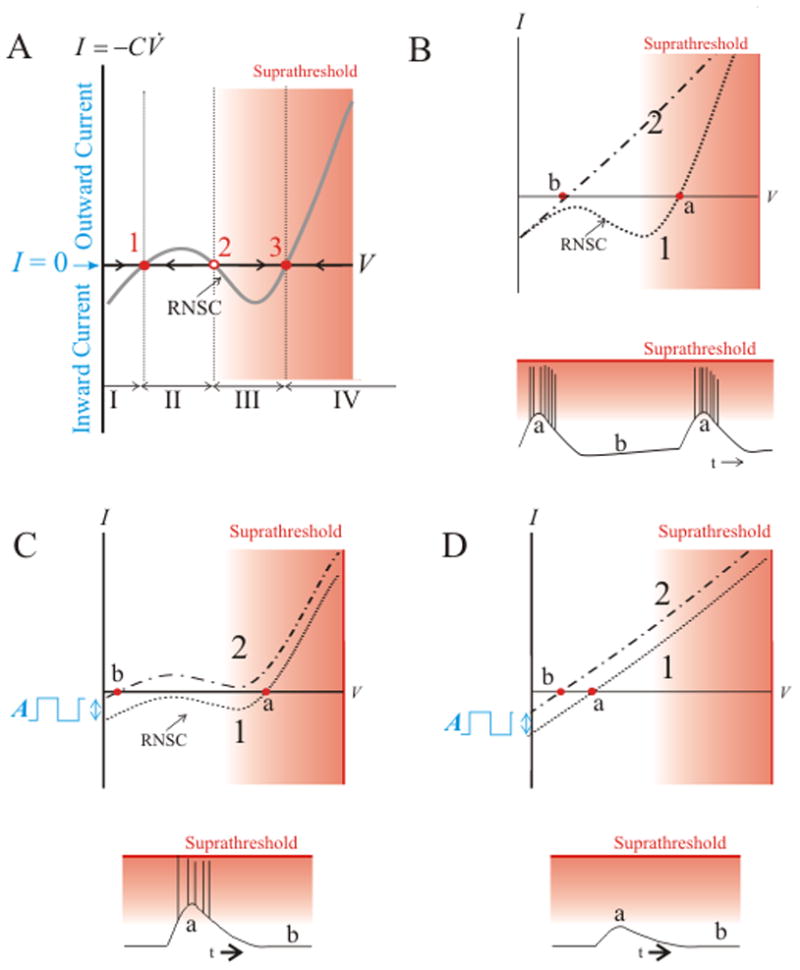
Our study defined experimentally testable predictions using the theory of nonlinear dynamics. We described a neuron’s behavior by evaluating its phase portrait in the V̇ – V plane (V is membrane potential and V̇ is the change of the potential over time, its derivative). Since the membrane current of all ion species I is proportional to V̇, the whole-cell I – V curve is a proxy for the neuron’s V̇ – V relationship (Gola, 1974; Izhikevich, 2007). Examining subthreshold properties, the system can be simplified by considering the I – V relationship while the fast sodium conductivity is disabled (Fig. 2A). A significant component of the I – V relationship is linear (determined by Ohm’s law), but regenerative properties of voltage-sensitive receptors can create regions of negative slope conductance (RNSC) (Schmidt et al., 1998). In particular, the voltage-dependence of the NMDA receptor due to Mg-blockade is ideal for creating this region of nonlinearity near the resting membrane potential which can generate up to three equilibria associated with zero current (I = 0) (1–3 in Fig. 2A), where the middle equilibrium (2, Fig. 2A) is unstable. As the shape of the curve or the vertical position changes, bifurcation of the system can alter neuronal behavior (Gola, 1974; MacLean and Schmidt, 2001; Izhikevich, 2007). For example (Fig. 2B, C), one equilibrium may vanish and the system will necessarily jump to the other equilibrium. In the terminology of nonlinear dynamics, the equilibrium is destroyed via a saddle node bifurcation (Strogatz, 1994). An intact neuron going through such a saddle node bifurcation will become suddenly active when the equilibrium in the sub-threshold region is destroyed and the cell jumps to a position in the suprathreshold domain; resetting the phase portrait may reinstate the subthreshold equilibrium and, consequently, the cell will become quiet again (Fig. 2B, C). The behavior where the cell jumps across states is associated with a strong nonlinear I – V relationship; in the alternative case, when the I – V curve is (almost) linear, changes are smaller and gradual (Fig. 2D). From this analysis, we hypothesized that a saddle node bifurcation is responsible for NMDA-dependent neuronal burst generation, predicting that activation of NMDARs (i) can generate oscillation (detailed in Fig. 2B), (ii) amplify input or fluctuations in the membrane potential (detailed in Fig. 2C), and (iii) these properties are associated with a RNSC in the I – V curve dependent on magnesium block.
Two responses to NMDA exist in morphologically and functionally distinct layer V pyramidal cell populations
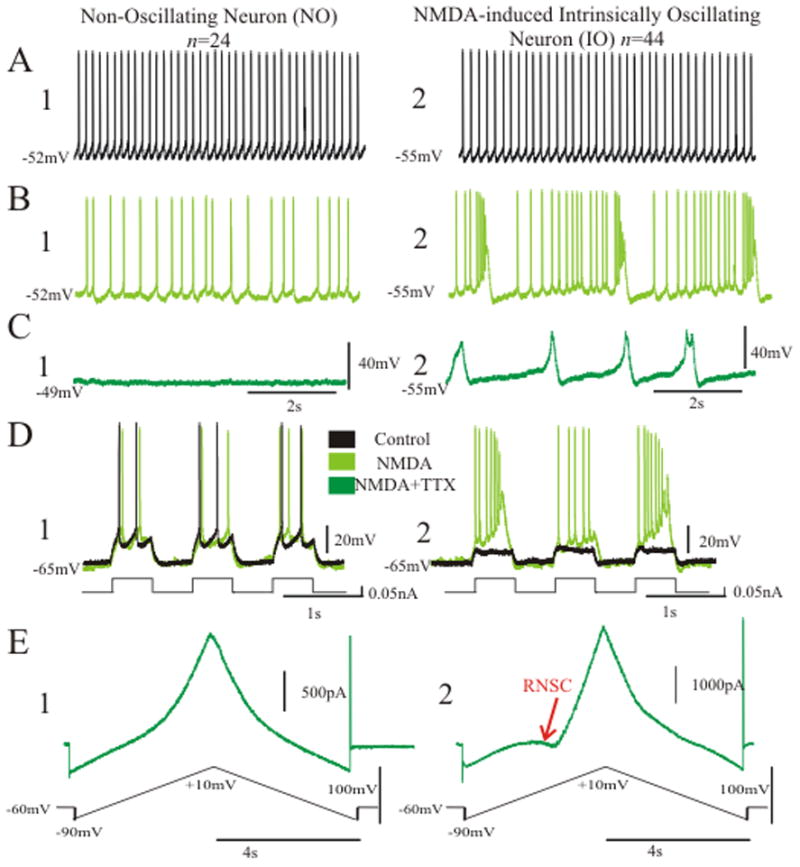
To validate the above hypotheses and relate intrinsic firing patterns to the shape of the whole cell I–V curve, we recorded current- and voltage-clamp behavior in 68 layer V pyramidal neurons from mouse cortex in vitro. Neurons responded to NMDA (10 μM, bath applied) in one of two ways. One population of cells exhibited NMDA-induced intrinsic oscillatory activity (IO neurons, n=44), while a smaller percentage of neurons displayed non-oscillatory activity (NO neurons, n=24). Both neuron types exhibited regular spiking characteristics in control (Fig. 3A); however, only IO neurons responded to NMDA with recurrent bursts or oscillations whose frequency, amplitude, and duration were voltage-dependent (Fig. 3B, Fig. 5A). These oscillations continued with the addition of TTX (Fig. 3C); and in some neurons, the oscillations were only clearly revealed after the addition of TTX (n=21/44). Notably, the presence or absence of oscillation was associated with the shape of the whole-cell I–V curve; IO neurons exhibited a region of negative slope conductance (RNSC) in the steady-state whole-cell I–V curve (n=23/23), while NO neurons did not have this nonlinearity (n=12/12) (Fig. 3E). The RNSC observed in IO neurons reflected a significantly greater amount of NMDA-induced inward current compared to NO neurons (23.24±1.53% vs. 10.56±1.50%, p<0.001, unpaired, directional t-test). In addition, the RNSC in IO neurons was associated with an amplified response to square wave input compared to NO neurons (p<0.001, unpaired directional t-test, for all amplitudes from 0.02 through 0.2 nA; n=31 IO; n=14 NO; Fig. 3D). These data suggest that NMDAR activation induces a bifurcation in the cellular system of a specific subset of layer V pyramidal neurons, whereby the cell jumps between two stable membrane potentials, producing intrinsic oscillation as well as amplifying responses to input.
The type of oscillatory behavior obtained in response to NMDA was correlated with distinct morphological features and spiking characteristics in layer V neurons. We examined the soma size, tuft width, apical dendrite width, distance of the cell body to the pia, and the dendritic arborization around the soma in 10 IO neurons and 7 NO neurons injected with biocytin during recording and processed with a fluorescent protocol after fixation. Both the soma diameter and width of the apical dendrite were significantly wider in IO neurons compared to NO neurons (11.10 ± 0.37 μm and 2.59±0.33 μm, n=10 vs. 9.77±0.50 μm and 1.70±0.29 μm, n=7 respectively; p < 0.05, unpaired, non-directional t-test) (Fig. 4A–B). The other variables were not significantly different between the two neuron types including whether there was a bifurcation in the apical dendrite (2/10 IO neurons; 2/7 NO neurons), the distance between the soma and the pia (p = 0.20; IO 344.79±16.32 μm; NO 374.23±29.10 μm), the tuft width (p = 0.19; IO 105.30.10±11.06 μm; NO 69.55±33.42 μm), the length of the apical dendrite to the first branch (p = 0.25; IO 193.04±17.77 μm; NO 164.12±36.21 μm), the total length of the apical dendrite (p = 0.17; IO 278.97±26.61 μm; NO 215.30±56.41 μm), and the dendritic area surrounding the soma (p=0.14; IO 9186.6±733.5 arbitrary units; NO 7255.9±1492.1 arbitrary units) (unpaired, non-directional t-test for all).
Previous studies have reported similar morphological distinctions in layer V pyramidal neurons with corresponding differences in spike attributes (Kasper et al., 1994; Molnár and Cheung, 2006; Hattox and Nelson, 2007). Thus, we closely examined the one second spike train responses of all IO and NO neurons for several levels of current injection in control aCSF. Neurons of the IO population revealed wider action potentials (half width = 2.94 ± 0.7 msec vs. 2.37 ± 0.19 msec, p < 0.05, unpaired, non-directional t-test) and a greater spike adaption rate (62.33 ± 1.91 % vs. 54.03 ± 3.00%, p < 0.01, unpaired, non-directional t-test) (Fig. 4C–D) compared to NO neurons, while both populations exhibited gradual increases in spike frequency with increasing current injection (Fig. 4E). There was no difference found for the first or last instantaneous firing frequency, or the amplitude of the sag current reflective of the IH channel. Our findings are consistent with previous reports but also extend these functional-morphological population distinctions to include differential responses to NMDA receptor activation.
The voltage-dependence of the NMDAR is critical for oscillation while other Ca++, Na+, and K+ channels help shape IO behavior
To further investigate the underlying mechanisms of the oscillatory properties, we examined qualitative (Fig. 5) and quantitative (Fig. 6) aspects of the IO cell type function in different bath conditions (see Materials and Methods, Experiments). The relationships plotted in Fig. 6A reflect the oscillation parameters (amplitude, duration, frequency) as a function of injected current across different bath conditions; these functions were determined from the data with the hierarchical statistical model (see Materials and Methods). The oscillation frequency was dependent only on the level of current injection (Fig. 6A, Table 3) and will not be further included in the description below.
Figure 6.

Table 3.
Coefficients of the best fit three-level linear hierarchical models for oscillation amplitude, duration, and frequency (= 1/interburst interval). X= no coefficient for that term. Coefficients are given as mean +/− standard error. Highlight signifies significant relationship.
| Independent Variable | Condition | Amplitude (mV) | Duration (msec) | Frequency (Hz) |
|---|---|---|---|---|
| D1 | NMDA+TTX+NIFEDIPINE | −11.87 +/− 1.75 | 105.11 +/− 29.71 | x |
| D2 | NMDA | −9.87 +/− 1.69 | −10.03 +/− 28.34 | x |
| D3 | NMDA+TTX+MIBEFRADIL | −1.21 +/− 2.13 | −3.72 +/−34.96 | x |
| C | CURRENT | −12.29 +/− 1.83 | −54.18 +/− 16.14 | 1.237 +/− 0.194 |
| D1C | NMDA+TTX+NIFEDIPINE *CURRENT | −4.28 +/− 3.16 | 13.31 +/− 30.13 | x |
| D2C | NMDA*CURRENT | 8.66 +/− 3.08 | 99.89 +/− 29.71 | x |
| D3C | NMDA+TTX+MIBEFRADIL *CURRENT | 1.04 +/− 3.65 | 4.05 +/− 31.41 | x |
| C2 | CURRENT^2 | 0.60 +/−0.90 | x | x |
| D1C2 | NMDA+TTX+NIFEDIPINE *CURRENT^2 | −3.79 +/− 1.63 | x | x |
| D2C2 | NMDA*CURRENT^2 | 0.47 +/− 1.75 | x | x |
| D3C2 | NMDA+TTX+MIBEFRADIL *CURRENT^2 | 0.11 +/− 1.80 | x | x |
| - | Constant | 39.20 +/−1.82 | 223.09 +/− 27.11 | 0.720 +/− 0.239 |
Effect of CPP
Blockade of NMDAR with 20 μM CPP blocked NMDA-induced oscillatory behavior (n=14). Oscillations disappeared at membrane potentials of −80 through −30 mV in NMDA+TTX+CPP (CPP). The response to square wave input returned to baseline levels (n = 8; p<0.001 for all amplitudes, paired, directional t-test). The normalized response at 0.02 nA is plotted in Fig. 6C; the CPP response was reduced to 0.08±0.03 times that of the NMDA+TTX response (p<0.001, paired, directional t-test). Inward current of the whole cell I – V curve obtained in CPP was also reduced by 21.37±1.65% compared to NMDA+TTX data resulting in a linear current voltage relation (p<0.05, paired, directional t-test) (Fig. 6D - red).
Role of Magnesium
Changing the linearity of the NMDA receptor from nonlinear (in 1 mM Mg2+) to (almost) linear (in nominally 0 mM Mg2+) eliminated NMDA-induced IO behavior (n = 11) (0MG, Figs. 5, 6). Experiments in 0MG were performed in two ways (Materials and Methods) and both approaches elicited loss of IO behavior without significant differences, thus they were grouped together in the following analysis.
Oscillation was eliminated in 0MG (Fig. 5A, blue). Holding currents to obtain potentials between −80 mV and −30 mV were applied and no oscillation was found after wash out of Mg2+. Finally, in a few cases, we added 20 μM CPP in 0MG and as expected, the loss of oscillation remained (n = 3) (Fig. 5A, red).
The response to square wave input returned to baseline values in nominally 0MG(n = 9) (Figs. 5B, 6B). The response to input with a current amplitude of 0.02 nA is −0.11±0.07 times that of the NMDA+TTX response (p<0.001, paired, directional t-test) (Fig. 6C- blue).
In all 11 cases, an almost linear I – V relationship was obtained in 0MG (Fig. 5C, blue). The change in inward current relative to the holding current at −60 mV was reduced by 33.54±3.48% when compared to NMDA+TTX data (p<0.001, paired, directional t-test) (Fig. 6D- blue).
Effect of TTX
In neurons that exhibited oscillatory behavior in 10 μM NMDA alone, addition of 1.5 μM TTX did not abolish oscillation; examples are shown in Figs. 3 and 4. In a comparison (n = 10), oscillation amplitude in NMDA at zero current injection was 9.9 mV smaller than the amplitude in NMDA+TTX (p < 0.001, linear hierarchical model). The duration of the bursts in the oscillation was not significantly different at 0.0 nA current between NMDA and NMDA+TTX; however, the change in duration with current injection was significantly different between these two conditions (Fig. 6A- light green vs green). The change of duration in NMDA increased with injected current, while all other drug conditions showed a decrease of the duration for current increase (p < 0.001, linear hierarchical model) (Fig. 6A- light green).
The response to square waves while the cell was held at −65 mV showed amplification both in NMDA and NMDA+TTX (Fig. 5B- light green and green). In both conditions, the cell’s response increased (compared to the response in aCSF without additions). For current amplitudes of 0.07–0.2 nA amplification was significantly greater in NMDA+TTX (n = 15, p < 0.001, paired, non-directional t-test) (Fig. 6B- green). The response to NMDA at these currents was most likely reduced due to the effect of the spike after-hyperpolarization and/or inhibitory network input.
Analysis of the whole cell I – V relationship (n = 11) also revealed similarities between both conditions. The I – V relationships in NMDA had a RNSC associated with the presence of oscillation in current clamp and this behavior remained with the addition of TTX (Fig. 5C- light green to green). Quantification of these curves revealed a small, non-significant change in inward current of 15.68 ±3.36% between NMDA+TTX compared to NMDA (Fig. 6D- light green).
Effect of Nifedipine
The role of L-type calcium channels in IO behavior was examined by blocking the conductance with 10 μM Nifedipine (NIF, Figs. 5, 6). Nifedipine blocked oscillation only in one out of ten neurons. In the remaining nine cells, at 0 nA current injection, oscillation amplitude was reduced by 11.9 mV in NIF compared to NMDA+TTX (p < 0.001, linear hierarchical model), while the inverse relationship between current injection and amplitude remained (Fig. 6A). Duration was significantly increased by 105 ms at baseline (0 nA) in NIF compared to NMDA+TTX (p < 0.001, linear hierarchical model); the change in duration with current was the same when compared to NMDA+TTX (Fig. 6A- orange).
The response to all amplitudes of square wave current injection in NMDA+TTX compared to NIF was not significantly different (n = 7), (Figs. 5B, 6B- orange). Both drug conditions amplified the current step compared to control.
The whole cell I – V curve retained the RNSC in the NIF condition correlated with the presence of oscillation (n = 10) (Fig. 5C- orange). Quantification of the change in inward current between NIF and NMDA+TTX revealed no significant difference (Fig. 6D- orange).
Effect of Mibefradil
We employed 5 μM Mibefradil (MIB) to gauge differences in IO behavior associated with block of R and T-type calcium channels (n = 7). In contrast to the L-type calcium channel, R and T-type channels did not affect any of the quantified oscillatory properties. Amplitude and duration of oscillation were not significantly different between NMDA+TTX and MIB (Fig. 6A- pink, Table 3).
The reaction to square wave input in both conditions (NMDA+TTX and MIB) augmented the response compared to aCSF without these additions (n = 7). However, for most current injections (except for those at 0.1 and 0.125 nA) the response was slightly increased in MIB compared to NMDA+TTX (p < 0.05) (Fig. 6C- pink). MIB intensified the response by 1.29 ± 0.16 times that of the NMDA+TTX response (p < 0.05, paired, non-directional t-test).
Voltage clamp behavior of these conditions again fortified the relation between RNSC in the I – V curve and oscillation (n = 5). The change in inward current between MIB and NMDA+TTX was not significant, indicating similar behavior (Fig. 6D- pink).
The Role of Potassium
Although we examined the role of NMDAR in burst onset, we conducted a limited set of experiments to investigate the role of voltage-sensitive and calcium dependent potassium conductance in terminating the burst to support our computational modeling effort. When extracellular calcium was reduced to 0 mM, an increased burst duration was observed (n = 4). Furthermore, in 5 mM TEA + 0 mM calcium, oscillation was terminated (in 4 out of 6 cases) or bursts significantly prolonged (in 2 out of 6 cases). Therefore, we included cation-dependent and voltage-dependent potassium channels in the computational model (see Material and methods, Computational Model).
Statistical modeling of oscillation
To quantitatively assess how oscillation changed with current injection and with drug application we measured three parameters in this study- amplitude, duration, and frequency of oscillation (see Material and Methods, Statistical Analysis). We used cells with completed sets of repeated measurements across several drug conditions to perform a statistical study (n=21). A series of models were generated from the simplest Null model (including no independent variables) to increasingly complex models including many independent variables and correlations among measurements (Hox, 1995).
The fixed component of each model described how different drug conditions and current injections affected oscillation compared to the reference condition (10 μM NMDA + 1.5 μM TTX). The results for the three oscillation parameters measured were:
where D1–D3 referred to different drug conditions (D1= 10 μM NMDA + 1.5 μM TTX + 10 μM Nifedipine, D2= 10 μM NMDA, D3= 10 μM NMDA + 1.5 μM TTX + 5 μM Mibefradil), and C referred to current level coded as a continuous independent variable. The interaction terms, CD1, CD2, etc, evaluated whether current level effects differ depending on drug condition. The coefficients of these independent variables (D1-3, C, etc) along with their associated standard error and condition are shown in Table 3. Significant relationships are highlighted.
Computational model of NMDA-induced oscillation
We next integrated our experimental findings into a computational model in order to simulate the direct dependence of IO neurons’ activity upon the NMDAR’s nonlinear voltage-dependence. With IL, IK-dr, IK-S, INa-f, and INa-p, the model generated type I spiking behavior (Hodgkin, 1948), similar to the baseline behavior of layer V pyramidal neurons (Fig. 7Ai). With addition of an intrinsic NMDA channel and a potassium channel dependent on the cation concentration (IK-Na/Ca), current injection produced periodic oscillations that increased in frequency with depolarizing current injection (Fig. 7Aii, Aiii, B). The model oscillations remained with blockade of the sodium channels (Fig. 7Aiv), while they disappeared when the magnesium concentration was reduced to 0 mM (Fig. 7Av). As in the experiments, the model also showed amplification of the response to square wave input compared to baseline (Fig. 7C).
Figure 7.
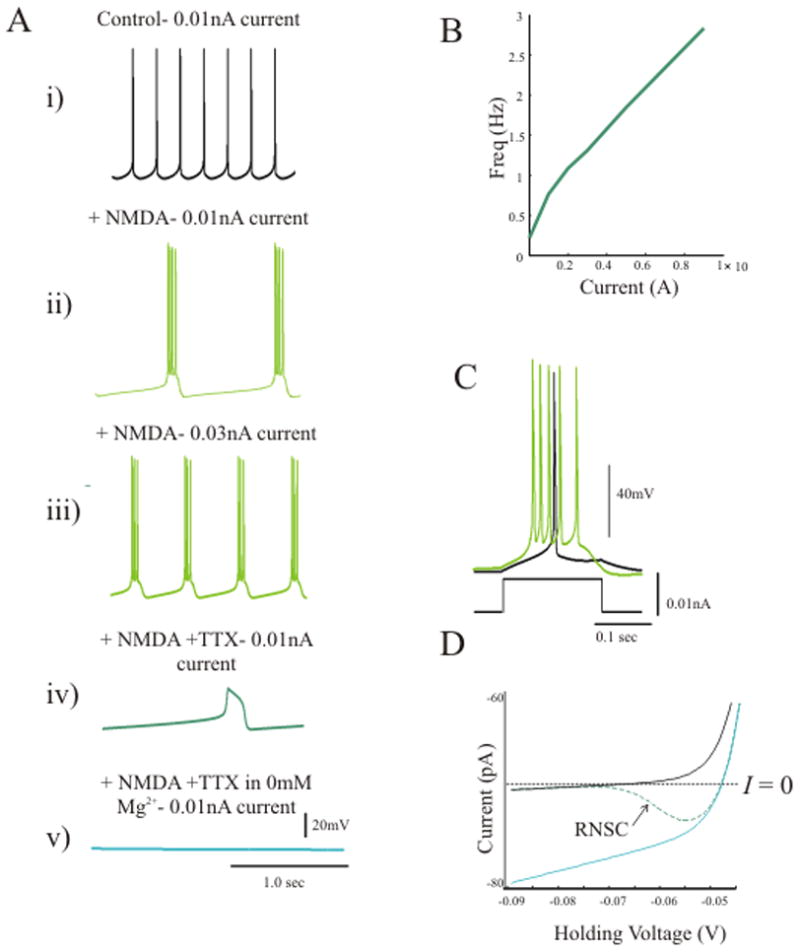
Steady state voltage clamp analysis with sodium channel blockade, to disable action potential generation and mimic the experimental situation, revealed the presence of a RNSC in the I – V curve associated with the same parameters that produce oscillation in current clamp. Without NMDARs or in 0 mM Mg2+, there was no RNSC in the I – V relationship and no oscillation (Fig. 7D). Thus, activation of a voltage-dependent NMDAR conductance generated oscillation as well as an amplified response to square wave input and this behavior was associated with a RNSC in the model’s I – V curve.
Relationship between cellular and network oscillations
NMDA-induced oscillatory activities were experimentally obtained across cellular and network levels by simultaneously recording extracellularly from layer V within 150 μm of the intracellular electrode (n=26) (Fig. 8A). The NO-type (n=9) and IO-type (n=10) neurons demonstrated differences in their phase and frequency relationships with concurrent network oscillation elicited with NMDA application at normal magnesium levels. Network burst triggered raster plots show that initial spiking activity was more probable early and at the start of the network burst in IO neurons as compared to NO neurons (phase of first IO spike =0.24±0.01; NO spike 0.33±0.01, p<0.001, unpaired directional t-test) (Fig 8B, C). The instantaneous frequency of the first spike in the burst, the maximum spike frequency, and the number of spikes per burst were all greater in IO neurons compared to NO neurons (17.85±0.83 Hz vs. 11.34±1.28 Hz; 28.09±1.19 Hz vs. 18.14±2.66 Hz; 7.07±0.33 spikes vs. 3.68±0.24 spikes; p<0.001, unpaired directional t-test, for all metrics, Fig. 8C3–C5). In addition, the variance in the distribution of phase differences was significantly smaller for the IO neurons (0.34±0.07 rad2 vs. 0.80±0.21 rad2, p<0.05, unpaired directional t-test, Fig. 8D3). Frequency synchronization of IO and NO neurons with the network was not significantly different, and in both cell types cellular and network spectra showed a considerable percentage of overlap (IO: 69.04±3.97% and NO: 59.05±5.74%, Fig. 7E).
Figure 8.
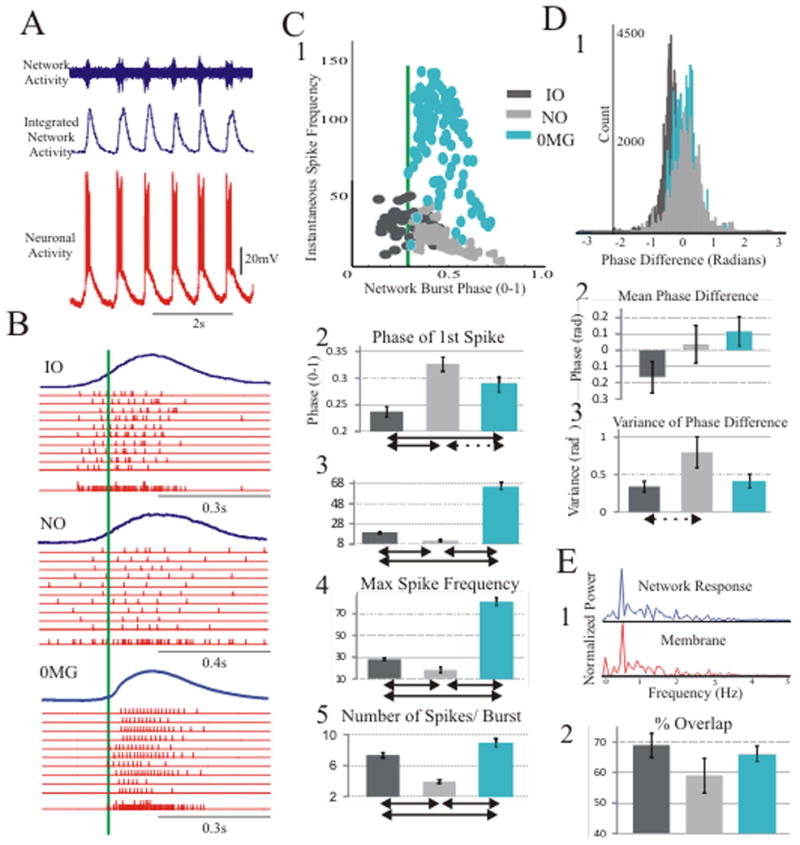
To assess the contribution of the NMDAR’s voltage dependency, we also evoked oscillations in the absence of magnesium (0MG) (n=7) and compared the neuron-to-network relationship to the IO and NO relationships in normal Mg++ levels reported above. In the 0MG condition, neurons fired at higher frequencies compared to either IO or NO neurons (maximum frequency of 80.43±4.51 Hz vs. 28.09±1.19 Hz for IO and 18.14±2.66 Hz for NO; in both cases p<0.001, unpaired non-directional t-test), and these high-frequency spikes occurred during peak network activation (Fig. 8B, C). The mean phase of the first spike in 0MG was 0.29, close to the network burst threshold (set at 0.3), and significantly later than the mean phase of the first spike for IO neurons (p<0.001, unpaired non-directional t-test) (Fig. 8C2). Our results revealed similar frequency synchronization in 0MG compared to normal magnesium conditions (Fig. 8E2).
Discussion
Here we demonstrate that the voltage-dependence of the NMDA receptor directly affects both intrinsic cellular behavior as well as cell-to-network interactions during network oscillations. We conclude that the NMDA-induced intrinsic oscillations in the IO subset of layer V pyramidal neurons are primarily reliant on the voltage-dependent block of the pore by magnesium ions (Figs. 5–7). In both our experimental and computational models, this voltage dependence produces a RNSC in the whole cell I–V curve, causing a bifurcation in the system associated with amplification of input and intrinsic oscillation (Figs. 5–7); all of these behaviors are abolished with removal of magnesium from the bath and the associated loss of voltage dependence of the NMDA channel (Figs. 5–7). These results are consistent with the “intrinsic” role of the voltage-dependent NMDA receptor found in many other experimental paradigms including the oscillations in spinal cord (Schmidt et al., 1998) and the nonlinear amplification of dendritic synaptic input in the cortex (Schiller and Schiller, 2001).
With normal magnesium concentrations, there are two responses to activation of the NMDA receptor in morphologically distinct layer V neurons: a subset of neurons that exhibit intrinsic oscillations due to the effect of the NMDA channel’s voltage-dependence on cellular stability and a subset without oscillations (IO and NO neurons respectively, Fig. 3). These two classes of layer V pyramidal neurons, determined by the oscillatory response to NMDA, correlate with significant differences in morphology and spiking characteristics, with IO neurons possessing larger somata, wider apical dendrites, wider action potentials, and a greater spike adaptation rate (Fig. 4). We did not find differences in the tuft width, distance between the soma and the pia, apical dendritic length, distance between the soma and the first dendritic branch, dendritic area, first or last instantaneous firing frequency, or the amplitude of the sag current reflective of the IH channel between the IO and NO cell types.
The characteristics we found for IO and NO cell types are similar to those previously published for type I and II pyramidal cells in cortical layer V. In rat visual cortex, type I neurons project to the superior colliculus, spinal cord, and basal pons, usually have thick apical dendrites with more branching, and possess a wider soma with a terminal tuft in cortical layer I. In contrast, type II neurons project to the contralateral hemisphere or the ipsilateral striatum and have thin apical dendrites without a terminal tuft (Kasper et al., 1994; Molnár and Cheung, 2006). Similar morphology and projection patterns have been found in rat auditory, motor, and somatosensory cortices (Games and Winter, 1988; Chagnac-Amitai et al., 1990; Gao and Zheng, 2004) as well as in mouse (Mitchell and Macklis, 2005; Spires et al., 2005) and cat cortices (Deschenes et al., 1979). Loss of the terminal tuft in type II neurons occurs with development in rat around P5-7, while in mouse, this transformation may occur later or not at all (Molnár and Cheung, 2006; Spires et al., 2005). Functionally, type I neurons are associated with burst firing while type II neurons do not fire bursts in adult rat cortex (Chagnac-Amitai et al., 1990; Kasper et al., 1994). However, the exact firing pattern found in type I neurons may vary depending on the species and experimental paradigm. Type I neurons in rat cortex do not fire bursts until after the second postnatal week (Kasper et al., 1994), while in mouse association cortex the existence of type I bursting is dependent on the amount of anesthesia used (Christophe et al., 2005), and in another study of mouse somatosensory cortex, type I neurons fire an initial doublet instead of a burst (Hattox and Nelson, 2007). Overall, these data suggest that type I neurons may be more likely to amplify input under the right conditions (bursting or doublets) compared to type II neurons, which generally have a regular spiking pattern across species. Our data reveal similar findings. Corresponding to type I neurons, IO neurons have a thicker apical dendrite and a wider soma while firing bursts in the presence of NMDA, while NO neurons share similarity to type II neurons and have a thin apical dendrite, a smaller soma, and do not produce intrinsic oscillation or bursts in the presence of NMDA.
The distinctions between type I and type II neurons are thought to be more applicable to layer Vb of the cortex. Recent data in rat somatosensory cortex suggests that there are differences between the pyramidal neurons of layer Va and Vb in both morphology, functional behavior, and intracortical connectivity (Schubert et al., 2006). To evaluate this aspect, we did compare the distance from the soma to the pia in our layer V neurons to address whether our results could be correlated with a difference in laminar distribution, but these results were not significant, implying that IO and NO neurons are likely related to type I vs type II neurons but may not be in different sublayers of layer V.
An important question is why do IO and NO neurons respond differently to NMDA? It is always possible that these differences are an artificial phenomenon associated with the slice model. Perhaps the angle or cut of the slice simply reduced the number of dendritic branches for some neurons compared to others resulting in fewer synapses with functional NMDA receptors. Another alternative explanation is that these neurons represent different stages of neuronal development. Although these alternative explanations are possible, the morphological and functional data mentioned above in correlation with the established presence of type I and II layer V neurons in the literature provides evidence that the IO and NO types are truly two distinct physiological populations. Based on this assumption there could be different numbers of NMDA channels or different subunits forming the channels in these populations changing the total current or sensitivity to magnesium block (Raol et al., 2001). Adaption rate and action potential width (Fig. 4) are critically affected by potassium channels, implying that the IO and NO neurons may have different levels and/or types of potassium channels controlling spike output as well as contributing to bursts/oscillation (Kang et al., 2000). Furthermore dendritic structure in and of itself can change the firing pattern of a neuron and should be further studied in these two populations (Mainen and Sejnowski, 1996).
Through pharmacological manipulation, we investigated the role of other conductances including the persistent sodium channel, the L-type calcium channel, and the T-type and R-type calcium channels in production of oscillation. The persistent sodium and L-type calcium channel specifically were found to contribute to the duration and amplitude of the NMDA-induced intrinsic oscillation (Figs. 5–6, Table 3). These results are not surprising given the well-known role of these channels in shaping burst structure (D’Angelo et al., 2001; Mrejeru et al., 2011), but in the IO neurons they are not required to produce oscillation. We chose to block calcium channels directly with specific antagonists rather than using cadmium as a broad range calcium channel blocker due to its possible direct inhibitory action on the NMDA receptor (Mayer et al., 1989; Glitsch, 2008). The Ih current was not examined in our experiments and could be important in changing some aspects of the burst shape. However, the Ih current is predominately activated between −70 to −140 mV whereas our intrinsic oscillations often occurred at more depolarized potentials (Chu and Zhen, 2010). Our data do suggest that potassium currents contribute to burst offset, however more detailed experiments are needed to determine the type of channel and its interaction with the NMDAR current. In summary our pharmacological experiments show it is the voltage dependence of the NMDAR itself that is necessary for burst onset, while other channels play a secondary role in shaping the oscillation.
At the network level, our simultaneous intra- and extracellular recordings imply that the NMDA-induced intrinsic oscillations in IO neurons may drive network bursting in the neocortical network. The large spectral overlap between cellular and network oscillations in normal and low Mg2+ conditions is characteristic for 1:1 frequency synchrony (Fig. 8E), indicating that there is a strong linear component in the coupling across the cellular-network levels. Most importantly, a significant amount of IO neuronal spiking and activity is early in the burst or even prior to network burst onset suggesting that these neurons may be acting as pacemakers to initiate oscillation in the neocortical microcircuit (Fig. 8B–D). This finding is congruent with the many studies suggesting a special role for neurons with nonlinear membrane behavior and network oscillation (van Drongelen et al., 2006; Takekawa et al., 2007; Purvis et al., 2007; Tohidi and Nadim, 2009). The NO neurons’ activity can be found throughout the burst, with a significant amount after the burst onset (Fig. 8B–D). A population of this cell type might therefore contribute to sustain oscillation without initiating individual bursts. This proposed NMDAR-driven mechanism may become especially relevant during pathological oscillations when excessive stimulation is present due to increased amounts of glutamate and/or increased receptor density (Sherwin et al., 1988; Frick et al., 2001).
Our data further show that loss of intrinsic oscillation, via removal of magnesium, actually switches the network to a different configuration; under this scenario, cells synchronously contribute at the onset of emergent network oscillation rather than as a bimodal distribution of leaders and followers (Fig. 8B–D). Thus in this state, the IO neurons do not lead the oscillation. This lack of consistent leaders corroborates earlier findings that the discharges during oscillation in a low Mg++ environment are generated by variable sources distributed throughout the network (Trevelyan et al., 2007). This difference between normal and low Mg++ network behavior suggests an important point-seizure/oscillation genesis can occur with very different mechanisms depending on the components of the network. In our data, the mechanism behind the production of network oscillation hinges critically upon the capability of NMDARs in inducing intrinsic versus synaptic effects. Correlating how these different mechanisms may participate in different pathologies underlying seizure genesis in particular will be an important step to further developing targeted therapies for the vast array of epilepsies.
Recent work in neocortical slices suggests that NMDAR function plays a role in focal pediatric epilepsy (Marcuccilli et al., 2010). Here we focused on mouse cortex early in development, but our findings for P8-12 mice may also apply to mature neurons as NMDAR development in cortex primarily entails a switch from the NR2B subunit to the NR2A subunit between ages P5-7 (Liu et al., 2004). However, the network structure of the age group in this study is different from adult circuitry. This is due to a surge of synaptogenesis that occurs during the second postnatal week in mice with a subsequent refinement of connectivity with age (White et al., 1997). In this context, it is plausible that the increased connections of the younger brain could lower the threshold for network oscillation, which would align with the increased incidence of seizures and epilepsy in children (Kotsopoulos et al., 2002).
A key objective in epilepsy research is to characterize not only mechanisms behind seizure-like activity but also to distinguish between physiological and pathological oscillation. Our model of NMDA-induced oscillation can be argued to fit both categories. On one hand, it is estimated that 30–50% of NMDA receptors are bound in vivo due to the high affinity of these receptors for glutamate (Sah et al., 1989; Ashcroft, 2000); suggesting that prolonged bath application of NMDA in vitro may be mimicking some part of the physiological state in vivo. However, in our experiments we are activating the NMDAR above the physiological level (ambient glutamate is around 3μM (Lerma et al., 1986) and we applied 10μM NMDA), leading to increased excitatory activation as may be especially relevant to the propagation of seizure activity in structurally normal circuits when levels of glutamate are high (Sherwin, 1999). This situation may also apply to the pathology of networks with increased NMDAR expression such as focal cortical dysplasias (Ying et al, 1998; Spreafico et al, 1998; Crino et al, 2001). The 0MG model of oscillation can only be assigned to the pathologic state as there is no relevant physiological state in which magnesium concentrations drop to such low levels. In fact, the speed of propagation obtained in the 0MG model does share a similar pattern to the velocities found during recording of a Jacksonian march episode during human seizure activity and the patterns of electrical activity have been noted to resemble clonic discharges as well as spreading depression (Walther et al., 1986; Ohara et al., 2004; Trevelyan et al., 2006). Furthermore, it is known that traumatic brain injury and neurodegenerative disease are associated with reduced extracellular magnesium levels in the CSF and could be related to the increased propensity for seizure in these states (Nishizawa et al., 2007). Therefore, we conclude that both effects described in this work, one component due to high occupancy of the NMDAR by glutamate and another component due to low levels of Mg2+, may play a crucial role in generating and maintaining network oscillation during epileptic seizures.
Acknowledgments
We thank Drs. J.N. MacLean, P. Ulinski, and V.L. Towle for valuable suggestions and discussion. This work was supported by the Dr. Ralph and Marian Falk Medical Research Trust, the Epilepsy Foundation, the MSTP and GDTP programs at the University of Chicago (supported by NIH: grants: T32 GM007281-35 and T32 HD007009-35), and the ARCS Foundation.
Abbreviations
- 0MG
0mM magnesium ions
- aCSF
artificial cerebral spinal fluid
- CPP
3-(2-carboxypiperazine-4-yl) propyl-1-phosphate
- IO
intrinsic oscillatory
- I-V
current voltage relationship
- MIB
mibefradil
- NIF
nifedipine
- NMDA
N-methyl-D-aspartic acid
- NMDAR
N-methyl-D-aspartic acid receptor
- NR2A
NMDA receptor subunit type 2A
- NR2B
NMDA receptor subunit type 2B
- NO
non-oscillatory
- REML
restricted maximum likelihood
- RNSC
region of negative slope conductance
- TTX
tetrodotoxin
References
- Ashcroft FM. Ion Channels and Disease: Channelopathies. Academic Press; San Diego, CA: 2000. [Google Scholar]
- Bayreuther C, Bourg V, Dellamonica J, Borg M, Bernardin G, Thomas P. Complex partial status epilepticus revealing anti-NMDA receptor encephalitis. Epileptic Disord. 2009;11:261–265. doi: 10.1684/epd.2009.0266. [DOI] [PubMed] [Google Scholar]
- Ben Ari Y. Developing networks play a similar melody. Trends Neurosci. 2001;24:353–360. doi: 10.1016/s0166-2236(00)01813-0. [DOI] [PubMed] [Google Scholar]
- Benayoun M, Cowan JD, van Drongelen W, Wallace E. Avalanches in a Stochastic Model of Spiking Neurons. PLoS Comput Biol. 2010;6:1000846. doi: 10.1371/journal.pcbi.1000846. [DOI] [PMC free article] [PubMed] [Google Scholar]
- Bryk AS, Raudenbush SW. Hierarchical linear models. Sage Publications; Newbury Park: 1992. [Google Scholar]
- Bonansco C, González de la Vega A, González Alegre P, Borde M, Garcá-Segura LM, Buño W. Tetanic stimulation of schaffer collaterals induces rhythmic bursts via NMDA receptor activation in rat CA1 pyramidal neurons. Hippocampus. 2002;12:434–446. doi: 10.1002/hipo.10023. [DOI] [PubMed] [Google Scholar]
- Buzsáki G. Rhythms of the Brain. Oxford Univ. Press; Oxford: 2006. [Google Scholar]
- Chagnac-Amitai Y, Connors BW. Synchronized excitation and inhibition driven by intrinsically bursting neurons in neocortex. J Neurophysiol. 1989;62:1149–1162. doi: 10.1152/jn.1989.62.5.1149. [DOI] [PubMed] [Google Scholar]
- Chagnac-Amitai Y, Luhmann HJ, Prince DA. Burst generating and regular spiking layer 5 pyramidal neurons of rat neocortex have different morphological features. J Comp Neurol. 1990;296:598–613. doi: 10.1002/cne.902960407. [DOI] [PubMed] [Google Scholar]
- Cheong E, Lee S, Choi BJ, Sun M, Lee CJ, Shin HS. Tuning thalamic firing modes via simultaneous modulation of T- and L-type Ca2+ channels controls pain sensory gating in the thalamus. J Neurosci. 2008;28:13331–13340. doi: 10.1523/JNEUROSCI.3013-08.2008. [DOI] [PMC free article] [PubMed] [Google Scholar]
- Chu HY, Zhen X. Hyperpolarization-activated, cyclic nucleotide-gated (HCN) channels in the regulation of midbrain dopamine systems. Acta Pharmacol Sin. 2010;31:1036–1043. doi: 10.1038/aps.2010.105. [DOI] [PMC free article] [PubMed] [Google Scholar]
- Christophe E, Doerflinger N, Lavery D, Molnár Z, Charpak S, Audinat E. Two populations of layer V pyramidal cells of the mouse neocortex: development and sensitivity to anesthetics. J Neurophysiol. 2005;94:3357–3367. doi: 10.1152/jn.00076.2005. [DOI] [PubMed] [Google Scholar]
- Crino PB, Duhaime A, Baltuch G. Differential expression of glutamate and GABA-A receptor subunit mRNA in cortical dysplasia. Neurology. 2001;56:906–913. doi: 10.1212/wnl.56.7.906. [DOI] [PubMed] [Google Scholar]
- Cull-Candy S, Brickley S, Farrant M. NMDA receptor subunits: diversity, development and disease. Curr Opin Neurobiol. 2001;11:327–335. doi: 10.1016/s0959-4388(00)00215-4. [DOI] [PubMed] [Google Scholar]
- D’Angelo E, Nieus T, Maffei A, Armano S, Rossi P, Taglietti V, Fontana A, Naldi G. Theta-frequency bursting and resonance in cerebellar granule cells: experimental evidence and modeling of a slow k+-dependent mechanism. J Neurosci. 2001;21:759–770. doi: 10.1523/JNEUROSCI.21-03-00759.2001. [DOI] [PMC free article] [PubMed] [Google Scholar]
- Del Negro CA, Pace RW, Hayes JA. What role do pacemakers play in the generation of respiratory rhythm? Adv Exp Med Biol. 2008;605:88–93. doi: 10.1007/978-0-387-73693-8_15. [DOI] [PubMed] [Google Scholar]
- Deschenes M, Labelle A, Landry P. Morphological characterization of slow and fast pyramidal tract cells in the cat. Brain Res. 1979;178:251–274. doi: 10.1016/0006-8993(79)90693-0. [DOI] [PubMed] [Google Scholar]
- Frick A, Zieglgänsberger W, Dodt HU. Glutamate Receptors Form Hot Spots on Apical Dendrites of Neocortical Pyramidal Neurons. J Neurophysiol. 2001;86:1412–1421. doi: 10.1152/jn.2001.86.3.1412. [DOI] [PubMed] [Google Scholar]
- Games KD, Winter JA. Layer V in rat auditory cortex: projections to inferior colliculus and contralateral cortex. Hear Res. 1988;34:1–25. doi: 10.1016/0378-5955(88)90047-0. [DOI] [PubMed] [Google Scholar]
- Gao WJ, Zheng ZH. Target-specific differences in somatodendritic morphology of layer V pyramidal neurons in rat motor cortex. J Comp Neurol. 2004;476:174–185. doi: 10.1002/cne.20224. [DOI] [PubMed] [Google Scholar]
- Glitsch MD. Calcium influx through N-methyl-D-aspartate receptors triggers GABA release at interneuron-Purkinje cell synapse in rat cerebellum. Neuroscience. 2008;151:403–409. doi: 10.1016/j.neuroscience.2007.10.024. [DOI] [PubMed] [Google Scholar]
- Gola M. Neurones h ondes-salves des mollusques- Variations cycliques lentes des conductances ioniques. Pflügers Arch. 1974;352:17–36. doi: 10.1007/BF01061947. [DOI] [PubMed] [Google Scholar]
- Golomb D, Amitai Y. Propagating neuronal discharge in neocortical slices: computational and experimental study. J Neurophysiol. 1997;78:1199–1211. doi: 10.1152/jn.1997.78.3.1199. [DOI] [PubMed] [Google Scholar]
- Hattox AM, Nelson SB. Layer V neurons in mouse cortex projecting to different targets have distinct physiological properties. J Neurophysiol. 2007;98:3330–3340. doi: 10.1152/jn.00397.2007. [DOI] [PubMed] [Google Scholar]
- Hill AA, Upadhyaya R. The effect of prenatal nicotine exposure on the postnatal development of an in vitro respiratory rhythm. Abstract# 270.15. Society for Neuroscience Annual Meeting; 2009.2009. [Google Scholar]
- Hodgkin AL. The local electric changes associated with repetitive action in a nonmedulated axon. Journal of Physiology. 1948;107:165–181. doi: 10.1113/jphysiol.1948.sp004260. [DOI] [PMC free article] [PubMed] [Google Scholar]
- Hodgkin AL, Huxley AF. A quantitative description of membrane current and its application to conduction and excitation in nerve. J Physiol. 1952;117:500–544. doi: 10.1113/jphysiol.1952.sp004764. [DOI] [PMC free article] [PubMed] [Google Scholar]
- Hox JJ. Applied multi-level analysis. 2. TT-Publikaties; Amsterdam: 1995. [Google Scholar]
- Hull C, Isaacson JS, Scanziani M. Postsynaptic mechanisms govern the differential excitation of cortical neurons by thalamic inputs. J Neurosci. 2009;29:9127–36. doi: 10.1523/JNEUROSCI.5971-08.2009. [DOI] [PMC free article] [PubMed] [Google Scholar]
- Huss M, Wang D, Trané C, Wikström M, Hellgren Kotaleski J. An experimentally constrained computational model of NMDA oscillations in lamprey CPG neurons. J Comput Neurosci. 2008;25:108–121. doi: 10.1007/s10827-007-0067-1. [DOI] [PubMed] [Google Scholar]
- Izhikevich E. Dynamical Systems in Neuroscience: The Geometry of Excitability and Bursting. MIT Press; Cambridge: 2007. [Google Scholar]
- Jahr CE, Stevens CF. A quantitative description of NMDA receptor-channel kinetic behavior. J Neurosci. 1990;10:1830–1837. doi: 10.1523/JNEUROSCI.10-06-01830.1990. [DOI] [PMC free article] [PubMed] [Google Scholar]
- Kalia LV, Kalia SK, Salter MW. NMDA receptors in clinical neurology: excitatory times ahead. Lancet Neurol. 2008;7:742–755. doi: 10.1016/S1474-4422(08)70165-0. [DOI] [PMC free article] [PubMed] [Google Scholar]
- Kang J, Huguenard JR, Prince DA. Voltage-gated potassium channels activated during action potentials in layer V neocortical pyramidal neurons. J Neurophysiol. 2000;83:70–80. doi: 10.1152/jn.2000.83.1.70. [DOI] [PubMed] [Google Scholar]
- Kasper EM, Larkman AU, Lübke J, Blakemore C. Pyramidal neurons in layer 5 of the rat visual cortex. III. Differential maturation of axon targeting, dendritic morphology and electrophysiological properties. J Comp Neurol. 1994;339:495–518. doi: 10.1002/cne.903390404. [DOI] [PubMed] [Google Scholar]
- Keefer EW, Gramowski A, Gross GW. NMDA receptor-dependent periodic oscillations in cultured spinal cord networks. J Neurophysiol. 2001;86:3030–3042. doi: 10.1152/jn.2001.86.6.3030. [DOI] [PubMed] [Google Scholar]
- Kobayashi T, Nagao T, Fukuda H, Hicks TP, Oka JI. NMDA receptors mediate neuronal burst firing in rat somatosensory cortex in vivo. Neuroreport. 1993;4:735–738. doi: 10.1097/00001756-199306000-00034. [DOI] [PubMed] [Google Scholar]
- Kotsopoulos IA, van Merode T, Kessels FG, de From MC, Knottnerus JA. Systematic review and meta-analysis of incidence studies of epilepsy and unprovoked seizures. Epilepsia. 2002;43:1402–1409. doi: 10.1046/j.1528-1157.2002.t01-1-26901.x. [DOI] [PubMed] [Google Scholar]
- Larkum ME, Nevian T, Sandler M, Polsky A, Schiller J. Synaptic integration in tuft dendrites of layer 5 pyramidal neurons: a new unifying principle. Science. 2009;325:756–760. doi: 10.1126/science.1171958. [DOI] [PubMed] [Google Scholar]
- Lerma J, Herranz AS, Herreras O, Abraira V, Martin del Rio R. In vivo determination of extracellular concentration of amino acids in the rat hippocampus. A method based on brain dialysis and computerized analysis. Brain Res. 1986;384:145–155. doi: 10.1016/0006-8993(86)91230-8. [DOI] [PubMed] [Google Scholar]
- Liu XB, Murray KD, Jones EG. Switching of NMDA receptor 2A and 2B subunits at thalamic and cortical synapses during early postnatal development. J Neurosci. 2004;24:8885–8895. doi: 10.1523/JNEUROSCI.2476-04.2004. [DOI] [PMC free article] [PubMed] [Google Scholar]
- MacLean JN, Schmidt BJ. Voltage-sensitivity of motoneuron NMDA receptor channels is modulated by serotonin in the neonatal rat spinal cord. J Neurophysiol. 2001;86:1131–1138. doi: 10.1152/jn.2001.86.3.1131. [DOI] [PubMed] [Google Scholar]
- Mainen ZF, Sejnowski TJ. Influence of dendritic structure on firing pattern in model neocortical neurons. Nature. 1996;382:363–366. doi: 10.1038/382363a0. [DOI] [PubMed] [Google Scholar]
- Marcantoni A, Baldelli P, Hernandez-Guijo JM, Comunanza V, Carabelli V, Carbone E. L-type calcium channels in adrenal chromaffin cells: Role in pace-making and secretion. Cell Calcium. 2007;42:397–408. doi: 10.1016/j.ceca.2007.04.015. [DOI] [PubMed] [Google Scholar]
- Marcuccilli CJ, Tryba AK, van Drongelen W, Koch H, Viemari JC, Peña-Ortega F, Doren EL, Pytel P, Chevalier M, Mrejeru A, Kohrman MH, Lasky RE, Lew SM, Frim DM, Ramirez JM. Neuronal bursting properties in focal and parafocal regions in pediatric neocortical epilepsy stratified by histology. J Clin Neurophysiol. 2010;27:387–97. doi: 10.1097/WNP.0b013e3181fe06d8. [DOI] [PubMed] [Google Scholar]
- Mayer ML, Vyklicky L, Jr, Westbrook GL. Modulation of excitatory amino acid receptors by group IIB metal cations in cultured mouse hippocampal neurones. J Physiol. 1989;415:329–350. doi: 10.1113/jphysiol.1989.sp017724. [DOI] [PMC free article] [PubMed] [Google Scholar]
- Mitchell BD, Macklis JD. Large-scale maintenance of dual projections by callosal and frontal cortical projection neurons in adult mice. J Comp Neurol. 2005;482:17–32. doi: 10.1002/cne.20428. [DOI] [PubMed] [Google Scholar]
- Mrejeru A, Wei A, Ramirez JM. Calcium-activated non-selective cation currents are involved in generation of tonic and bursting activity in dopamine neurons of the substantia nigra pars compacta. J Physiol. 2011;589:2497–2514. doi: 10.1113/jphysiol.2011.206631. [DOI] [PMC free article] [PubMed] [Google Scholar]
- Minlebaev M, Ben-Ari Y, Khazipov R. Network mechanisms of spindle-burst oscillations in the neonatal rat barrel cortex in vivo. J Neurophysiol. 2007;97:692–700. doi: 10.1152/jn.00759.2006. [DOI] [PubMed] [Google Scholar]
- Molnár Z, Cheung AF. Towards the classification of subpopulations of layer V pyramidal projection neurons. Neurosci Res. 2006;55:105–115. doi: 10.1016/j.neures.2006.02.008. [DOI] [PubMed] [Google Scholar]
- Najm I, Ying Z, Babb T, Crino PB, Macdonald R, Mathern GW, Spreafico R. Mechanisms of epileptogenicity in cortical dysplasias. Neurology. 2004;62:S9–13. doi: 10.1212/01.wnl.0000114506.49267.bb. [DOI] [PubMed] [Google Scholar]
- Nicoll RA. Expression mechanisms underlying long-term potentiation: a postsynaptic view. Philos Trans R Soc Lond B Biol Sci. 2003;358:721–726. doi: 10.1098/rstb.2002.1228. [DOI] [PMC free article] [PubMed] [Google Scholar]
- Nishizawa Y, Morii H, Durlach J. New Perspectives in Magnesium Research. Springer; London: 2007. [Google Scholar]
- Ohara S, Ikeda A, Kunieda T, Yazawa S, Taki J, Nagamine T, Taki W, Miyamoto S, Hashimoto N, Shibasaki H. Propagation of tonic posturing in supplementary motor area (SMA) seizures. Epilepsy Res. 2004;62:179–187. doi: 10.1016/j.eplepsyres.2004.09.002. [DOI] [PubMed] [Google Scholar]
- Pikovsky A, Rosenblum M, Kurths J. Synchronization – a universal concept in nonlinear sciences. Cambridge University Press; Cambridge: 2001. [Google Scholar]
- Polsky A, Mel B, Schiller J. Encoding and decoding bursts by NMDA spikes in basal dendrites of layer 5 pyramidal neurons. J Neurosci. 2009;29:11891–11903. doi: 10.1523/JNEUROSCI.5250-08.2009. [DOI] [PMC free article] [PubMed] [Google Scholar]
- Purvis LK, Smith JC, Koizumi H, Butera RJ. Intrinsic bursters increase the robustness of rhythm generation in an excitatory network. J Neurophysiol. 2007;97:1515–1526. doi: 10.1152/jn.00908.2006. [DOI] [PubMed] [Google Scholar]
- Raol YH, Lynch DR, Brooks-Kayal AR. Role of excitatory amino acids in developmental epilepsies. Ment Retard Dev Disabil Res Rev. 2001;7:254–260. doi: 10.1002/mrdd.1035. [DOI] [PubMed] [Google Scholar]
- Rioult-Pedotti MS. Intrinsic NMDA-induced oscillations in motoneurons of an adult vertebrate spinal cord are masked by inhibition. J Neurophysiol. 1997;77:717–730. doi: 10.1152/jn.1997.77.2.717. [DOI] [PubMed] [Google Scholar]
- Rhodes P. The properties and implications of NMDA spikes in neocortical pyramidal cells. J Neurosci. 2006;26:6704–6715. doi: 10.1523/JNEUROSCI.3791-05.2006. [DOI] [PMC free article] [PubMed] [Google Scholar]
- Sah P, Hestrin S, Nicoll RA. Tonic activation of NMDA receptors by ambient glutamate enhances excitability of neurons. Science. 1989;246:815–818. doi: 10.1126/science.2573153. [DOI] [PubMed] [Google Scholar]
- Schiller J, Major G, Koester HJ, Schiller Y. NMDA spikes in basal dendrites of cortical pyramidal neurons. Nature. 2000;404:285–289. doi: 10.1038/35005094. [DOI] [PubMed] [Google Scholar]
- Schiller J, Schiller Y. NMDA receptor-mediated dendritic spikes and coincident signal amplification. Curr Opin Neurobiol. 2001;11:343–8. doi: 10.1016/s0959-4388(00)00217-8. [DOI] [PubMed] [Google Scholar]
- Schmidt BJ, Hochman S, MacLean JN. NMDA receptor-mediated oscillatory properties: potential role in rhythm generation in the mammalian spinal cord. Ann N Y Acad Sci. 1998;860:189–202. doi: 10.1111/j.1749-6632.1998.tb09049.x. [DOI] [PubMed] [Google Scholar]
- Schubert D, Kötter R, Luhmann HJ, Staiger JF. Morphology, electrophysiology and functional input connectivity of pyramidal neurons characterizes a genuine layer va in the primary somatosensory cortex. Cereb Cortex. 2006;16:223–236. doi: 10.1093/cercor/bhi100. [DOI] [PubMed] [Google Scholar]
- Schwarz GE. Estimating the dimension of a model. Annals of Statistics. 1978;6.2:461–464. [Google Scholar]
- Schwartzkroin PA. Epilepsy: models, mechanisms, and concepts. Cambridge University Press; Cambridge: 1993. [Google Scholar]
- Sherwin AL. Neuroactive amino acids in focally epileptic human brain: a review. Neurochem Res. 1999;24:1387–1395. doi: 10.1023/a:1022580506443. [DOI] [PubMed] [Google Scholar]
- Sherwin A, Robitaille Y, Quesney F, Olivier A, Villemure J, Leblanc R, Feindel W, Andermann E, Gotman J, Andermann F, Ethier R, Kish S. Excitatory amino acids are elevated in human epileptic cerebral cortex. Neurology. 1988;38:920–923. doi: 10.1212/wnl.38.6.920. [DOI] [PubMed] [Google Scholar]
- Spires TL, Molnár Z, Kind PC, Cordery PM, Upton AL, Blakemore C, Hannan AJ. Activity-dependent regulation of synapse and dendritic spine morphology in developing barrel cortex requires phospholipase C-beta1 signalling. Cereb Cortex. 2005;15:385–393. doi: 10.1093/cercor/bhh141. [DOI] [PubMed] [Google Scholar]
- Spreafico R, Battaglia G, Arcelli P, et al. Cortical dysplasia: an immunocytochemical study of three patients. Neurology. 1998;50:27–36. doi: 10.1212/wnl.50.1.27. [DOI] [PubMed] [Google Scholar]
- Strogatz SH. Nonlinear Dynamics and Chaos. Perseus Books; Cambridge: 1994. [Google Scholar]
- Takekawa T, Aoyagi T, Fukai T. Synchronous and asynchronous bursting states: role of intrinsic neural dynamics. J Comput Neurosci. 2007;23:189–200. doi: 10.1007/s10827-007-0027-9. [DOI] [PubMed] [Google Scholar]
- Tohidi V, Nadim F. Membrane resonance in bursting pacemaker neurons of an oscillatory network is correlated with network frequency. J Neurosci. 2009;29:6427–6435. doi: 10.1523/JNEUROSCI.0545-09.2009. [DOI] [PMC free article] [PubMed] [Google Scholar]
- Traub R, Buhl E, Gloveli T, Whittington M. Fast rhythmic bursting can be induced in layer 2/3 cortical pyramidal neurons by enhancing persistent Na+ conductance or by blocking BK channels. J Neurophysiol. 2003;89:909–921. doi: 10.1152/jn.00573.2002. [DOI] [PubMed] [Google Scholar]
- Trevelyan AJ, Baldeweg T, Van Drongelen W, Yuste R, Whittington M. The source of after discharge activity in neocortical tonic–clonic epilepsy. J Neurosci. 2007;27:13513–13519. doi: 10.1523/JNEUROSCI.3005-07.2007. [DOI] [PMC free article] [PubMed] [Google Scholar]
- Trevelyan AJ, Sussillo D, Watson BO, Yuste R. Modular propagation of epileptiform activity: evidence for an inhibitory veto in neocortex. J Neurosci. 2006;26:12447–12455. doi: 10.1523/JNEUROSCI.2787-06.2006. [DOI] [PMC free article] [PubMed] [Google Scholar]
- Van Drongelen W, Koch H, Marcuccilli C, Pena F, Ramirez JM. Synchrony levels during evoked seizure-like bursts in mouse neocortical slices. J Neurophysiol. 2003;90:1571–1580. doi: 10.1152/jn.00392.2003. [DOI] [PubMed] [Google Scholar]
- Van Drongelen W, Lee HC, Koch, Hereld M, Elsen F, Chen Z, Stevens RL. Emergent epileptiform activity in neural networks with weak excitatory synapses. IEEE Trans Neur Sys & Rehab. 2005;13:236–241. doi: 10.1109/TNSRE.2005.847387. [DOI] [PubMed] [Google Scholar]
- Van Drongelen W, Koch H, Elsen FP, Lee HC, Mrejeru A, Doren E, Marcuccilli CJ, Hereld M, Stevens RL, Ramirez JM. The Role of Persistent Sodium Current in Bursting Activity of Mouse Neocortical Networks in Vitro. J Neurophysiol. 2006;96:2564–2577. doi: 10.1152/jn.00446.2006. [DOI] [PubMed] [Google Scholar]
- Walther H, Lambert JD, Jones RS, Heinemann U, Hamon B. Epileptiform activity in combined slices of the hippocampus, subiculum and entorhinal cortex during perfusion with low magnesium medium. Neurosci Lett. 1986;69:156–161. doi: 10.1016/0304-3940(86)90595-1. [DOI] [PubMed] [Google Scholar]
- White EL, Weinfeld L, Lev DL. A survey of morphogenesis during the early postnatal period in PMBSF barrels of mouse SmI cortex with emphasis on barrel D4. Somatosens Mot Res. 1997;14:34–55. doi: 10.1080/08990229771204. [DOI] [PubMed] [Google Scholar]
- Ying Z, Babb TL, Comair YG, et al. Induced expression of NMDAR2 proteins and differential expression of NMDAR1 splice variants in dysplastic neurons of human epileptic cortex. J Neuropathol Exp Neurol. 1998;57:47–62. doi: 10.1097/00005072-199801000-00007. [DOI] [PubMed] [Google Scholar]