

Abstract
Wilms tumor is the most common renal malignancy of childhood. To identify common variants that confer susceptibility to Wilms tumor we conducted a genome-wide association study in 757 cases and 1,879 controls. We evaluated ten SNPs in regions significant at P<5×10⁻⁵ in two independent replication series from the UK (769 cases and 2,814 controls) and the US (719 cases and 1,037 controls). We identified clear significant associations at two loci, 2p24 (rs3755132, P=1.03×10⁻¹⁴ and rs807624, P=1.32×10⁻¹⁴) and 11q14 (rs790356, P=4.25 ×10⁻¹⁵). Both regions contain genes that are plausibly related to Wilms tumorigenesis. We also identified candidate signals at 5q14, 22q12 and Xp22.
Wilms tumor is a childhood embryonal kidney cancer that affects approximately 1 in 10,000 children in Western populations.1 The median age of diagnosis is between 3 and 4 years and both kidneys are affected in ~5% of children. Histologically, Wilms tumor mirrors the development of normal kidney and classically contains the three cell types present in the embryonic kidney; blastema, epithelia and stroma.2
There is strong evidence of a genetic contribution to Wilms tumor. Firstly, there is significant variation in incidence that is attributable to ethnicity rather than geographical location.1 Secondly, approximately 2% of cases are familial.3 Thirdly, there exist several predisposition syndromes associated with an increased risk of Wilms tumor, the most common of which are conditions due to mutations in WT1 or epigenetic defects at 11p15.3 Fewer than 5% of Wilms tumor cases are attributable to known causes and the underlying basis of most Wilms tumor is unknown.4,5
We performed a genome-wide association study (GWAS) to identify genetic variants that confer susceptibility to Wilms tumor, using cases recruited through oncology clinics in North America. We compared the case genotype frequencies to data from North American controls obtained from the Database of Genotypes and Phenotypes (dbGAP).6 After quality control exclusions and removal of samples with non-European ancestry, we used data on 599,255 SNPs in 757 cases and 1,879 controls. We compared genotype frequencies in cases and controls primarily using the 1-degree-of-freedom (1df) Cochran Armitage trend test (Supplementary Figure 1). There was evidence of only modest inflation of the test statistics (λ=1.08), indicating that confounding due to population stratification was limited (Supplementary Figure 2).
We next considered 20 SNPs in nine regions of linkage disequilibrium (LD) that were significant at P<5×10⁻⁵. After eliminating strongly correlated SNPs, we further evaluated these putative associations by genotyping ten SNPs at nine loci in two independent replication series. These included 769 cases and 2,814 controls from the UK and 719 further cases from North America. We did not have samples from US control individuals to directly genotype so we analysed the US case genotypes against data from 1,037 additional controls obtained from dbGaP.
Two SNPs on chromosomes 2p24 and one SNP on chromosome 11q14 showed clear evidence of replication in each of the replication series separately (P=4.1 ×10⁻⁴ or better in the same direction as the GWAS) and reached genome-wide significance levels over both stages combined of P=1.03 ×10⁻¹⁴ and P=1.32 ×10⁻¹⁴ at 2p24 and P=4.25 ×10⁻¹⁵ at 11q14 (Table 1, Figure 1 and Supplementary Tables 1 and 2).
Table 1.
Summary results for three confirmed Wilms tumour susceptibility SNPs.
| Locus1 | Chromosome and Position2 |
Stage | Cases | Controls | RAF3 controls |
RAF3 cases |
Per allele OR4 (95% CI) |
P-value7 | |
|---|---|---|---|---|---|---|---|---|---|
| By stage | Combined | ||||||||
|
rs3755132 G/T |
2p24 15,647,271 |
GWAS | 756 | 1878 | 0.14 | 0.2 | 1.48 (1.25–1.74) |
3.75 × 10⁻⁶ | 1.03 × 10⁻¹⁴ |
| replication UK | 753 | 2715 | 0.14 | 0.19 | 1.41 (1.20–1.66) |
2.12 × 10⁻⁵ | |||
| replication USA | 702 | 1034 | 0.14 | 0.21 | 1.50 (1.26–1.79) |
5.45 × 10⁻⁶ | |||
|
rs807624 A/C |
2p24 15,699,922 |
GWAS | 757 | 1879 | 0.33 | 0.4 | 1.33 (1.17–1.51) |
8.04 × 10−06 | 1.32 × 10⁻¹⁴ |
| replication UK | 747 | 2708 | 0.36 | 0.42 | 1.29 (1.14–1.45) |
2.83 × 10⁻⁵ | |||
| replication USA | 709 | 1037 | 0.34 | 0.42 | 1.39 (1.21–1.60) |
1.95 × 10⁻⁶ | |||
|
rs790356 G/A |
11q14 83,298,435 |
GWAS | 755 | 1876 | 0.49 | 0.58 | 1.43 (1.27–1.61) |
5.50 × 10⁻⁹ | 4.25 × 10⁻¹⁵ |
| replication UK | 761 | 2725 | 0.49 | 0.55 | 1.27 (1.14–1.43) |
3.18 × 10⁻⁵ | |||
| replication USA | 697 | 1037 | 0.51 | 0.57 | 1.28 (1.12–1.47) |
0.000414 | |||
dbSNP rs number, risk/non-risk associated alleles
Chromosome and build 36 position
RAF = Risk allelef requency
OR = odds ratio
OR in heterozygotes, relative to common homozygotes
OR in rare homozygotes, relative to common homozygotes
Cochran-Armitage test for trend
Figure 1. Regional plots of Wilms tumour susceptibility loci at 2p24 and 11q14.
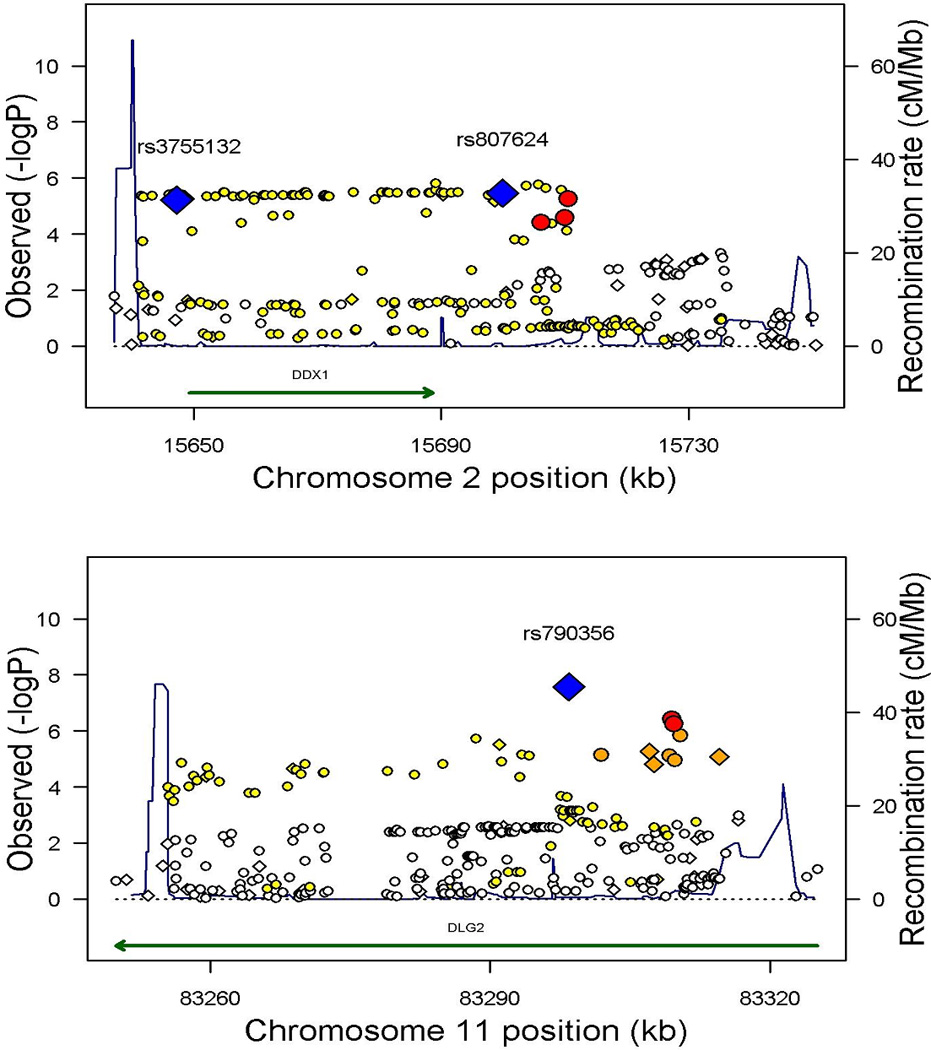
The genomic regions of association with Wilms tumor, on chromosomes 2p24 and 11q14. Shown are the −log10 association P values of SNPs in 757 Wilms tumor cases and 1,879 controls. Index SNPs are indicated in blue with the intensity of red shading indicating the strength of LD with the index SNP. Diamond shaped markers indicate genotyped SNPs; circular markers indicate imputed SNPs. Also shown are the SNP build 36 coordinates in kilobases (kb), recombination rates in centimorgans (cM) per megabase (Mb) (in blue) and the genes in the region (in green).
We also identified three low-frequency SNPs at 5q14 (rs1027643, P=5.2×10⁻¹⁰), 22q12 (rs2283873, P=5.30×10⁻¹²) and Xp22 (rs5955543, P=1.04×10⁻⁹) associations for which achieved genome-wide significance, demonstrating clear replication in the US series but with only weaker evidence of replication in the UK series (P=0.013 to P=0.0672) (Table 2, Supplementary Tables 1 and 2). Accordingly, further replication studies are required to confirm these associations, as low frequency variants in particular are susceptible to signal artefact when using different genotyping platforms for cases and controls.
Table 2.
Summary results for three low-frequency candidate Wilms tumour susceptibility SNPs.
| Locus1 Chromosome and Position2 |
Stage | Cases | Controls | RAF3 controls |
RAF3 cases |
Per allele OR4 (95% CI) |
P-value7 | ||
|---|---|---|---|---|---|---|---|---|---|
| By stage | Combined | ||||||||
|
rs1027643 T/C |
5q14 91,919,548 |
GWAS | 757 | 1878 | 0.036 | 0.073 | 2.24 (1.69–2.97) |
1.94 × 10⁻⁸ | 5.20 × 10⁻¹⁰ |
| Replication UK | 757 | 2719 | 0.049 | 0.061 | 1.27 (0.98–1.64) |
0.067226 | |||
| Replication USA | 704 | 1037 | 0.049 | 0.078 | 1.65 (1.25–2.18) |
0.000452 | |||
|
rs2283873 A/G |
22q12 29,343,296 |
GWAS | 757 | 1879 | 0.015 | 0.036 | 2.65 (1.75–4.02) |
3.90 × 10⁻⁶ | 5.30 × 10⁻¹² |
| Replication UK | 723 | 2739 | 0.018 | 0.029 | 1.64 (1.11–2.42) |
0.012618 | |||
| Replication USA | 713 | 1037 | 0.017 | 0.047 | 2.52 (1.73–3.66) |
1.25 × 10⁻⁶ | |||
|
rs5955543 G/A |
Xp22 17,608,318 |
GWAS | 757 | 1879 | 0.014 | 0.034 | 3.42 (1.91–6.12) |
3.69 × 10⁻⁵ | 1.04 × 10⁻⁹ |
| Replication UK | 698 | 2725 | 0.011 | 0.025 | 1.98 (1.00–3.92) |
0.049796 | |||
| Replication USA | 700 | 1035 | 0.019 | 0.049 | 3.14 (1.85–5.33) |
2.24 × 10⁻⁵ | |||
dbSNP rs number, risk/non-risk associated alleles
Chromosome and build 36 position
RAF = Risk allelef requency
OR = odds ratio
OR in heterozygotes, relative to common homozygotes
OR in rare homozygotes, relative to common homozygotes
Cochran-Armitage test for trend
We next used imputation to evaluate if a more strongly associated variant was present at the loci, by estimating the genotype probabilities at additional SNPs using HapMap3 and 1000 Genomes data as a framework. At four of the five loci, imputation identified more strongly associated variants than the original SNP (Figure 1, Supplementary Table 3). In all regions, the imputed SNPs were of similar risk-frequency profile to the genotyped SNPs. Direct genotyping of these imputed SNPs in cases and controls would be of interest to confirm these associations. We also estimated the ORs associated with haplotypes of SNPs in each of the five regions (Supplementary Table 4). At each locus either the association was present on more than one haplotype carrying the risk allele, suggesting that the association was unlikely to be driven by a single rarer, higher penetrance variant, or the association was only present on a single haplotype of similar frequency to the sentinel SNP, thus affording no additional information. There was no evidence of departure from a log-additive model for any SNP, i.e. the OR for rare homozygotes did not differ significantly from the square of the OR for heterozygotes. There was also no evidence of statistical gene-gene interaction between loci; the combined effects of SNPs were consistent with multiplicative (log-additive) combination of effects.
We investigated whether the loci are associated with different risks in subgroups of Wilms tumor cases characterised by specific phenotypic features or risk factors including sex, age at diagnosis, family history of Wilms tumor, if the tumor was bilateral or unilateral, histology, disease stage, or if there was relapse after treatment (Supplementary Tables 5–7). rs790356 at 11q14 showed evidence of a stronger effect in females than males (P=0.0017) and a trend in strength of association with increasing age at diagnosis (P=0.0036). Genotyping of rs790356 in additional series would be of interest to further evaluate these associations. There was no significant difference in risk at any other SNP in any subgroup (Supplementary Tables 6–7).
The strongest evidence of association (P=4.25 ×10⁻¹⁵) was at rs790356, which lies in a 68 kb LD block on chromosome 11q14.1 containing DLG2 (Discs Large, Drosophila, homolog of 2). DLG2 is a member of the membrane-associated guanylate kinase protein family.7 Dlg, the Drosophila homolog of DLG2, functions with Scribble and Lgl in the planar cell polarity pathway.8 This pathway is essential for correct tissue morphogenesis during development and its disruption has been implicated in oncogenesis.9 Interestingly, the human homolog of scribble (SCRIB) is a recognised target of the Wilms tumor 1 gene product, WT1.5,10 In mice, Scribble and wt1 show coincident expression in the developing kidney. Moreover, in both murine and human kidney cell lines, WT1 has been shown to bind the SCRIB promoter activating SCRIB expression.10 Thus, although interactions of DLG2 in humans have not been well characterised, it is plausible that susceptibility to Wilms tumor at the 11q14 locus is effected through DLG2 and WT1-related pathways.
We identified two SNPs associated with Wilms tumor susceptibility in a 109 kb LD block at 2p24.3. The effects of rs3755132 and rs807624 are maintained when corrected for each other (OR=1.25 (1.03–1.53), OR=1.21 (1.04–1.41) respectively; P=0.01). Furthermore, the correlation between rs3755132 and rs807624 is weak (D’=1 and r2=0.328 in HapMap3 CEU samples, D’=0.979 and r2=0.328 in our GWAS control data). These data suggest that rs3755132 and rs807624 are independently associated with Wilms tumor. Because neither SNP alone can fully account for the association, it is possible that a unique causal variant may exist which is in LD with, and captures the effects of, both rs3755132 and rs807624. However, although imputation revealed more strongly associated SNPs at this locus (see Supplementary Table 3), none fully captured the associations of both rs3755132 and rs807624. rs3755132 is located 1.5 kb upstream of the promoter of DDX1 (DEAD box polypeptide 1). rs807624 is 11 kb 3’ of DDX1 and 52 kb 3’ of rs3755132. DDX1 is involved in the initiation of translation and in RNA splicing and modification. It is also implicated in DNA double-strand break repair through its functions as an RNAse and RNA-DNA helicase.11 Notably, both SNPs are located within a region of 2p24 that shows somatic copy number gain or amplification in many childhood cancers, most notably neuroblastoma, but also occasionally in Wilms tumor.12,13 It is generally assumed that a neighboring gene in the amplicon, MYCN, is the primary target in promoting oncogenesis. Whilst it is possible that the association we identified is mediated through a long-range effect on MYCN, DDX1 seems the more likely target.
In summary, we have performed the first GWAS in Wilms tumor, identifying two definite and three probable predisposition loci and providing insights into biological pathways that may be important in the genesis of this embryonal kidney cancer. The power to detect these loci was 21% for 2p24, 13% for 11q14, 4% for 22q12, 3% for Xp22 and <1% for 5q14. This strongly suggests that multiple loci of equivalent or weaker effects are likely to exist, and may be tractable through follow-up of additional SNPs showing evidence of association in this study, and/or through further genome-wide association studies.
METHODS
Samples
Cases
Wilms tumor cases from UK were recruited from Paediatric Oncology centres through the Factors Associated with Childhood Tumors (FACT) study and the Children’s Cancer and Leukaemia Group (CCLG, Supplementary Note). From 1985 onwards, 97% of children in the UK with Wilms tumour have been registered with the CCLG (formerly called the UKCCSG, ). Phenotypic data was obtained from the referring centre and/or the National Registry of Childhood Tumors (NRCT). Wilms tumor cases from North America were recruited through the National Wilms Tumor Study Group (NWTSG) and the Children’s Oncology Group (COG). Since 1969, the NWTSG has registered over 80% of incident cases of Wilms tumor.14 Cases were unrelated and self-reported to be of non-Hispanic European ancestry. Information regarding race, gender, age at diagnosis, stage, histopathology, relapse, bilaterality and family history of Wilms tumor was obtained for as many cases as possible.
Controls
DNA samples from UK controls were from the 1958 Birth Cohort, an ongoing follow-up of persons born in Great Britain in one week in 1958. 2,814 population controls, representative of the geographical regions across the UK, were used in the replication study.
We did not have samples from North American controls. Instead we used data from the Database of Genotypes and Phenotypes (dbGaP). Bethesda (MD): National Center for Biotechnology Information, National Library of Medicine.6 In the GWAS we used data from individuals recruited as controls for a study of Parkinson’s disease at the NeuroGenetics Research Consortium (NGRC)-affiliated movement disorder clinics in Oregon, Washington, Georgia and New York. Individuals were age >20, of self-reported white ethnicity and free of neurological diseases. In the replication study, we used controls recruited through being friends/spouses of attendees of patients at M.D. Anderson Cancer Centre, Texas. Individuals were described as non-Hispanic Caucasian and had not had cancer.
The study had approval from the appropriate ethics and study committees in the UK (London Multicentre Ethics Committee, Ref, 05/MRE02/17) and US (Children’s Oncology Group, Ref: AREN09B1).
Genotyping
For the GWAS, cases were genotyped using the Illumina HumanOmniExpress-12v1_A SNP array at the Broad Institute Genetic Analysis Platform. Each 96-well plate contained a HapMap CEU control. Samples were clustered and called from intensity data using BeadStudio version 3.1.3.0 with genotyping module version 3.2.32. Genotypes for the 1,879 controls used in the GWAS were generated using the Illumina Omni 1M array as part of the CIDR: NGRC Parkinson's Disease Study.
For the replication of associations we used 5’exonuclease assays (Taqman™, Applied Biosystems) following manufacturer’s protocols. We combined cases with controls on 384-well plates, each of which included at least two negative controls and 1–2% duplicates (intra-platform concordance: 98.96%). We performed cross-platform validation, genotyping by Taqman all case samples that had been run on the Illumina array (cross-platform concordance: 99.11%). US replication genotypes were compared to those available from 1,037 US controls, which had been genotyped on the Illumina Omni 1M array as part of the High Density SNP Association Analysis of Melanoma study.
For rs2283873 at 22q12, the genotype frequencies were in Hardy-Weinberg equilibrium (HWE) in the GWAS but there was some deviation from HWE in the replication analyses (Supplementary Table 2). We therefore undertook direct Sanger sequencing of rs2283873 to validate the Taqman data and to confirm genotypes of 257 samples, including all those heterozygous or homozygous for the minor allele or that had failed Taqman replication. There was full concordancy between genotype calls determined by Taqman and sequencing, thus confirming the validity of the replication genotyping.
Inclusion criteria for analyses
We only included cases with a definite histological diagnosis of Wilms tumor; we excluded individuals with histological diagnoses of nephroblastomatosis, renal cell carcinoma, renal sarcoma, rhabdoid tumor and peripheral PNET. We restricted analyses to individuals that were called on >97% of successfully genotyped SNPs. We computed identity-by-state (IBS) probabilities for all pairs in order to identify cryptic duplicates and close relatives (IBS>0.80). For each pair, the sample with the highest genotype call rate was retained: we thus eliminated two cases, one from a pair of close relatives (IBS= 0.82) and one from a pair of duplicated samples (IBS>0.99). Using a subset of 65,045 uncorrelated SNPs (r2<0.1), we estimated the average IBS between all participants together with the phase II HapMap samples (90 western European (CEU), 90 Nigerian (YRI), 44 Japanese (JPT) and 45 Han Chinese (CHB)). Using multi-dimensional scaling, we identified and removed 42 cases with >15% non-Western-European ancestry (27 with African ancestry and 15 with Asian ancestry). Furthermore, we excluded samples with abnormal heterozygosity (>5SD from the mean heterozygosity: one case sample eliminated). Following these exclusions, 757 cases and 1,879 controls were available for the genome-wide analysis.
For the GWAS, we included the 696,780 SNPs that were successfully genotyped in cases and controls. We filtered out all SNPs in either cases or controls with a) a MAF<1%, b) a call rate of <95% in cases or controls or c) a minor frequency of 1–5% with a call rate of <99%. We also excluded SNPs whose genotyped frequency departed from Hardy-Weinberg equilibrium (HWE) at P<10−12 in cases or P<0.00001 in controls (male samples were excluded for evaluation of HWE for X-chromosome SNPs). We excluded synonymous (G-C and A-T) SNPs. Following these exclusions, we analysed 599,255 SNPs genotyped in cases and controls. Cluster plots were inspected manually for all SNPs considered for replication.
For the replication, call rates of at least 97% per 384-well plate were required and cluster plots were visually examined for each plate. Genotype distributions for each SNP were evaluated for deviation from Hardy-Weinberg equilibrium.
Statistical Methods
For the GWAS, we assessed associations between each SNP and disease primarily using the 1df Cochran-Armitage trend test; as a secondary measure of association, we performed the 1df allelic association test. Inflation in the chi-squared statistic was assessed using the genomic control approach: we derived an inflation factor (λ) by dividing the median of the lowest 90% of the 1df statistics by the 45% percentile of a 1df chi-squared distribution (0.357). Since λ was small, we chose to present p-values uncorrected for λ as this made little difference to the significance levels and preserved consistency with the replication analysis.
We selected 20 SNPs that demonstrated association of a significance level of P<5×10⁻⁵ based on the 1-d.f. trend test in the GWAS for the replication phase. Where two or more SNPs were selected from the same region, we used multiple logistic regression to determine a minimal set of SNPs that showed evidence of association after adjustment for other SNPs.
1df tests of association were performed for the GWAS and the US and UK replication analyses separately, and then for the combined data, (stratified by stage (i.e. GWAS or replication) and study group (US or UK)). For the principle association analysis, we have emphasized the OR estimates from the combined replication analysis (stratified by study) to minimize the effect of 'winner's curse'. We assessed each SNP for dose-response by comparing 1df and 2df logistic regression models, adjusting for stage, using a likelihood ratio test (P<0.01) and examined the combined effects of multiple SNPs by evaluating the effect on the model of adding an interaction term, using a likelihood ratio test (P<0.01) and adjusting for stage.
Modification of the per allele odds ratios by covariate phenotype/risk factors was assessed using analysis of cases against all controls to generate strata-specific ORs and using case-only analysis to examine for heterogeneity of effect (Supplementary Table 6). Tumors defined as stage III or stage IV were categorised as “advanced”; tumors defined as stage I or stage II as “non-advanced”; bilateral tumours, which are usually termed ‘Stage V’, were excluded from this analysis. Tumors with histology described as “high-risk-blastemal”, “high-risk diffuse anaplasia” or “unfavourable” were categorised as “high risk”; tumors with histology described as “blastemal”, “cystic”, “intermediate”, “triphasic”, “favourable”, “intermediate-focal anaplasia” or “intermediate-non-anaplastic” were categorised as “standard risk”. Age of diagnosis was analysed in three categories: <2 years, 2–4 years and >4 years and the effect of age at diagnosis on SNP genotype in the cases was analysed using ordered polytomous regression.
Imputation was performed using IMPUTE2 using data from HapMap3 (~1.5 million SNPs, 1,184 individuals) and the 1000 Genomes low-coverage pilot haplotypes (179 individuals) as a framework. Imputed SNPs were retained only if they had an information score of >0.8 and a certainty score of >0.95 in both cases and controls. Haplotypes were evaluated using SNPs in each region that were significantly associated with Wilms tumour at P<0.001, after eliminating perfectly correlated SNPs. For haplotypes of frequency >1% (in controls), the p-value for association for the haplotype was calculated. The CaTS - Power Calculator software was used to estimate the power to detect each of the associations found, . LD matrices between SNPs reported in HapMap were based on Data Release 27/phase II+III Feb09 on NCBI B36 assembly, dbSNP b126, viewed using Haploview software (v4.2). LD blocks were evaluated using the HapMap recombination rate (cM/Mb) and defined using the Oxford recombination hotspots.15
All genomic references are based on NCBI Build 36. Analyses were performed using R (v2.6), Stata10 (State College, Texas, US) and PLINK (v1.07) software.
Supplementary Material
ACKNOWLEDGMENTS
We thank the families and the physicians and nurses that recruited them, for their participation in this study which was funded by the Wellcome Trust WTCC3 initiative (Grant reference: 088804/Z/09/Z). We thank Peter Donnelly for statistical advice throughout the design and execution of the study. We thank D Dudakia, J Bull, R Linger, B Ebbs, D Hughes from ICR and Yogita Mistry (from CCLG tumor bank), for assistance in sample collection, DNA extraction and genotyping. We thank A Strydom for administrative assistance for the project and manuscript. The US samples and data were provided by the Children’s Oncology Group (study AREN09B1) supported by the Chair's Grant U10 CA98543, SDC Grant U10 CA98413 and Human Specimen Banking Grant U24 CA114766 from the National Cancer Institute, National Institutes of Health, Bethesda, MD, USA. The UK samples were collected through the Factors Associated with Childhood Tumors (FACT) study which is a Children’s Cancer and Leukaemia Group (CCLG) Study (MREC Ref: 05/MRE02/17) and is supported by Cancer Research UK (Grant reference: C8620/A9024 and C8620_A8857). The full list of collaborators is given in the Supplementary Note. The Childhood Cancer Research Group receives funding from the Department of Health, the National Cancer Intelligence Network, the Scottish Government and Children with Cancer UK. The views expressed in this publication are those of the authors and not necessarily of any of these organisations. We acknowledge use of DNA from the British 1958 Birth Cohort DNA collection. We acknowledge NHS funding to the ICR/RMH NIHR Specialist Biomedical Cancer Research Centre. IS is supported by the Michael and Betty Kadoorie Cancer Genetics. C.T. is a Medical Research Council Clinical Research Fellow. This study was conducted at the Institution of Cancer Research, UK.
Footnotes
AUTHOR CONTRIBUTIONS
N.R. and C.T. designed the study and obtained financial support. M.G., J.H., M.H., J.K., S.L., G.L., M.M., B.M., V.N., J.N., S.P., B.P., M.R., M.S., H.T and N.R. undertook sample and data collection of UK cases, coordinated by A.Z., M.W-P., K.P-J., C.S. and N.R. A.N., J.D. and P.G. coordinated the transfer of US samples. E.R.P., S.S., R.M.M-X., S.H., I.S. and A.R coordinated sample management and replication genotyping and sequencing. D.P. coordinated data transfer and management. C.T. conducted statistical analyses with assistance from D.P. and E.R. C.T, E.R.P and NR wrote the manuscript. N.R and C.T. oversaw and managed all aspects of the study.
URLs
Database of Genotypes and Phenotypes, http://www.ncbi.nlm.nih.gov/sites/entrez?db=gap;
PLINK 1.07, http://pngu.mgh.harvard.edu/~purcell/plink/
The 1000 Genomes Project, http://www.1000genomes.org/
Haploview4.2, http://www.broadinstitute.org/haploview/haploview
CaTS; http://www.sph.umich.edu/csg/abecasis/CaTS/
IMPUTE2, http://mathgen.stats.ox.ac.uk/impute/impute_v2.html
1958 Birth cohort, http://www.cls.ioe.ac.uk/
REFERENCES
- 1.Stiller CA, Parkin DM. International variations in the incidence of childhood renal tumours. Br J Cancer. 1990;62:1026–1030. doi: 10.1038/bjc.1990.432. [DOI] [PMC free article] [PubMed] [Google Scholar]
- 2.Breslow NE, Beckwith JB, Perlman EJ, Reeve AE. Age distributions, birth weights, nephrogenic rests, and heterogeneity in the pathogenesis of Wilms tumor. Pediatr Blood Cancer. 2006;47:260–267. doi: 10.1002/pbc.20891. [DOI] [PMC free article] [PubMed] [Google Scholar]
- 3.Scott RH, Stiller CA, Walker L, Rahman N. Syndromes and constitutional chromosomal abnormalities associated with Wilms tumour. J Med Genet. 2006;43:705–715. doi: 10.1136/jmg.2006.041723. [DOI] [PMC free article] [PubMed] [Google Scholar]
- 4.Scott RH, Douglas J, Baskcomb L, Huxter N, Barker K, et al. Constitutional 11p15 abnormalities, including heritable imprinting center mutations, cause nonsyndromic Wilms tumor. Nat Genet. 2008;40:1329–1334. doi: 10.1038/ng.243. [DOI] [PubMed] [Google Scholar]
- 5.Little SE, Hanks SP, King-Underwood L, Jones C, Rapley EA, et al. Frequency and heritability of WT1 mutations in nonsyndromic Wilms' tumor patients: a UK Children's Cancer Study Group Study. J Clin Oncol. 2004;22:4140–4146. doi: 10.1200/JCO.2004.02.136. [DOI] [PubMed] [Google Scholar]
- 6.Mailman MD, Feolo M, Jin Y, Kimura M, Tryka K, et al. The NCBI dbGaP database of genotypes and phenotypes. Nat Genet. 2007;39:1181–1186. doi: 10.1038/ng1007-1181. [DOI] [PMC free article] [PubMed] [Google Scholar]
- 7.Kim E, Cho KO, Rothschild A, Sheng M. Heteromultimerization and NMDA receptor-clustering activity of Chapsyn-110, a member of the PSD-95 family of proteins. Neuron. 1996;17:103–113. doi: 10.1016/s0896-6273(00)80284-6. [DOI] [PubMed] [Google Scholar]
- 8.Humbert PO, Grzeschik NA, Brumby AM, Galea R, Elsum I, et al. Control of tumourigenesis by the Scribble/Dlg/Lgl polarity module. Oncogene. 2008;27:6888–6907. doi: 10.1038/onc.2008.341. [DOI] [PubMed] [Google Scholar]
- 9.Bilder D, Li M, Perrimon N. Cooperative regulation of cell polarity and growth by Drosophila tumor suppressors. Science. 2000;289:113–116. doi: 10.1126/science.289.5476.113. [DOI] [PubMed] [Google Scholar]
- 10.Wells J, Rivera MN, Kim WJ, Starbuck K, Haber DA. The predominant WT1 isoform (+KTS) encodes a DNA-binding protein targeting the planar cell polarity gene Scribble in renal podocytes. Mol Cancer Res. 2010;8:975–985. doi: 10.1158/1541-7786.MCR-10-0033. [DOI] [PMC free article] [PubMed] [Google Scholar]
- 11.Li L, Monckton EA, Godbout R. A role for DEAD box 1 at DNA double-strand breaks. Mol Cell Biol. 2008;28:6413–6425. doi: 10.1128/MCB.01053-08. [DOI] [PMC free article] [PubMed] [Google Scholar]
- 12.Schaub R, Burger A, Bausch D, Niggli FK, Schafer BW, et al. Array comparative genomic hybridization reveals unbalanced gain of the MYCN region in Wilms tumors. Cancer Genet Cytogenet. 2007;172:61–65. doi: 10.1016/j.cancergencyto.2006.08.010. [DOI] [PubMed] [Google Scholar]
- 13.Squire JA, Thorner PS, Weitzman S, Maggi JD, Dirks P, et al. Co-amplification of MYCN and a DEAD box gene (DDX1) in primary neuroblastoma. Oncogene. 1995;10:1417–1422. [PubMed] [Google Scholar]
- 14.D'Angio GJ. The National Wilms Tumor Study: a 40 year perspective. Lifetime Data Anal. 2007;13:463–470. doi: 10.1007/s10985-007-9062-0. [DOI] [PubMed] [Google Scholar]
- 15.Myers S, Bottolo L, Freeman C, McVean G, Donnelly P. A fine-scale map of recombination rates and hotspots across the human genome. Science. 2005;310:321–324. doi: 10.1126/science.1117196. [DOI] [PubMed] [Google Scholar]
Associated Data
This section collects any data citations, data availability statements, or supplementary materials included in this article.