

Abstract
This paper presents experimental results demonstrating the feasibility of high frequency ultrasonic sensing and sorting for screening single oleic acid (lipid or oil) droplets under continuous flow in a microfluidic channel. In these experiments, hydrodynamically focused lipid droplets of two different diameters (50 μm and 100 μm) are centered along the middle of the channel that is filled with deionized (DI) water. A 30 MHz lithium niobate (LiNbO3) transducer, placed outside the channel, first transmits short sensing pulses to non-invasively determine acoustic scattering properties of individual droplets that are passing through the beam’s focus. Integrated backscatter (IB) coefficients, utilized as a sorting criterion, are measured by analyzing received echo signals from each droplet. When the IB values corresponding to 100 μm droplets are obtained, a custom-built LabVIEW panel commands the transducer to emit sinusoidal burst signals to commence the sorting operation. The number of droplets tested for the sorting is 139 for 50 μm droplets and 95 for 100 μm droplets. The sensing efficiencies are estimated to be 98.6 % and 99.0 %, respectively. The sorting is carried out by applying acoustic radiation forces to 100 μm droplets to direct them towards the upper sheath flow, thus separating them from the centered droplet flow. The sorting efficiencies are 99.3 % for 50 μm droplets and 85.3 % for 100 μm droplets. The results suggest that this proposed technique has the potential to be further developed into a cost-effective and efficient cell/microparticle sorting instrument.
Introduction
Single particulate sorting devices have frequently been used in investigating bioassay compartmentalization, an encapsulated microenvironment for inducing various cell expressions.1,2 Individual compartments, in contrast to bulk sample separation techniques e.g., filtration and sedimentation,3 are screened by manipulating small volumes (typically < 1 μl) and the sorting efficiency depends on their bio-/physical properties. Fluorescence-activated cell sorting (FACS) has thus been developed to satisfy this need by combining light scattering with flow cytometry.4,5 Despite its high throughput capability (5000~40,000 cells·s-1), FACS requiring additional sample treatment of fluorescent labeling often produces aerosols that cause serious biological side effects on cells.6 To overcome these drawbacks, fluorescence activated droplet sorting (FADS)7 have been demonstrated by encapsulating each cell within droplet emulsion integrated with microfluidic flow systems in conventional FACS. Although allowing sterile and rapid sample processing without compromising cell viability, FADS mainly relies on fluorescent detection and dielectrophoresis driven by complex electronic circuits. Other microfluidic sorting techniques proposed so far includes hydrodynamic flow switching8 and acoustic standing waves9 that are more appropriate tools for bulk sample screening. A surface acoustic wave (SAW) actuated cell sorting (SAWACS) system10 has recently been developed to separate human keratinocytes, fibroblasts, and melanoma cells. The system complexity is still high, because a SAW generation unit is integrated with a poly(dimethyl) siloxane (PDMS) device. Hence a simple and yet inexpensive sorting method for individual particulates is needed for precise bioassay analysis.
Size-based sorting approaches have often been used for low-throughput separation applications without antibody tag e.g., sorting of stem cells that express few protein markers. Mesenchymal stem cells have been sorted from epithelial progenitor cells by being injected into a ribbon-like capillary device in continuous flow.11 Myocytes and non-myocytes have also been isolated by size from rat cardiac cell populations in microfluidic channels.12 Parenchymal cells (hepatocytes) and non-parenchymal cells in liver have been separated by their difference in size via microfluidic filtration.13 In particular, large hepatocytes of liver are used for toxicological assessment and cell transplantation, whereas small non-parenchymal cells are essential in liver reconstruction.14,15 The separation of each liver cell by size is critical for carrying out pharmacological and metabolic studies.
This paper presents an acoustically driven size-based droplet sorting device integrated with a PDMS microfluidic channel. In this work, hydrodynamically focused lipid droplets flowing in the DI water-filled channel are non-invasively probed with a high frequency ultrasonic beam through a quantitative measurement of their backscattering properties. A 30 MHz single element lithium niobate (LiNbO3) transducer is placed outside the channel, aiming at the droplet flow. The overall system consists of two independent and sequential processes, acoustic sensing and sorting. A series of short pulses emitted from the transducer forms a sensing beam by which individual droplets are remotely interrogated inside the channel. From analyzing echo amplitudes and integrated backscatter (IB) coefficients corresponding to those droplets, the transducer is switched from the sensing to the sorting mode via a custom-built LabVIEW routine. A sorting beam of 30 MHz sinusoidal bursts then drives the transducer to push 100 μm droplets from the center stream. The performance of the proposed method is evaluated by measuring the sensing and the sorting efficiencies for a mixture of these droplets, and its potential applications are discussed.
Materials and methods
A. Oleic acid droplet
Oleic acid (Fisher Scientific, USA) lipid droplets are synthesized through droplet-based PDMS microfluidic devices using a soft lithographic technique16, a robust method of forming monodispersed droplets in the nanometer to micrometer size range.17 Droplets of 50 μm and 100 μm in diameter are made at a rate of 50 droplets per second, as oleic acid is sheared into spherical shape by the aqueous phase at the flow focusing nozzle. The droplets of the specified sizes have a very tight size distribution with 96 - 99% for each batch prepared.
B. Microfluidic structure
The same lithography processes are employed to fabricate PDMS based sorting devices. Three-inch silicon wafers are spin-coated with a 100 μm thick photoresist layer (SU8-50, MicroChem, Newton, MA). The wafers are baked to promote the adhesion of the SU-8, patterned by UV exposure through a photomask corresponding to the device structure and followed by the post-exposure baking. The final device pattern is then exposed by submerging the wafers in SU8 developer. After the residual SU-8 resist is cross-linked, a positive mold is formed for the silicone polymer. A prepolymer base to curing agent is mixed at a ratio of 10:1, poured over the patterned wafer and cured at 65o for nearly 4 hours. Individual devices are cut, punched to make connection holes into each device with flat end dispensing needles (Integrated Dispensing Solutions Inc., Agoura Hills, CA). Oxygen plasma treatment is used to bond the devices to a 5 mm thick PDMS substrate, because this procedure activates the PDMS surfaces and yields irreversible bonding between the two surfaces. A hydrophilic surface treatment using polyvinyl alcohol (PVA) is applied to the devices to minimize bubble formation and to match surface wettability. The devices are incubated in a 1 wt% PVA solution for 5 minutes at room temperature, briefly followed by additional incubation at 120 oC. This procedure, repeated until even coating over the device surface is achieved, is necessary to facilitate the PVA adhesion to the device surface after the excess solution is removed by vacuum.
The sorting device (Fig. 1) has three inlets merged into a 500 μm wide main channel. Droplets enter through the middle inlet, while the upper and the lower inlets provide sheath flows that confine the droplet flow to the center of the channel. The channel is then bifurcated to two outlets where the sorted droplets are collected. The channel height is 100 μm, equal to those of inlets and outlets. The width is 200 μm for each sheath inlet, and 100 μm for the droplet inlet. The outlet widths are designed differently, 150 μm and 300 μm for each. The front wall thickness where the ultrasonic beam enters the channel is set to 250 μm, to ensure that sufficient sound energy can be transmitted to those droplets flowing in the channel.
Fig. 1.

Layout of PDMS microfluidic device fabricated by conventional soft lithography. The upper and lower inlets provide sheath (or guiding) flows that hydrodynamically focus the droplet stream to the center of the channel, while the middle inlet delivers the droplet flow.
C. High frequency transducer
A 30 MHz lithium niobate (LiNbO3) single element transducer is designed by a KLM modeling software (PiezoCAD; Sonic Concepts, USA). Along with the piezo-element, the transducer consists of a backing and two matching layers for efficient sound transmission as depicted in Fig. 2. A 77 μm thick 36° rotated Y-cut LiNbO3 plate (Boston Piezo-Optics, USA) is electroplated with 1500 Å Cr / Au layer on both sides by an NSC-3000 automatic sputter coater (Nano-Master, USA). The first matching layer is made from a mixture of Insulcast 501 epoxy (American Safety Technologies, USA) and 2-3 μm silver particles (Aldrich Chemical Co., USA). After being lapped to a designed thickness of 12 μm, the matching layer is deposited by applying an adhesion promoter (Chemlok AP-131, Lord Corp., USA) on one side of the LiNbO3 plate and mechanically diced into square pieces. A backing layer of conductive silver epoxy (E-Solder 3022, Von Roll Isola Inc., USA) is cast on the other side of the LiNbO3 and centrifuged. The LiNbO3-matching-backing stack is turned down to a final aperture size (4 mm), concentrically placed in the brass housing. The stack and the housing are electrically insulated by filling an epoxy (Epo-Tek 301, Epoxy Technologies, USA) in between, before being press-focused at 3 mm. The transducer is sputtered with Cr / Au electrodes to set the ground contact between the stack and the housing. A 14 μm parylene film, as a second matching layer, is then coated over the aperture by a PDS 2010 Labcoater (SCS, USA). Finally the transducer is connected to an SMA connecter.
Fig. 2.
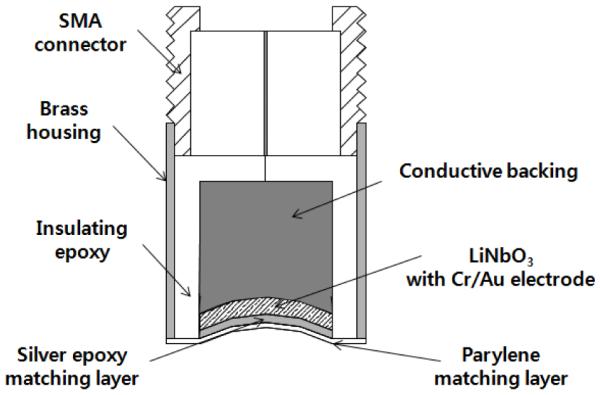
Schematic diagram of 30 MHz LiNbO3 single element ultrasonic transducer. The transducer consists of a LiNbO3 piezoelement, a backing material, and two matching layers for sound transmission.
The performance of the transducer is evaluated by measuring the beam characteristics and the pressure level at the focus with a needle type hydrophone (HPM04/01, Precision Acoustics, UK). The axial and the lateral resolutions are 50 μm and 38 μm for both the sensing and the pushing beams. The 6-dB bandwidth of the beam is 50 % and the peak pressure is 4.7 MPa for the sorting beam.
D. Integrated backscatter (IB) coefficient
The IB coefficient18 is defined as the ratio of backscattered energy from a scatterer volume to that from a planar quartz reflector, expressed in the frequency domain as:
V(f) and R(f) are the Fourier transforms of an echo signal v(t) from the scatterer and the reference signal r(t) from the reflector, respectively. fc and Δf are the resonant frequency of v(t) and its half-width bandwidth. The instrument dependence of power spectrum analysis is eliminated by normalizing |V(f)|2 to the reference spectrum |R(f)|2 of known reflectivity. Note that |R(f)|2 is measured prior to the experiment.
E. Experimental configuration
The schematic diagram of an acoustic sorting device illustrates the location of the transducer’s focus and the focused stream with respect to the main channel (Fig. 3). The sensing- and the sorting beams are sequentially transmitted from the transducer, interrogating and pushing the moving droplets from the outside of the channel. Both the microfluidic structure and the transducer are immersed in a DI water chamber. The transducer whose focal length is 3 mm is mounted on a three-axis manual linear stage coupled to a goniometer (OptoSigma, Santa Ana, CA, USA) for precise alignment with the main channel. The beam axis of the transducer is perpendicular to the channel wall in order to effectively measure the IB coefficient of these streaming droplets and to simultaneously sort them with acoustic radiation forces. The sorting beam is initiated by the LabVIEW to direct 100 μm droplets to the upper sheath flow. Focused droplet motion is monitored via a CCD camera (InfinityX; Lumenera, USA) assembled with a stereomicroscope (SMZ1500; Nikon, Japan). For signal transmission and reception, the transducer is equipped with an arbitrary waveform generator (AFG3252; Tektronix, Anaheim, CA, USA), a pulser/receiver (Model 5900PR; Panametrics-NDT, USA), and a 50-dB power amplifier (525LA; ENI, Rochester, USA).
Fig. 3.

Experimental arrangement for acoustic droplet sensing and sorting device. (a) Top view (b) Side view
A single cycle of a 30 MHz sinusoidal wave for sensing is input to the transducer from the pulser/receiver. The peak to-peak amplitude is 63 Vpp and the pulse repetition frequency (PRF) is 2 kHz (Fig. 4a). Echo signals scattered from the continuous droplet flow are received by the same transducer, digitized by a 12-bit analog-to-digital converter (ADC) board (CS12400; GaGe, USA) at a sampling rate of 400 MS/s. A custom-programmed LabVIEW routine calculates the IB values corresponding to those echoes, identifying the droplet size in real time. Based on the echo amplitude and the IB coefficient obtained, the LabVIEW program switches the transducer from the sensing to the sorting mode by sending a trigger signal to the waveform generator. In the sorting mode, the transducer is driven by 2000-cycled 30 MHz sinusoidal bursts whose peak-to-peak amplitude and PRF are 63 Vpp and 200 Hz (Fig. 4b). A specific droplet is then diverted away from the center channel by acoustic forces emitted from the transducer. In order to find this driving voltage required for the sorting, the voltage is slowly increased from 16 Vpp until 100 μm droplets begin to be pushed to the sheath flow.
Fig. 4.

Illustration of sensing and sorting signals driving the transducer.
Results and discussion
Pulse echo measurements are made at the focus of the transducer, 100 μm deep into the channel. The center of the focused stream width (or the droplet center) is located slightly beyond the focus by 150 μm, (1) to satisfy the mirror theory19 for validating the backscattering measurement, (2) to ensure that the sensing beam is wide enough to encompass a droplet which can be as large as 100 μm.
Hydrodynamic focusing is employed to maximize the ultrasonic exposure to flowing droplets during the sorting operation. It is very important to make sure that the focused stream is centered along the main channel. In order to find a proper stream width where steady flows for 50 μm and 100 μm droplets are formed, the sheath flow rate (fsh) is varied from 2 μl/min to 14 μl/min with a step increment of 2 μl/min, while the droplet flow rate (fd) is fixed at 2 μl/min. Each flow rate is adjusted by two syringe pumps (NE-1000 Multi-Phaser; New Era Pump System Inc., NY, USA). Fig. 5 illustrates the change in the focused stream width as a function of flow rate ratio (r = fsh/fd). The focused widths at r = 1 and 7 are 120 μm and 20 μm, respectively. Both fd and fsh are 2 μl/min and 6 μl/min, determined by the size and the position of droplets. With fsh set at 6 μl/min, a 60 μm focused stream width is achieved. In particular, a uniform droplet flow centered along the middle of the channel was experimentally observed under this condition, even for 100 μm droplets larger than this stream width. As the width gets larger than 60 μm, the flow pattern of 50 μm droplets becomes more irregular within the stream width.
Fig. 5.

Plot of focused stream width as a function of ratio of sheath flow rate (fsh) to droplet flow rate (fd). (a) fsh is adjusted from 2 μl/min to 14 μl/min with a step increment of 2 μl/min, whereas fd remains constant at 2 μl/min. (b) The stream width for uniform droplet flow is found to be 60 μm when fd = 2 μl/min and fsh = 6 μl/min, as a triangular marker indicates in (a).
The temporal variation of typical RF echo magnitudes and its corresponding IB coefficients are displayed in Fig. 6a. In particular, the peak amplitude is 13.5 ± 5.0 mVpp for 50 μm droplets and 38.0 ± 10.9 mVpp for 100 μm droplets. The ambient noise level is 7.3 ± 0.5 mVpp. The measured IB coefficients are −103.6 ± 3.1 dB for 50 μm and −95.4 ± 3.2 dB for 100 μm, whereas the coefficient is −114.0 ± 1.0 dB for the background noise (Fig. 6b). It is shown that the droplet size is linearly related to the IB coefficient on logarithmic scale (Fig. 6c). The sensing capability of this sorting device is evaluated by the sensing efficiency, the number of size-identified droplets divided by the total number of droplets. The number of those droplets is manually counted from the recorded movies. For 50 μm and 100 μm droplets, the acquired sensing efficiencies are 98.6 % and 99.0%, respectively. The sorting efficiency is determined as in the sensing mode with 234 droplets being tested (139 for 50 μm droplets and 95 for 100 μm droplets). The measured sorting efficiencies are 99.3 % and 85.3 %, respectively. Incomplete sorting efficiency (< 100 %) for 50 μm droplets may occur when a group of droplets flow closely together. Since the PRF of the sensing beam (= 2 kHz) is higher than that of the sorting beam (= 0.2 kHz), the sorting beam may miss some of the droplets while all the droplets in the group are scanned by the sensing beam. The experimental data also confirm that one droplet out of 139 droplets miss the sorting beam. The sensing- and sorting results are summarized in Table 1.
Fig. 6.

Relation between echo amplitudes and integrated backscatter (IB) coefficients corresponding to differently sized droplets. (a) Acquired echo signals and their IB coefficients for droplets passing through the sensing beam are plotted over time. (b) It is shown that the amplitudes and the IB coefficients for 100 μm droplets are larger than those for 50 μm droplets. (c) The droplet size is more linearly related to the IB coefficient than to the echo amplitude.
Table 1.
Summarized results for peak-to-peak echo amplitude, integrated backscatter coefficient, sensing- and sorting efficiencies for 50 μm/100 μm droplets.
| Parameter | 50 μm droplets | 100 μm droplets | Ambient noise |
|---|---|---|---|
| Peak-to-peak echo amplitude (mVpp) | 13.5 ± 5.0 | 38.0 ± 10.9 | 7.3 ± 0.5 |
| Integrated backscatter coefficient (dB) | −103.6 ± 3.1 | −95.4 ± 3.2 | −114.0 ± 1.0 |
| Sensing efficiency (%) | 98.6 | 99.0 | Not applicable |
| Sorting efficiency (%) | 99.3 | 85.3 | Not applicable |
The degraded sorting efficiency for 100 μm droplets may be because part of the channel is intermittently blocked by those 100 μm droplets agglomerated along the channel wall, resulting in non-uniform stream width. This type of two-dimensional hydrodynamic focusing has also been known to be intrinsically problematic in flow cytometry, causing a non-uniform velocity distribution of small particles e.g., cells or molecules in the vertical direction of the channel.20 As such vertically spread targets passing through a sensing zone in the channel, they may leave undetected droplets behind.21 The sorting beam, due to its increased number of burst cycles, generates strong enough acoustic radiation forces to push target droplets towards the channel wall. In our recent work, the applied force produced by the same transducer was reported to be in a few tens of nano-Newton range,22 much stronger than by other sorting techniques. Note that optical or dielectrophoretic forces have mostly been in the pico-Newton range.23,24 100 μm droplets are then directed to the upper sheath flow, while no forces are applied to 50 μm droplets. After passing the channel bifurcation, the droplets are collected in two separate outlets.
The sorting efficiency can be improved by making the channel’s cross-sectional area larger than the droplet size. Higher frequencies and PRFs of the sensing beam along with faster flow rates are needed to expedite the sorting speed and to offer fine spatial resolutions, essential for separating small biological cells. On the other hand, plant cells and protoplasts whose diameters are as large as 95 μm have been sorted with flow cytometers.25 Since the proposed technique is developed for targets of similar size, it can also be useful to separate those large cells. The calibrated pressure applied by the transducer at the focus is 4.7 MPa under the sorting condition, but the actual pressure inside the channel may be lower than that value because of reflection at the fluid/channel interface. Given the droplet size much larger than typical cells e.g., erythrocytes or leukocytes, less pressure level arising from higher frequency transducers may be sufficient in case of cell sorting.
The whole experimental apparatus including the transducer and the microfluidic device is immersed in a water bath to promote ultrasonic transmission into the main channel, making the proposed sorting system relatively bulky. The current system can be simplified by building an additional guiding branch to the main channel. The transducer can be integrated with the main channel through such guiding structure that is filled with a small amount of liquid medium. The sound beam can directly interrogate the target without requiring a large space of liquid immersion in between. This type of design can also reduce the reflection at the fluid/channel interface of the proposed system. For increasing the operating speed of the sorting process, advanced circuit design is necessary to replace a series of bulky electronic instruments. Higher frequency transducers and microfluidic channels with better hydrodynamics will also be constructed in the near future to apply the proposed approach to biological cell sorting. Typically, a two-dimensional hydrodynamic focusing utilized in this work is implemented only in the horizontal plane of the channel, and needs to be improved by additionally compressing the droplet stream in the vertical direction.26
When the target is detected, the LabVIEW program commands trigger signals within 5 μs for pushing the droplet. The process including signal acquisition, data analysis, and final sorting for one droplet is completed within 18 ms (about 60 Hz in terms of sorting throughput), considerably slower than conventional cell sorting techniques e.g. FACS (40 kHz) or FADS (300 Hz). Because separate electronic equipments are utilized for data processing and communication between the LabVIEW panel and the transducer during the sorting, the delayed response time (approximately between them results in such a low throughput. Integrated circuit design replacing those bulky units is thus required to further reduce the operating time, consequently increasing the throughput of the proposed system. Such enhancements will enable the proposed method to be used for droplet-based applications e.g., bioassay compartmentalization, where individual droplets need to be analyzed and separated for studying the variety of cell expressions induced within each droplet compartment.
Conclusion
In this paper, an acoustic droplet sensing and sorting device for microparticles and cells is reported. Non-contact detection and sorting of lipid microspheres by a high frequency ultrasound beam in a microfluidic device is demonstrated in real time via hydrodynamics and acoustic radiation forces. The sensing beam is generated by short pulses emitted from a high frequency ultrasonic transducer, probing individual droplets in the stream. Frequency-dependent backscattering properties are exploited as a sorting criterion, where the IB coefficients for 50 μm and 100 μm droplets are measured. The sorting beam of sinusoidal bursts produced by the same transducer is transmitted to divert 100 μm droplets away from the main channel. The sorting beam is at a higher intensity level producing strong enough acoustic radiation forces to push them towards the outer wall near the bifurcating point. The instantaneous transition between the sensing and the sorting modes is accomplished by a LabVIEW controlled ADC board, depending on the acquired IB coefficients. The efficiency in each mode is evaluated for mixed-sized droplets and is found comparable to those of other conventional methods. Hence the results suggest that this ultrasonic technique may have the potential to be further developed as a fast cell or particle sorter by increasing the flow rate and the ultrasound frequency.
Acknowledgements
This work has been supported by NIH grants R01-EB12058 and P41-EB2182. The present research has been conducted by the Research Grant of Kwangwoon University in 2011.
References
- 1.Doerr A. The smallest bioreactor. Nat. Methods. 2005;2:326. [Google Scholar]
- 2.He M, Edgar JS, Jeffries GDM, Lorenz RM, Shelby JP, Chiu DT. Selective encapsulation of single cells and subcellular organelles into picoliter- and femtoliter-volume droplets. Anal.Chem. 2005;77:1539–1544. doi: 10.1021/ac0480850. [DOI] [PubMed] [Google Scholar]
- 3.Orfao A, Ruiz-Arguelles A. General concepts about cell sorting techniques. Clin. Biochem. 1996;29:5–9. doi: 10.1016/0009-9120(95)02017-9. [DOI] [PubMed] [Google Scholar]
- 4.Bonner WA, Hulett HR, Sweet RG, Herzenberg LA. Fluorescence activated cell sorting. Rev. Sci. Instrum. 1972;43:404–409. doi: 10.1063/1.1685647. [DOI] [PubMed] [Google Scholar]
- 5.Leary JF. Ultra high-speed sorting. Cytometry Part A. 2005;67A:76–85. doi: 10.1002/cyto.a.20160. [DOI] [PubMed] [Google Scholar]
- 6.Oberyszyn AS, Robertson FM. Novel rapid method for visualization of extent and location of aerosol contamination during high-speed sorting of potentially biohazardous samples. Cytometry. 2001;43:217–222. [PubMed] [Google Scholar]
- 7.Baret J-C, Miller OJ, Taly V, Ryckelynck M, El-Harrak A, Frenz L, Rick C, Samuels ML, Hutchison JB, Agresti JJ, Link DR, Weitz DA, Griffiths AD. Fluorescence-activated droplet sorting (FADS): efficient microfluidic cell sorting based on enzymatic activity. Lab Chip. 2009;9:1850–1858. doi: 10.1039/b902504a. [DOI] [PubMed] [Google Scholar]
- 8.Fu AY, Chou HP, Spence C, Arnold FH, Quake SR. An integrated microfabricated cell sorter. Anal. Chem. 2002;74:2451–2457. doi: 10.1021/ac0255330. [DOI] [PubMed] [Google Scholar]
- 9.Petersson F, Nilsson A, Holm C, Jonsson H, Laurell T. Separation of lipids from blood utilizing ultrasonic standing waves in microfluidic channels. Analyst. 2004;129:938–943. doi: 10.1039/b409139f. [DOI] [PubMed] [Google Scholar]
- 10.Franke T, Braunmüller S, Schmid L, Wixforth A, Weitz DA. Surface acoustic wave cell sorting (SAWACS) Lab Chip. 2010;10:789–794. doi: 10.1039/b915522h. [DOI] [PubMed] [Google Scholar]
- 11.Roda B, Reschiglian P, Zattoni A, Alviano F, Lanzoni G, Costa R, Di Carlo A, Marchionni C, Franchina M, Bonsi L, Bagnara GP. A tag-less method of sorting stem cells from clinical specimens and separating mesenchymal from epithelial progenitor cells. Cytometry B Clin. Cytom. 2009;76B:285–290. doi: 10.1002/cyto.b.20472. [DOI] [PubMed] [Google Scholar]
- 12.Murthy SK, Sethu P, Vunjak-Novakovic G, Toner M, Radisic M. Size-based microfluidic enrichment of neonatal rat cardiac cell populations. Biomed. Microdevices. 2006;8:23–237. doi: 10.1007/s10544-006-8169-5. [DOI] [PubMed] [Google Scholar]
- 13.Yamada M, Kano K, Tsuda Y, Kobayashi J, Yamato M, Seki M, Okano T. Microfluidic devices for size-dependent separation of liver cells. Biomed. Microdevices. 2007;9:637–645. doi: 10.1007/s10544-007-9055-5. [DOI] [PubMed] [Google Scholar]
- 14.Kane BJ, Zinner MJ, Yarmush ML, Toner M. Liver-specific functional studies in a microfluidic array of primary mammalian hepatocytes. Anal. Chem. 2006;78:4291–4298. doi: 10.1021/ac051856v. [DOI] [PubMed] [Google Scholar]
- 15.Katayama S, Tateno C, Asahara T, Yoshizato K. Size-dependent in vivo growth potential of adult rat hepatocytes. Am. J. Pathol. 2001;158:97–105. doi: 10.1016/S0002-9440(10)63948-X. [DOI] [PMC free article] [PubMed] [Google Scholar]
- 16.Whitesides G, Ostumi E, Takayama S, Jiang X, Inger D. Soft lithography in biology and biochemistry. Annu. Rev. Biomed. Eng. 2001;3:335–373. doi: 10.1146/annurev.bioeng.3.1.335. [DOI] [PubMed] [Google Scholar]
- 17.Tan Y, Cristini V, Lee AP. Monodispersed microfluidic droplet generation by shear focusing microfluidic device. Sens. Actuators B. 2006;114:350–356. [Google Scholar]
- 18.Thomas LJ, III, Barzilai B, Perez JE, Sobel BE, Wickline SA, Miller JG. Quantitative real-time imaging of myocardium based on ultrasonic integrated backscatter. IEEE Trans. Ultrason. Ferroelectr. Freq. Control. 1989;36:466–470. doi: 10.1109/58.31785. [DOI] [PubMed] [Google Scholar]
- 19.Yuan YW, Shung KK. The effect of focusing on ultrasonic backscattering measurements. Ultras. Imag. 1986;8:212–219. doi: 10.1177/016173468600800204. [DOI] [PubMed] [Google Scholar]
- 20.Wolff A, Perch-Nielsen IR, Larsen UD, Friis P, Goranovic G, Poulsen CR, Kutter JP, Telleman P. Integrating advanced functionality in a microfabricated high-throughput fluorescent-activated cell sorter. Lab Chip. 2003;3:22–27. doi: 10.1039/b209333b. [DOI] [PubMed] [Google Scholar]
- 21.Wang T-H, Peng Y, Zhang C, Wong PK, Ho C-M. Single-molecule tracing on a fluidic microchip for quantitative detection of low-abundance nucleic acids. J. Am. Chem. Soc. 2005;127:5354–5359. doi: 10.1021/ja042642i. [DOI] [PubMed] [Google Scholar]
- 22.Lee J, Lee C, Shung KK. Calibration of sound forces in acoustic traps. IEEE Trans. Ultrason. Ferroelectr. Freq. Control. 2010;57:2305–2310. doi: 10.1109/TUFFC.2010.1691. [DOI] [PMC free article] [PubMed] [Google Scholar]
- 23.Brouhard GJ, Schek HT, III, Hunt AJ. Advanced optical tweezers for the study of cellular and molecular biomechanics. IEEE Trans. Biomed. Eng. 2003;50:121–125. doi: 10.1109/TBME.2002.805463. [DOI] [PubMed] [Google Scholar]
- 24.Wei M-T, Junio J, Ou-Yang HD. Direct measurements of the frequency-dependent dielectrophoresis force. Biomicrofluidics. 2009;3:012003. doi: 10.1063/1.3058569. [DOI] [PMC free article] [PubMed] [Google Scholar]
- 25.Harkins KR, Galbraith DW. Factors governing the flow cytometric analysis and sorting of large biological particles. Cytometry. 1987;8:60–70. doi: 10.1002/cyto.990080110. [DOI] [PubMed] [Google Scholar]
- 26.Mao X, Waldeisen JR, Huang TJ. Microfluidic drifting - implementing three dimensional hydrodynamic focusing with a single layer planar microfluidic device. Lab Chip. 2007;7:1221–1376. doi: 10.1039/b711155j. [DOI] [PubMed] [Google Scholar]