

Abstract
Purpose
Increased expression of inducible nitric oxide synthase (iNOS) resulting in nitric oxide elevation represents an important component of inflammatory responses. We assess the effects of methylprednisolone (MPL) on these processes during endotoxin-induced acute inflammation and provide a mechanism-based model to quantitatively describe them.
Methods
Male Lewis rats were dosed with lipopolysaccharide (50 μg/kg LPS) alone or with methylprednisolone (10 and 50 mg/kg) and sacrificed at different time points. Plasma MPL, lung iNOS mRNA expression, plasma nitric oxide (NO) and other physiological factors were measured. Sodium nitrate (750 μmole/kg) was given to a separate cohort of rats to assess NO disposition kinetics. PK-PD modeling was performed with ADAPT 5.
Results
Disposition kinetics of plasma MPL and NO showed bi-exponential decline and were described by two-compartment models. LPS increased expression of iNOS mRNA in lung and increased plasma NO, while MPL dosing palliated this increase in a dose-dependent manner. These effects were well captured using tandem indirect response and precursor-pool models.
Conclusion
The model provides a quantitative assessment of the suppression of NO production by MPL and shows that the major effects are at the transcriptional level by reducing expression of iNOS mRNA.
Keywords: corticosteroids, inflammation, iNOS, nitric oxide, PK-PD modeling
INTRODUCTION
Nitric oxide (NO) is a ubiquitous cell-signaling mediator that plays important roles in a wide range of physiological processes including inflammatory responses (1). NO is formed from L-arginine via nitric oxide synthase (NOS), which exist in three different isoforms. Endothelial NOS and neuronal NOS are constitutive, calcium-calmodulin dependent enzymes producing small amounts of NO over short time intervals and are involved in processes like neurotransmission, regulation of local blood flow, and blood pressure. However, the other isoform, inducible nitric oxide synthase (iNOS) is fully active at physiological calcium levels, generating large quantities of NO over extended periods of time and is primarily involved in host defense and inflammation (2). High concentrations of NO exert cytotoxic effects by adversely affecting cellular metabolism and inducing DNA fragmentation. In addition, the increased vascular permeability caused by NO results in greater monocyte and leucocyte infiltration into tissues, heightening pro-inflammatory conditions (1,2). Although the effects of NO are beneficial during infection, they are detrimental during conditions such as endotoxin shock and inflammatory diseases. Inhibition of NO is viewed as a useful way to control such detrimental inflammation (2,3).
The expression of iNOS is stimulated by many factors including bacterial infections, lipopolysaccharide (LPS) and pro-inflammatory cytokines (IL-1, IL-6, TNFα and IFNγ) (2). Anti-inflammatory cytokines including IL-10, TGFβ and IL-4 along with glucocorticoids are negative regulators of iNOS expression (2). The different inducers and suppressors of iNOS expression have been shown to activate different signaling pathways. However, in general, the activation or inhibition of the nuclear factor kappaB (NF-κB) and/or the janus kinase/signal transducer and activator of transcription (JAK/STAT) is the central mechanism explaining the effects of many different mediators (4).
Corticosteroids are potent anti-inflammatory molecules that are extensively used for the treatment of many inflammatory and immune diseases and conditions (5). This occurs in part through inhibition of the synthesis of pro-inflammatory cytokines and enzymes, including iNOS (6,7). These anti-inflammatory effects of corticosteroids occur via the repression of the functioning of other transcription factors. In the case of NF-κB, deactivation may occur either by direct capture of NF-κB by ligand-activated glucocorticoid receptor, up-regulation of its inhibitor IkBα, inhibition of nuclear translocation of NF-κB, or inhibition of NF-κB transactivation activity (8–10). Both in vitro and in vivo studies show that glucocorticoids inhibit the expression of iNOS in various inflammatory models (7,9,11). However, most of these studies are at single time points and do not make a quantitative assessment of the overall effects.
Mathematical models have been previously used for describing and understanding the role of NO in inflammation. For example, exhaled NO can be used as a marker to assess airway inflammation and simple two-compartment models were applied to characterize NO exchange dynamics in lungs (12). Similarly, mathematical models have been used by our group and others to characterize effects of therapeutic drugs on inflammatory cytokine-mediated NO responses (13,14).
This study examines the dynamics of lung iNOS mRNA expression and plasma NO after LPS-induced acute inflammation in rats along with the disposition kinetics and effects of two dose levels of MPL on these processes. In addition, nitrates were dosed to a separate cohort of animals to delineate the disposition kinetics of NO. A mechanism-based PK-PD model was developed to quantitatively assess the disposition kinetics of MPL and NO and the dynamics of the inflammatory processes involved.
MATERIALS AND METHODS
Animals
Male Lewis rats (225–250 g) were purchased from Harlan (Indianapolis, IN). Animals were housed in 12 h light/12 h dark, constant temperature (22 °C) room where they were acclimatized for at least 1 week prior to studies. Animals were subjected to right jugular vein cannulation and allowed to recover overnight before experiments. Our research protocol adheres to the `Principles of Laboratory Animal Care' (NIH publication 85–23, revised in 1985) and was approved by the University at Buffalo Institutional Animal Care and Use Committee.
Materials
Lipopolysaccharide from Escherichia coli serotype 111:B8 and sodium nitrate were purchased from Sigma (St. Louis, MO). Methylprednisolone succinate (Solu-Medrol) was purchased from Pharmacia & Upjohn (Kalamazoo, MI). The LPS and MPL were dissolved in sterile saline before dosing.
Experimental Design
The primary study included three treatment arms: LPS (50 μg/kg) only, LPS and 10 mg/kg MPL, and LPS and 50 mg/kg MPL. The LPS and MPL were administered IV almost simultaneously (within 30 s). A group of non-MPL-dosed animals served as controls. Rats were sacrificed at various time points; blood was collected, centrifuged for plasma and stored at −80 °C. Separate blood samples were collected for cell counting. Lungs were harvested and flash frozen in liquid nitrogen and stored at −80 °C. In addition, 750 μmol/kg of sodium nitrate was given intravenously to a separate group of 4 rats. Blood samples were collected over 12 h, centrifuged for plasma, and stored at −80 °C.
Kinetic Measurements
Plasma concentrations of MPL and corticosterone (CST) were measured by a validated HPLC assay (15). The assay was linear from 5 to 1000 ng/mL with inter- and intra-day coefficients of variation below 10 %.
Dynamic Measurements
Body temperature of the animals was recorded just before sacrifice (TC-100/TM 99 digital thermometer, Harvard Apparatus, Holliston, MA). Lymphocytes were counted using a Cell-Dyne 1700 instrument (Abbott Laboratories, Abbott Park, IL). Plasma concentrations of NO were measured using an Oxford Biomedical Non-Enzymatic Nitric Oxide kit (Oxford Biomedical, Oxford, MI) with the limit of quantitation of 0.5 μM.
RNA Preparation
Lungs from each animal were ground into a fine powder in a mortar cooled by liquid nitrogen and approximately 100 mg of powder was added to 1 mL of pre-chilled Trizol Reagent (InVitrogen, Carlsbad CA). An external cRNA standard (grg-1) was added to each sample prior to homogenization in order to correct for extraction yield (16,17). Total RNA extractions were carried out according to manufacturer's directions. Final RNA preparations were resuspended in RNase-free water and stored at −80 °C. The RNAs were quantified spectrophotometrically, and purity and integrity assessed by agarose gel electrophoresis. All samples exhibited 260/280 absorbance ratios of approximately 2.0, and all showed intact ribosomal 28S and 18S RNA bands in an approximate ratio of 2:1 as visualized by ethidium bromide staining.
Kinetic-Based QRTPCR
Kinetic-based QRTPCR assessment of iNOS mRNA was carried out using TaqMan based fluorescent probes in a MX4000 flourescence-based thermocycler (Stratagene, La Jolla, CA). A one-tube/two enzyme assay design employed the Brilliant 1-Step Quantitative Core Reagent Kit (Strata-gene) according to manufacturer's directions. The MgCl2 concentrations were 2.5 mM, forward and reverse probe concentrations were 200 nM, and probe concentrations were 100 nM. Probe and primers were designed using PrimerEx-press software (Applied Biosystems, Foster City, CA) and the sequences used shared no homology with other known rat sequences. Probe and primers were custom synthesized by Biosearch Technologies (Novato, CA) and contained a FAM label on the 5′ end and black hole quencher (BHQ1) on the 3′ end. The sequences were as follows: Forward Primer 5′-TGCACAGAATGTTCCAGAATCC-3′, Reverse Primer 5′-CCTCACGTGCTGTGGGC-3′, and Probe 5′-ACAAGCTGCATGTGACTCCATCGACC-3′. Amplicon length was 70 bp. Signals were quantified against cRNA standards prepared from a 433 bp region cloned into pGEM 3Z (Promega, Madison, WI) and were prepared by in vitro transcription using T7 Megascript kits (Ambion, Austin, TX). Samples were normalized to the amount of external standard cRNA recovered, measured by real time QRTPCR (17). Seven cRNA standards were run concurrently on the same plate in duplicate with tissue RNA samples, which were run in triplicate. Reverse transcriptase minus controls were also run on the same plate for each sample to test for possible genomic contamination of RNA samples and in all cases gave no measurable amplification signal. Intra- and inter-assay coefficients of variation were below 18 %.
Pharmacokinetic/Pharmacodynamic Modeling
Figure 1 depicts the schematic of the integrated PK-PD model that describes the disposition of plasma MPL and NO and the dynamic changes in the iNOS mRNA expression in lung and NO concentrations in plasma.
Fig. 1.

Model schematic for the effects of LPS and MPL on iNOS mRNA expression and plasma NO dynamics. Boxes reflects stimulation (▯) and inhibition of production rate ( ) of iNOS mRNA. The model is described by Eqs. 1–6 with symbols defined in Table I.
Plasma MPL concentrations after 10 and 50 mg/kg doses were assessed simultaneously and a two-compartment PK model with linear elimination was used:
| (1) |
| (2) |
where plasma MPL concentration (CMPL) is MPLC/VC, MPLC and MPLP are amounts in the central and peripheral compartments, CL is the systemic clearance, CLD is the inter-compartmental clearance, and VC and VP are the volumes of the central and peripheral compartments.
Based on the mechanism of action of LPS and glucocorticoids on iNOS expression, dynamic changes in iNOS mRNA concentrations were modeled using an indirect response model with LPS stimulating the production of iNOS and MPL inhibiting the production (8–10).
| (3a) |
| (3b) |
where kin represents the zero-order production rate of iNOS mRNA and kout, the first-order degradation of iNOS mRNA. LPS reflects the effect of LPS administration on induction of iNOS mRNA. However, the effects of LPS last only for a certain amount of time which was fixed as 1.8 h based on the iNOS mRNA expression profiles which peaks at 2 h (observed) after LPS dosing in all three groups of animals. MPL has a concentration-dependent effect on the production of iNOS mRNA with Imax reflecting maximum inhibition and IC50 is the MPL concentration that produces 50 % reduction in iNOS mRNA expression. The baseline iNOS mRNA concentration () was fixed as 2 fmol/g from the observed data in the control animals.
The dynamic changes in plasma NO concentrations were modeled with a precursor-pool indirect response model, with NO showing two-compartment distribution with linear systemic elimination. The following equations describe the NO components:
| (4) |
| (5) |
| (6) |
where , , and represent NO amounts in the precursor, central, and peripheral compartments. Plasma concentration of NO () is . The NO is produced by two different production processes, with as the constitutive production of NO by other isoforms of NOS and kS is the production of NO by iNOS. Because of the technical challenges involved in the quantitative measurement of iNOS protein concentrations, iNOS mRNA concentrations were used as the factor driving NO production in the precursor compartment. The γ is an amplification factor in the production of NO from the mRNA. The value of γ was fixed as 1.8 h and was obtained from preliminary modeling runs. Fitting of γ resulted in inflated CV% of other parameters. The represents the first-order transfer rate constant of NO from the precursor to the central compartment. The is the systemic clearance of NO and , the distribution clearance between compartments. The and are the volumes of distribution of NO in the central and peripheral compartments. The and values (secondary parameters) were estimated as and using the steady-state assumption where changes in NO in both the precursor and the central compartment are zero. The baseline NO concentration in the central compartment was fixed as 22 μM.
Data Analysis
ADAPT 5 was used for all data fittings and simulations (18). Replicate data from multiple animals in each experiment were pooled and data from all groups (LPS only, LPS + 10 mg/kg MPL and LPS + 50 mg/kg MPL) were modeled simultaneously. The goodness-of-fit was assessed by model convergence, visual inspection of the fitted curves, Akaike Information Criterion (AIC), examination of residuals, and CV% of the estimated parameters. The area under the effect curve (AUEC) was calculated from model predictions with the WinNonlin program (version 5.2; Pharsight, Mountain View, CA).
RESULTS
Pharmacokinetics of MPL
The plasma concentrations of MPL after IV administration of 10 and 50 mg/kg doses along with LPS followed a bi-exponential decline as shown in Fig. 2. A two-compartment model with linear systemic elimination was able to describe both the low and high dose profiles. The systemic clearance was 7.274 L/h/kg and the distribution clearance was 1.427 L/h/kg. Central volume of distribution was 0.925 L/kg, and steady-state volume of distribution was 1.96 L/kg. All parameters had low CV% of less than 30 % (Table I).
Fig. 2.

Pharmacokinetics of MPL for 10 (□) and 50 mg/kg (●) doses. Dashed and solid lines represent model fittings for 10 and 50 mg/kg MPL dosing.
Table I.
Parameter Values for the PK-PD Model
| Parameter | Definition | Estimate | CV% |
|---|---|---|---|
| MPL Pharmacokinetics | |||
| CL (L/hr/kg) | Systemic clearance | 7.274 | 15.1 |
| CLD (L/hr/kg) | Distribution clearance | 1.427 | 29.8 |
| Vc (L/kg) | Central volume of distribution | 0.925 | 27.8 |
| Vp (L/kg) | Peripheral volume of distribution | 1.035 | 26.9 |
| iNOS mRNA dynamics | |||
| Lps | Stimulation of iNOS mRNA by LPS | 156.7 | 2.71 |
| kout(h−1) | Elimination constant of iNOS mRNA | 0.472 | 1.43 |
| Imax | Maximum inhibition of iNOS by MPL | 0.728 | 4.51 |
| IC50 (ng/mL) | 50 % inhibition of iNOS by MPL | 285.2 | 20.8 |
| TLPS | Duration of LPS effects on iNOS | 1.8 | Fixed |
| iNOS mRNA(0) (fmol/g) | Baseline iNOS mRNA Concentration | 2 | Fixed |
| NO Kinetics and dynamics | |||
| kS (μmole/hr) | Production of NO from iNOS mRNA | 0.068 | 7.69 |
| NOpre(0) (μmole) | Baseline amount of precursor NO | 39.77 | 12.7 |
| CLNO (L/h/kg) | Systemic clearance for NO | 0.161 | 3.71 |
| VCNO (L/kg) | Central volume of distribution for NO | 0.469 | 3.64 |
| VPNO (L/kg) | Peripheral volume of distribution for NO | 0.276 | 20.3 |
| CLDNO (L/hr/kg) | Distribution clearance for NO | 0.1 15 | 21.8 |
| ˠ | Amplification factor | 1.8 | Fixed |
| CNO(0) (μM) | Baseline NO concentration in plasma | 22 | Fixed |
iNOS mRNA Expression in Lung
The effect of LPS with or without MPL on lung iNOS mRNA expression is shown in Fig. 3. The baseline iNOS mRNA concentrations were around 2 fmol/g and LPS dosing resulted in a robust increase in mRNA expression with the peak concentrations reaching 165 fmol/g at around 2 h, and eventually returning to the baseline at around 10 h. MPL dosing along with LPS resulted in the inhibition of iNOS expression induced by LPS. These effects were dose-dependent with peak iNOS mRNA reduced to 124 fmol/g when dosed with 10 mg/kg of MPL and 86.2 fmol/g with 50 mg/kg MPL. The area under effect curve (AUEC) estimate for iNOS mRNA expression was 564.1 fmol.h for the LPS-only group while the AUEC in 10 and 50 mg/kg MPL groups were reduced to 398.9 and 272.3 fmol.h. The indirect response model with stimulation in production of iNOS mRNA by LPS and concentration-dependent inhibition by MPL captured the changes in iNOS mRNA profiles well. The estimates of parameters governing these processes are given in Table I. The degradation rate of iNOS mRNA was 0.472 h−1 (1.43 CV%). The stimulation constant of iNOS mRNA by LPS was 156.7 (2.71 CV%) which occurs for the first 1.8 h after LPS dosing. The maximum inhibition of iNOS mRNA expression by MPL (Imax) was 0.73 (4.51 CV%) and IC50 was 285.2 ng/mL (20.8 CV%).
Fig. 3.
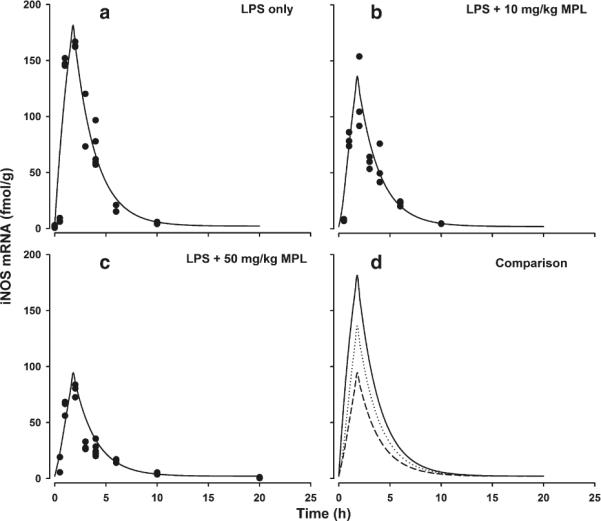
Time course of iNOS mRNA expression in lungs after LPS alone (a), LPS + 10 mg/kg MPL (b) and LPS + 50 mg/kg MPL (c). Symbols (●) are actual data and solid lines represent model fitting. Panel D provides direct comparison of model predictions for all three groups. Solid line is LPS alone, dotted line is LPS + 10 mg/kg MPL and dashed line is LPS + 50 mg/kg MPL fittings.
NO Disposition Kinetics and Dynamics
The basal plasma NO concentrations averaged 22 μM. As shown in Fig. 4, LPS dosing increased plasma NO concentrations after an initial lag phase of around 1–2 h, with peak plasma concentrations reaching around 148 μM at around 10 h. The MPL dosing produced a robust reduction in NO concentrations with peak plasma concentrations reduced to 91 μM with 10 and 58 μM with 50 mg/kg MPL dosing. The AUEC values for NO increasing above the baseline were 2839 μM ·h for LPS only, 1565 μM ·h for LPS + 10 mg/kg MPL, and 805 μM·h for LPS + 50 mg/kg MPL dosing. To differentiate the production and disposition kinetics of NO, 750 μmole/kg of sodium nitrate was given to a separate cohort of healthy rats. As shown in Fig. 5, plasma NO concentrations after nitrate dosing showed a bi-exponential decline yielding the two-compartment parameters listed in Table I.
Fig. 4.
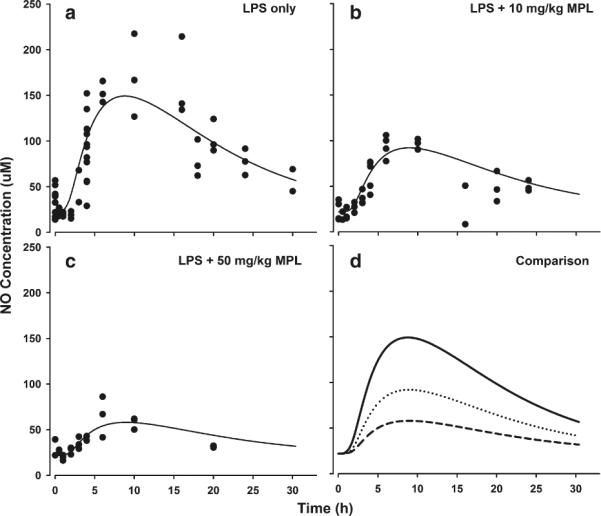
Time course of plasma NO concentrations after LPS alone (a), LPS + 10 mg/kg MPL (b) and LPS + 50 mg/kg MPL (c). Symbols and lines are as defined in Fig. 3.
Fig. 5.

Disposition kinetics of NO after IV dosing of 750 μmol/kg sodium nitrate. Symbols (●) depict actual plasma concentrations and lines represent the model fitting.
Based on the mechanism of action of LPS and MPL on NO production, a precursor-pool based indirect response model was used to link the changes in iNOS mRNA concentrations to changes in plasma NO concentrations. As shown in Fig. 4, the model was able to capture the changes in NO quite well. As shown in Table I, the production rate constant of NO from iNOS was 0.068 μmoles/h (7.69 CV%). The systemic clearance of NO () was 0.161 L/h/kg (3.71 CV%). The and were 0.469 and 0.745 L/kg. The was 0.115 L/h/kg. The transfer rate constant of NO from the precursor compartment to the central compartment (0.089 h−1) and the production rate constant of NO from other NOS sources (3.471 μmol/h) were calculated as secondary parameters.
Other Physiological Effects
The average body temperature of the normal rats was 37.0 ±0.5 °C. After LPS dosing, the body temperature showed a slight rise at 0.5 h followed by decrease at 1 h and another increase until 6 h, returning back to normal by 10 h (Fig. 6). Body temperatures of the animals receiving LPS + MPL followed the same general pattern. All three profiles were overlapping.
Fig. 6.

Time course of mean (±SD) body temperature (a), lymphocyte counts (b), and plasma corticosterone concentrations (c) after LPS alone (◆), LPS + 10 mg/kg MPL (■) and LPS + 50 mg/kg MPL (▲).
The baseline blood lymphocyte number in control animals was 4.82±0.63 103 cells/μL. This increased at 0.5 h and then decreased markedly at 1 h reaching minimum values between 1 and 2 103 cells/μL at 2 h for all groups (Fig. 6). The lymphocytes stayed low until 10 h, and then slowly returned to normal by 20 h. The profiles after all three treatments were similar and overlapping.
Initial plasma corticosterone concentrations in control animals averaged 200 ng/ml. This increased significantly above the baseline following LPS, peaking around 1 h, and returned close to the baseline by 3–4 h (Fig. 6). The 50 mg/kg MPL dose produced a small attenuation of this increase while the 10 mg/kg MPL and LPS-only curves were overlapping.
DISCUSSION
The pharmacological effects of anti-inflammatory and immunomodulating agents are commonly studied with the use of LPS which at lower doses provokes acute inflammatory responses whereas at high doses causes a severe shock syndrome (19). We examined the inflammatory response that was induced by a 50 μg/kg IV dose of LPS. This LPS dosing did not affect the PK parameters of MPL in rats as the values in Table I were generally similar to those reported for normal animals dosed with 10 mg/kg MPL (20). We found a slightly lower clearance of 7.27 L/h/kg and VC of 0.93 L/kg versus previously reported 10.5 L/h/kg, and 1.19 L/kg. The VSS was 1.96 here vs 2.22 L/kg. Previously a study with prednisolone showed that chronic but not acute inflammation altered its pharmacokinetics in rats (21).
The iNOS and NO produced by iNOS are usually elevated in many inflammatory and auto-immune diseases and are implicated in their pathophysiology (1,3). For example, increased iNOS expression and elevated NO production is observed in many inflammatory diseases of the respiratory tract including asthma, acute respiratory distress syndrome and bronchiectasis (1,22,23). Similarly, iNOS and NO are elevated in diseases like rheumatoid arthritis, inflammatory bowel disease, pelvic inflammatory disease and periodontitis and are implicated in the pathogenesis of these conditions (1,24–26). In addition, inhibition of iNOS activity and suppression in NO production in some of these conditions were found to ameliorate the disease. Inhibitors like NG-monomethyl-L-arginine (LNMMA), NG-nitro-L-arginine methyl ester (L-NAME) and aminoguanidine (AG) are potential compounds that can be used therapeutically for treating inflammatory diseases (1,24). Furthermore, inhibition of iNOS expression is considered to be one of the several mechanisms by which corticosteroids exert their anti-inflammatory effects (6,7).
Mathematical models studying NO's role in inflammation have enhanced the interpretation of whole animal in vivo data. Pulmonary NO exchange serves as a noninvasive means of assessing lung inflammation. Models have accounted for partitioning of exhaled NO into airway and alveolar sources and improve the assessment of altered NO exchange dynamics that differentially impact these regions of the lungs (12). Veszelovski et al. (13) modeled turnover of NO in mice after stimulation by flavone-8-acetic acid (FAA). Their model related the production of TNFα in response to FAA, the enhancement of iNOS activity in response to TNFα, and the elevation of plasma nitrate in response to NO production. Chakraborty et al. (14) used PK/PD modeling to describe interactions between recombinant mouse interleukin-10 and prednisolone in LPS–induced endotoxemia in mice using an induction model. The production of NO was described as a cascading consequence of two pro-inflammatory cytokines TNFα and IFNγ plasma concentrations. All three inflammatory markers were inhibited by 25 mg/kg prednisolone alone or in combination with IL-10.
In this study, iNOS mRNA and circulating NO concentrations were directly measured. Both were elevated after LPS with iNOS peaking at around 2 h and NO around 10 h. The delay in the induction of iNOS mRNA expression by LPS was modeled using a simple indirect response model. The further delay in the elevation of plasma NO arises from gene expression and protein synthesis of iNOS followed by generation of NO from L-arginine that is then converted to its stable nitrate and nitrite products. These intermediate steps are reflected in the NO precursor compartment. A special feature of our study is the utilization of pharmacokinetic data for exogenous sodium nitrate as the basis for modeling plasma NO concentrations. This permits assignment of a more specific two-compartment model structure for NO. The plasma NO concentrations reached after exogenous dosing (the later time points) were comparable to the plasma concentrations reached in the LPS alone and LPS + MPL dosing groups. This allowed us to model all of these data simultaneously to obtain a single set of reliable parameter estimates. In addition, AUC values reveal (from Amount 0 CLNO · AUC) that 457 μmol/kg of NO was formed in the LPS only experiment, but was reduced to 252 and 130 μmol/kg after 10 and 50 mg/kg methylprednisolone. These doses of MPL are consistent with those found to produce diverse cell trafficking and immunosuppressive effects (14,27) in our previous studies and reflect strong but not overly large doses for rats.
During the first 30 min after LPS injection, a slightly higher body temperature and increased number of lymphocytes in blood were the earliest observed inflammatory responses. The number of these inflammatory cells then decreased, probably due to the surge of endogenous CST. The 2.5-fold increase of plasma CST seen 30 min after LPS administration is part of the feedback mechanism to the endotoxin effects and is thought to occur by cytokine stimulation of corticosteroid-releasing hormone production (28). The CST concentrations are opposite those seen in normal, healthy rats as CST is usually at a nadir in the morning (29). The observed time course of induced CST was similar to findings in rats after low doses of LPS (30). Surprisingly, this response was barely affected by the 50 mg/kg dose of MPL. Similar but more profound changes in rats given dexamethasone have been described by Hawes et al. (31). Dexamethasone has also been shown to lower core body temperatures after LPS treatment in pigs (32). This effect was not very pronounced with MPL, although the 50 mg/kg dose seemed to stabilize the temperature around normal when compared to the curves from the other treatments.
In general, activation of NF-κB and STAT and thereby activation of the iNOS promoter seems to be an essential step in regulation of iNOS expression in most cells (4,33). However, post-transcriptional mechanisms such as stabilization of iNOS mRNA may also be involved. In our model selection process, we tested several models based on post-transcriptional mechanisms, where degradation of mRNA was inhibited by LPS (results not shown). These models were decidedly inferior. While it is indeed possible that parallel mechanisms of regulating iNOS expression and activity may occur in the body, invoking any joint effects (stimulation of production combined with inhibition of degradation) would mean over-parameterization with no hope of success for reliable parameter estimation. The final model that best characterized and was applied to our data entailed stimulation of mRNA production by LPS and inhibition of both normal and LPS-stimulated production by MPL.
Our results demonstrate that MPL suppresses LPS stimulated iNOS mRNA production in a concentration-dependent manner resulting in proportional decreases in NO plasma concentrations. Although additional post-transcriptional mechanisms have been shown in cell culture systems (34,35), the transcriptional pathway appears to be a major contributor to glucocorticoid inhibition of iNOS and likely other pro-inflammatory enzymes and cytokines (8–10).
In conclusion, MPL decreased LPS-induced expression and activity of iNOS in this acute inflammation model in rats, supporting the hypothesis that a significant part of iNOS regulation occurs at the level of transcription. The integrated PK-PD model successfully described the experimental data and provides a useful rationalization of corticosteroid inhibition of one pathway of acute inflammation.
ACKNOWLEDGMENTS & DISCLOSURES
This work was supported by grant GM24211 from the National Institutes of Health.
REFERENCES
- 1.Zamora R, Vodovotz Y, Billiar TR. Inducible nitric oxide synthase and inflammatory diseases. Mol Med. 2000;6:347–73. [PMC free article] [PubMed] [Google Scholar]
- 2.Shahand NS, Billiar TR. Role of nitric oxide in inflammation and tissue injury during endotoxemia and hemorrhagic shock. Environ Health Perspect. 1998;106(Suppl 5):1139–43. doi: 10.1289/ehp.98106s51139. [DOI] [PMC free article] [PubMed] [Google Scholar]
- 3.Pacher P, Beckman JS, Liaudet L. Nitric oxide and peroxynitrite in health and disease. Physiol Rev. 2007;87:315–424. doi: 10.1152/physrev.00029.2006. [DOI] [PMC free article] [PubMed] [Google Scholar]
- 4.Kleinert H, Schwarz PM, Forstermann U. Regulation of the expression of inducible nitric oxide synthase. Biol Chem. 2003;384:1343–64. doi: 10.1515/BC.2003.152. [DOI] [PubMed] [Google Scholar]
- 5.Newton R. Molecular mechanisms of glucocorticoid action: what is important? Thorax. 2000;55:603–13. doi: 10.1136/thorax.55.7.603. [DOI] [PMC free article] [PubMed] [Google Scholar]
- 6.Di Rosa M, Radomski M, Carnuccio R, Moncada S. Glucocorticoids inhibit the induction of nitric oxide synthase in macrophages. Biochem Biophys Res Commun. 1990;172:1246–52. doi: 10.1016/0006-291x(90)91583-e. [DOI] [PubMed] [Google Scholar]
- 7.Khanduja KL, Kaushik G, Khanduja S, Pathak CM, Laldinpuii J, Behera D. Corticosteroids affect nitric oxide generation, total free radicals production, and nitric oxide synthase activity in monocytes of asthmatic patients. Mol Cell Biochem. 2011;346:31–7. doi: 10.1007/s11010-010-0588-1. [DOI] [PubMed] [Google Scholar]
- 8.Kleinert H, Euchenhofer C, Ihrig-Biedert I, Forstermann U. Glucocorticoids inhibit the induction of nitric oxide synthase II by down-regulating cytokine-induced activity of transcription factor nuclear factor-kappa B. Mol Pharmacol. 1996;49:15–21. [PubMed] [Google Scholar]
- 9.De Vera ME, Taylor BS, Wang Q, Shapiro RA, Billiar TR, Geller DA. Dexamethasone suppresses iNOS gene expression by upregulating I-kappa B alpha and inhibiting NF-kappa B. Am J Physiol. 1997;273:G1290–6. doi: 10.1152/ajpgi.1997.273.6.G1290. [DOI] [PubMed] [Google Scholar]
- 10.Jeon YJ, Han SH, Lee YW, Yea SS, Yang KH. Inhibition of NF-kappa B/Rel nuclear translocation by dexamethasone: mechanism for the inhibition of iNOS gene expression. Biochem Mol Biol Int. 1998;45:435–41. doi: 10.1080/15216549800202822. [DOI] [PubMed] [Google Scholar]
- 11.Linehan JD, Kolios G, Valatas V, Robertson DA, Westwick J. Effect of corticosteroids on nitric oxide production in inflammatory bowel disease: are leukocytes the site of action? Am J Physiol Gastrointest Liver Physiol. 2005;288:G261–7. doi: 10.1152/ajpgi.00336.2004. [DOI] [PubMed] [Google Scholar]
- 12.George SC, Hogman M, Permutt S, Silkoff PE. Modeling pulmonary nitric oxide exchange. J Appl Physiol. 2004;96:831–9. doi: 10.1152/japplphysiol.00950.2003. [DOI] [PubMed] [Google Scholar]
- 13.Veszelovsky E, Holford NH, Thomsen LL, Knowles RG, Baguley BC. Plasma nitrate clearance in mice: modeling of the systemic production of nitrate following the induction of nitric oxide synthesis. Cancer Chemother Pharmacol. 1995;36:155–9. doi: 10.1007/BF00689201. [DOI] [PubMed] [Google Scholar]
- 14.Chakraborty A, Yeung S, Pyszczynski NA, Jusko WJ. Pharmacodynamic interactions between recombinant mouse interleukin-10 and prednisolone using a mouse endotoxemia model. J Pharm Sci. 2005;94:590–603. doi: 10.1002/jps.20257. [DOI] [PMC free article] [PubMed] [Google Scholar]
- 15.Haughey DB, Jusko WJ. Analysis of methylprednisolone, methylprednisone and corticosterone for assessment of methylprednisolone disposition in the rat. J Chromatogr. 1988;430:241–8. doi: 10.1016/s0378-4347(00)83159-x. [DOI] [PubMed] [Google Scholar]
- 16.DuBois DC, Almon RR, Jusko WJ. Molar quantification of specific messenger ribonucleic acid expression in northern hybridization using cRNA standards. Anal Biochem. 1993;210:140–4. doi: 10.1006/abio.1993.1164. [DOI] [PubMed] [Google Scholar]
- 17.Samtani MN, Pyszczynski NA, Dubois DC, Almon RR, Jusko WJ. Modeling glucocorticoid-mediated fetal lung maturation: II. Temporal patterns of gene expression in fetal rat lung. J Pharmacol Exp Ther. 2006;317:127–38. doi: 10.1124/jpet.105.095869. [DOI] [PubMed] [Google Scholar]
- 18.D'Argenio D, Schumitzky A, Wang X. ADAPT 5 user's guide: pharmacokinetic/pharmacodynamic systems analysis software. Biomedical Simulations Resource; Los Angeles: 2009. [Google Scholar]
- 19.Lazaron V, Dunn DL. Molecular biology of endotoxin antagonism. World J Surg. 2002;26:790–8. doi: 10.1007/s00268-002-4054-4. [DOI] [PubMed] [Google Scholar]
- 20.Mishina EV, Jusko WJ. Liposomal methylprednisolone in rats: dose-proportionality and chronic-dose pharmacokinetics/pharmacodynamics. Pharm Res. 1996;13:141–5. doi: 10.1023/a:1016054022750. [DOI] [PubMed] [Google Scholar]
- 21.Garg V, Hon YY, Jusko WJ. Effects of acute and chronic inflammation on the pharmacokinetics of prednisolone in rats. Pharm Res. 1994;11:541–4. doi: 10.1023/a:1018966516195. [DOI] [PubMed] [Google Scholar]
- 22.Sanders SP. Nitric oxide in asthma. Pathogenic, therapeutic, or diagnostic? Am J Respir Cell Mol Biol. 1999;21:147–9. doi: 10.1165/ajrcmb.21.2.f158. [DOI] [PubMed] [Google Scholar]
- 23.van der Vliet A, Eiserich JP, Cross CE. Nitric oxide: a pro-inflammatory mediator in lung disease? Respir Res. 2000;1:67–72. doi: 10.1186/rr14. [DOI] [PMC free article] [PubMed] [Google Scholar]
- 24.Cross RK, Wilson KT. Nitric oxide in inflammatory bowel disease. Inflamm Bowel Dis. 2003;9:179–89. doi: 10.1097/00054725-200305000-00006. [DOI] [PubMed] [Google Scholar]
- 25.Sioutas A, Ehren I, Lundberg JO, Wiklund NP, Gemzell-Danielsson K. Intrauterine nitric oxide in pelvic inflammatory disease. Fertil Steril. 2008;89:948–52. doi: 10.1016/j.fertnstert.2007.04.018. [DOI] [PubMed] [Google Scholar]
- 26.Menaka KB, Ramesh A, Thomas B, Kumari NS. Estimation of nitric oxide as an inflammatory marker in periodontitis. J Indian Soc Periodontol. 2009;13:75–8. doi: 10.4103/0972-124X.55842. [DOI] [PMC free article] [PubMed] [Google Scholar]
- 27.Yao Z, DuBois DC, Almon RR, Jusko WJ. Pharmacokinetic/pharmacodynamic modeling of corticosterone suppression and lymphocytopenia by methylprednisolone in rats. J Pharm Sci. 2008;97:2820–32. doi: 10.1002/jps.21167. [DOI] [PMC free article] [PubMed] [Google Scholar]
- 28.Beishuizen A, Thijs LG. Endotoxin and the hypothalamo-pituitary-adrenal (HPA) axis. J Endotoxin Res. 2003;9:3–24. doi: 10.1179/096805103125001298. [DOI] [PubMed] [Google Scholar]
- 29.Sukumaran S, Almon RR, DuBois DC, Jusko WJ. Circadian rhythms in gene expression: relationship to physiology, disease, drug disposition and drug action. Adv Drug Deliv Rev. 2010;62:904–17. doi: 10.1016/j.addr.2010.05.009. [DOI] [PMC free article] [PubMed] [Google Scholar]
- 30.Givalois L, Dornand J, Mekaouche M, Solier MD, Bristow AF, Ixart G, et al. Temporal cascade of plasma level surges in ACTH, corticosterone, and cytokines in endotoxin-challenged rats. Am J Physiol. 1994;267:R164–70. doi: 10.1152/ajpregu.1994.267.1.R164. [DOI] [PubMed] [Google Scholar]
- 31.Hawes AS, Rock CS, Keogh CV, Lowry SF, Calvano SE. In vivo effects of the antiglucocorticoid RU 486 on glucocorticoid and cytokine responses to Escherichia coli endotoxin. Infect Immun. 1992;60:2641–7. doi: 10.1128/iai.60.7.2641-2647.1992. [DOI] [PMC free article] [PubMed] [Google Scholar]
- 32.Parrott RF, Vellucci SV, Goode JA, Lloyd DM, Forsling ML. Interrelated adrenocortical and neurohypophysial responses associated with fever in endotoxin-treated pigs. Am J Physiol. 1997;273:R1046–52. doi: 10.1152/ajpregu.1997.273.3.R1046. [DOI] [PubMed] [Google Scholar]
- 33.Aktan F. iNOS-mediated nitric oxide production and its regulation. Life Sci. 2004;75:639–53. doi: 10.1016/j.lfs.2003.10.042. [DOI] [PubMed] [Google Scholar]
- 34.Walker G, Pfeilschifter J, Kunz D. Mechanisms of suppression of inducible nitric-oxide synthase (iNOS) expression in interferon (IFN)-gamma-stimulated RAW 264.7 cells by dexamethasone. Evidence for glucocorticoid-induced degradation of iNOS protein by calpain as a key step in post-transcriptional regulation. J Biol Chem. 1997;272:16679–87. doi: 10.1074/jbc.272.26.16679. [DOI] [PubMed] [Google Scholar]
- 35.Shinoda J, McLaughlin KE, Bell HS, Swaroop GR, Yamaguchi S, Holmes MC, et al. Molecular mechanisms underlying dexamethasone inhibition of iNOS expression and activity in C6 glioma cells. Glia. 2003;42:68–76. doi: 10.1002/glia.10200. [DOI] [PubMed] [Google Scholar]