

Abstract
Background and Scope
New data are presented on the distribution and frequency of self-sterility (SS) – predominantly pre-zygotic self-incompatibility (SI) systems – in flowering plants and the hypothesis is tested that families with self-sterile taxa have higher net diversification rates (DRs) than those with exclusively self-compatible taxa using both absolute and relative rate tests.
Key Results
Three major forms of SI systems (where pollen is rejected at the stigmatic, stylar or ovarian interface) are found to occur in the oldest families of flowering plants, with times of divergence >100 million years before the present (mybp), while post-fertilization SS and heterostyly appear in families with crown ages of 81 and 87 mybp, respectively. It is also founnd that many (22) angiosperm families exhibit >1 SI phenotype and that the distribution of different types of SS does not show strong phylogenetic clustering, collectively suggesting that SS and SI systems have evolved repeatedly de novo in angiosperm history. Families bearing self-sterile taxa have higher absolute DRs using all available calibrations of the angiosperm tree, and this affect is caused mostly by the high DR of families with homomorphic SI systems (in particular stigmatic SI) or those in which multiple SS/SI phenotypes have been observed (polymorphic). Lastly, using sister comparisons, it is further demonstrated that in 29 of 38 sister pairs (including 95 families), the self-sterile sister group had higher species richness and DR than its self-compatible sister based on either the total number of taxa in the clade with SS or only the estimated fraction to harbour SS based on literature surveys.
Conclusions
Collectively, these analyses point to the importance of SS, particularly pre-zygotic SI in the evolution of flowering plants.
Keywords: Self-sterility, self-incompatibility, breeding system evolution, species richness, diversification rates
INTRODUCTION
The sudden appearance of angiosperms between 160 and 130 million years before the present (mybp) was followed by two major radiations between 130 and 90 mybp that established all major lineages including the basal angiosperms, magnoliids, monocots, eudicots and most of the orders included in them (Davies et al., 2004a; Soltis et al., 2005). Research into this extensive and rapid diversification, Darwin's ‘abominable mystery’ (July 22nd, 1879 in Darwin, 1903), has been greatly facilitated by recent molecular systematic studies clarifying the phylogenetic relationships (Mathews and Donoghue, 1999; Soltis et al., 2000, 2011) and age of divergence of angiosperm families and upper hierarchies (Wikström et al., 2001, 2003; Davies et al., 2004a; Bell et al., 2010). In addition to their rapid appearance, the families of flowering plants also differ dramatically in species richness; 8 % of angiosperm families are monospecific while 12 % of families have >1000 species (Soltis et al., 2005; Stevens, 2010 onwards). Differences in species richness among clades are affected by long-term macro-evolutionary changes such as plate tectonics, climate change and/or episodic catastrophic events (extrinsic factors) and by the presence of traits that affect the speciation and extinction probabilities of species in micro- and macro-evolutionary time scales (intrinsic factors) (Guyer and Slowinski, 1993; Slowinski and Guyer, 1993; Purvis, 1996). There is strong paleontological evidence that rates of speciation and extinction have changed over geological time (Stanley, 1979; Raup and Sepkoski, 1984; Erwin and Anstey, 1995; Niklas, 1997; Jablonski, 2007), and molecular phylogenetic analyses of extant groups indicate that climate change and other physical (extrinsic) factors are associated with shifts in diversification rate (DR hereafter) in the recent past (Erwin and Anstey, 1995; Zink and Slowinski, 1995; Kadereit et al., 2004).
Differences in DR among lineages (Dial and Marzluff, 1989; Slowinski and Guyer, 1993; Nee et al., 1996; Magallón and Sanderson, 2001) have also been associated with the evolution of key traits that change the per lineage rate of speciation (Barraclough et al., 1995; Heard and Hauser, 1995; Sims and McConway, 2003; Davies et al., 2004a). Using sister comparisons or relative rate tests, studies have identified that biotic pollination (Eriksson and Bremer, 1992; Dodd et al., 1999; Kay et al., 2008), biotic fruit dispersal (Ricklefs and Renner, 1994; Wing and Boucher, 1998), herbaceous growth habit (Dodd et al., 1999), polymorphic growth habit (Ricklefs and Renner, 1994), floral nectar spurs (Hodges and Arnold, 1995; Hodges, 1997; Kay et al., 2008) and bilateral symmetry (Sargent, 2004) have all been associated with high DRs. There is also evidence that the presence of genetically determined pre-zygotic mate-recognition systems [self-incompatibility (SI)] can affect the DR of lineages (Goldberg et al., 2010). In angiosperms the male gametophyte, the pollen tube, must make intimate contact with the female sporophyte to achieve its goal of growing to the ovule from the site of pollen adhesion and hydration on the stigmatic surface. This pathway opens the door for selection to influence pre-zygotic molecular interactions between male and female reproductive tissues and has resulted in the evolution of diverse intraspecific mate-recognition systems that promote outcrossing and are now widespread in angiosperms (Swanson et al., 2004; Hiscock and Allen, 2008).
Approximately 40 % (Igic et al., 2008) to 50 % (Brewbaker, 1959; Weller et al., 1995) or 60 % (East, 1940; Hiscock and Kües, 1999; Nettancourt, 2001) of angiosperm taxa have been estimated to have such genetically based SI systems. SI is sometimes controlled by the gene products of a single locus, the S-locus, which is composed of at least two tightly linked genes, one of which is expressed in the male gametophyte while the other is expressed in the pistil (Kubo et al., 2010). After pollination, the S-locus protein(s) present in the male gametophyte interact with those expressed in the pistil: if the two proteins recognize each other as belonging to the same haplotype, a series of molecular signalling pathways is initiated which prevents fertilization by causing pollen-tube rejection at either the stigmatic, stylar or ovarian interface (Nettancourt, 2001). The exceptions to this simplest scenario for SI are the multi-locus systems characterized in the grasses (Li et al., 1997) Caryophyllales, Ranunculales and Solanales (Lundqvist, 1975), and the putative supergene that controls the suite of traits associated with floral di- and tri-morphisms in heterostylous taxa (Barrett and Shore, 2008; Cohen, 2010). Thus, SI systems are distinguished based on (a) the presence of heteromorphy/homomorphy, (b) the site of expression of SI (i.e. stigma, style, ovary) and (c) the genetic control of SI depending on whether one or multiple loci control SI and whether the S-phenotype of the pollen is based on the genotype of the pollen-producing sporophyte – sporophytic SI (SSI) – or the male gametophyte pollen tube – gametophytic SI (GSI) (Nettancourt, 2001; Allen and Hiscock, 2008). Homomorphic SI has been estimated to occur in at least 90 of the 445 angiosperm families (Gibbs, 1986; Charlesworth, 1995; Steinbachs and Holsinger, 2002), and heteromorphy in 28 families (Barrett and Shore, 2008). Recent reviews of the phylogenetic distribution of SI conclude that it has evolved de novo many times (Allen and Hiscock, 2008; Igic et al., 2008) and that SI or another form of self-sterility (SS) may be the ancestral state in basal angiosperms (Allen and Hiscock, 2008). SS is a widespread phenomenon among angiosperms that encompass all cases in which seed-set in a fertile plant after self-pollination is prevented whilst SI has not yet been demonstrated in the species (sensu Allen and Hiscock, 2008).
There are sound theoretical reasons to think that the presence of SS could influence the intrinsic rate of speciation and extinction of lineages, thus causing a difference in the net DR of SS/SI relative to self-compatibility (SC) lineages. For instance it has been shown that species with SI have higher outcrossing rates and maintain larger effective population sizes than SC ones (Wright, 1964; Schierup et al., 2000); selfing taxa generally have smaller effective population sizes, increased rates of fixation of slightly deleterious mutations and lowered rates of fixation of beneficial alleles (Charlesworth, 2003; Wright et al., 2008). Furthermore, self-compatibility (SC) facilitates long-distance dispersal and can be an isolating mechanism because even a single genet is sufficient to establish populations (Baker, 1955; Stebbins, 1957; Grant, 1981). This combination of smaller effective population sizes, higher levels of genetic load and enhanced probability of establishing long-distance colonies, all predict that SC lineages should have higher rates of both speciation and extinction than highly outcrossing and SI taxa (Stebbins, 1957; Grant, 1981; Takebayashi and Morrell, 2001), a finding that has received empirical support (Takebayashi and Morrell, 2001; Goldberg et al., 2010). On the other hand, because of the larger effective size of SI populations, selection will be more effective and populations should maintain higher levels of adaptive genetic variation than SC ones. Thus, compared with SC lineages, rates of speciation are expected to be lower in SI taxa while rates of extinction are expected to be much lower, rendering net DRs to be higher in SI lineages. This effect may be greater for species with homomorphic multi-allelic SI systems compared with those with dimorphic or trimorphic heterostyly, since although both ensure outcrossing, the former should maintain larger effective population sizes because of the strong negative frequency-dependent selection operating in a multi-allelic system (Wright, 1964). Since it is difficult to obtain separate estimates of the rate of speciation and extinction (Rabosky, 2010; but see FitzJohn et al., 2009; Goldberg et al., 2010), in this paper we seek only to examine if the presence of SS in a family affects its net DR using both absolute and relative comparisons of the DR. The goal of this analysis is to look for broad-scale effects of SS/SI on angiosperm diversification.
To this end, we present a new database on the presence, distribution and type of SS in 230 angiosperm families from an updated survey of all 445 angiosperm families as recognized by the Angiosperm Phylogeny Group II (Stevens, 2010 onwards). We then use this dataset to assess whether the different forms of SS are evenly distributed across taxonomic groups and reconstruct the ancestral states of SS on the calibrated angiosperm tree for heuristic purposes. Additionally, using the most recent topology and calibration of the internal nodes of the angiosperm family tree, we calculate the absolute DR of families and perform an analysis of variance (ANOVA) to test whether families that were found to be composed of exclusively SC taxa have lower DRs than those having at least some taxa harbouring unclassified forms of SS, homomorphic SI, heteromorphic SI and/or multiples forms of SS/SI. Lastly, we compare the relative DRs of families differing in the presence and types of SS using sister comparisons while controlling for the relative proportion of taxa estimated to have SS in the family (since families with more SS taxa are expected to have higher DRs). Collectively, these analyses reveal that SS systems, particularly SI, are widely and evenly distributed across angiosperm families, that novel mate recognition (SI) systems evolved early and repeatedly in flowering plants, and that homomorphic and polymorphic SI lineages have maintained higher DRs than SC ones over long evolutionary time.
MATERIALS AND METHODS
Distribution and type of SS across all angiosperm families
Data analyses were conducted on both the presence and type of SS. Data were obtained from Bertin's updated database on dichogamy (Bertin and Newman, 1993; Routley et al., 2004) and from other reviews in the literature (Ganders, 1979; Givnish, 1980; Gibbs, 1986; Weller et al., 1995; Steinbachs and Holsinger, 2002; Allen and Hiscock, 2008) or bibliographic searches. In total, the SS status of 5609 species from the approx. 268 500 known angiosperms representing 230 families and 51 orders of angiosperms was included in the final analysis (database available upon request to the authors). For all analyses, we followed the nomenclature for families and orders given in the Angiosperms Phylogeny Group classification, APG II (Stevens, 2010 onwards), and used the species names given in the International Plant Names Index (www.lib.vt.edu/find/databases/I/inpi-international-plant-name-index.html) and Tropicos org. of the Missouri Botanical Garden (http://www.tropicos.org).
Most studies assessing the breeding system of plants infer the presence of SS and SI from experimental data of fruit and seed-set following hand-pollinations. However, this cannot definitively identify SI because the failure to set seeds after self-pollination can be the result of female and/or male sterility or post-zygotic mechanisms (i.e. early inbreeding depression). Therefore when species are described as self-incompatible based on significant differences in cross- to self-seed-set alone they should be treated as SS instead of self-incompatible (cf. Allen and Hiscock, 2008). We found approx. 120 studies that used microscopic techniques to assess the site of pollen tube rejection following self-pollination (Supplementary Data Appendix S1) and fewer studies that employed reciprocal crosses to elucidate the genetic basis of SI (approx. 40 studies; Supplementary Data Appendix S1). The most difficult form of SI to identify is late-acting SI (LAS), where rejection of self-pollen occurs in the ovary either pre- or post-zygotically (Seavey and Bawa, 1986); LAS is more difficult to detect because it requires detailed microscopic work and remains controversial because it must be distinguished from early-acting inbreeding depression. In pre-zygotically controlled LAS, the pollen enters the micropyle, but fertilization is not completed and the embryo sac degenerates (Sage and Sampson, 2003; Sage et al., 2006). When LAS occurs post-zygotically, the embryo fails to develop after fertilization (Bittencourt and Semir, 2006; Gibbs, 1986; Sage and Sampson, 2003; Fig. 1).
Fig. 1.

Types of self-incompatibility in the angiosperms. (A) Heteromorphic: self-incompatibility (SI) may be associated with heterostyly (morphological variation in anther and stigma heights), such that populations have two (dimorphism) or three (trimorphism) floral morphs that exhibit reciprocal anther–stigma heights. Variation in anther–stigma heights is controlled by a group of linked genes that may also be linked to a locus causing genetic SI in flowers of one of the types described in the right panel. (B–E) Homomorphic: sites of expression of self-incompatibility. SI may occur at (B) the stigmatic surface such that a pollen grain (pg) does not germinate, (C) in the stylar region such that a pollen grain does not reach the ovary (ov) or micropyle (mi), (D) in the ovary – such that the pollen tube cannot penetrate the micropyle (mi) or, if it does, fertilization does not occur (ovarian inhibition) or (E) post-fertilization – if following fertilization, the zygote (zy) and/or endosperm (en) fail to develop.
In our survey of the literature on breeding systems in flowering plants, we classified species as presenting heteromorphy when di- or tri-morphisms in anther and pistil lengths had been reported (Fig. 1A) and as homomorphic when no such variation had been reported. Next, taxa were classified as having (a) self-sterility (SS) if they did not produce seeds following hand self-pollination but did after hand cross-pollination (if some seeds or fruit were produced following hand self-pollination, most studies followed Ruiz-Zapata and Arroyo (1978) and designated a species as self-sterile if the self-incompatibility index was <0·2); or (b) self-compatibility (SC) if the number of seeds set after hand self-pollination did not differ significantly from that set following hand cross-pollination. For some species exhibiting SS, information from microscopic studies was available regarding the site of pollen-tube inhibition (Fig. 1), and these species were further classified based on the SI phenotype. For homomorphic self-incompatible species, the classification was based on whether rejection of self-pollen occurred in the (a) stigma (stigmatic); (b) style (stylar); (c) ovary with syngamy precluded (ovarian); or (d) post-fertilization when self-pollinated flowers synchronously abort zygotes, or there is a lack of embryo development or abscission of flowers or fruits (post-fertilization SS; Fig. 1B–E). Secondly, families showing heteromorphy (Fig. 1A), could be classified as additionally exhibiting SS if hand-pollinations and/or microscopic analyses had demonstrated that self and intramorph pollinations were sterile (Het + SI). Using the seed-set and microscopy data (Supplementary Data Appendix S2), we classified families based on (a) their SS/SC status and (b) their SS/SI phenotype. For the SS/SC status classification, families were classified as showing (a) SC (when all studied species in the family are known to be self-compatible), (b) SI (when one or all members of a family were identified as bearing SI based on microscopy work), (c) SS unclassified (when one or all members of the family fail to set seed after self-fertilization but the SI phenotype is unknown), or (d) unknown breeding system. Secondly, for those families identified as having SS, they were classified into six SI phenotypes: homomorphic families were classified as having (1) stigmatic SI, (2) stylar SI, (3) ovarian SI, or (4) post-fertilization SS, while other families exhibited (5) heteromorphic SI or (6) had a polymorphic basis to SI in which multiple SS/SI phenotypes have been reported for different species in the same family.
Thirdly, for a small number of species, we obtained data on the genetic basis of SI from studies that used detailed hand cross-pollinations and diallel crosses to assess the genetic basis of SI. Families were assigned to one of five categories based on the proposed form of genetic control for these species. For homomorphic SI taxa, families were classified as having (a) gametophytic unifactorial SI (GSI1); (b) gametophytic bifactorial or multifactorial SI (GSI2): (c) sporophytic SI; (d) sporophytic SI and gametophytic SI (SSI-GSI), while other families were classified as exhibiting (e) heterostyly (HET) or (f) multiple forms of genetic control of SI (MULTI).
Analysis of the distribution of SS in the angiosperms
To examine the distribution and frequency of SS/SI across the six major groups of angiosperms recognized by the APG III (Angiosperm Phylogeny Group, 2009), families were classified as belonging to: (a) the ANITA grade: Amborellales, Nymphaeales, Austrobaileyales (basal divergent angiosperms sensu Moore et al., 2010); (b) Magnoliids: Magnoliids + Chloranthales (Magnoliidae + Chloranthaceae, sensu (Moore et al., 2010); (c) Monocots: monocots + Commelinids (Monocotyledonae, sensu Moore et al., 2010); (d) Eudicots: eudicots + core eudicots–Asterids–Rosids (basal eudicots, sensu Moore et al., 2010); (e) Asterids: Lamiids + Campanulids + Santalales + Berberopsidales + Caryophyllales (Superasteridae, sensu Moore et al., 2010); or (f) Rosids: Fabids + Malvids + Vitals + Saxifragales (Superrosidae, sensu Moore et al., 2010). A Fisher exact test of independence was conducted to examine if the proportion of families categorized by their SS/SC status differed among the six major groups of angiosperms. For the 78 families categorized by their SI phenotype, a Fisher exact test of independence was conducted to assess if the distribution of the six different SI phenotypes differed among the six major groups of angiosperms. The distribution of families having one of the five different classes of SI genetic control was also constructed, but the Fisher exact test of independence was not used to test for differences in the proportion of families with different SI genetic mechanisms among groups, since the genetic control of homomorphic SI has only been identified in 27 families and studies are biased towards cultivated and herbaceous taxa.
To analyse the time of divergence of families bearing different SS/SI phenotypes, maximum likelihood estimates (MLE) of the stem age of 435, 420 and 335 families, respectively, were obtained from the calibrated phylogenetic trees given in Wikström et al. (2001), Davies et al. (2004a) and Bell et al. (2010). Wikström et al. (2001) and Davies et al. (2004a) used non-parametric rate smoothing to obtain estimates of stem family age. The former topology and calibration is known to underestimate the age of terminal nodes but otherwise provide mean MLE of the age of divergence, while the latter provides maximum ages for families (Davies et al., 2004b). Bell et al. (2010) used a Bayesian approach and assumed either exponential or log-normal distribution of 36 internal calibration points to estimate the stem family age and 95 % confidence interval of their divergence times. The 95 % confidence intervals of divergence-time estimates of Bell et al. (2010) overlap with those of Wikström et al. (2001) for all the internal nodes shared in the two topologies. Because of the similarity in their estimates and the inclusion of more families in the Wikström et al. (2001) topology, we present most figures using the calibrations of Wikström et al. (2001), but include the results of analyses using the calibrations of Davies et al. (2004a) and Bell et al. (2010) for comparison. A univariate plot of the time of divergence of all 230 families identified as harbouring SC, stigmatic SI, stylar SI, ovarian SI, post-fertilization SS, heteromorphy, heteromorphy + SI, and unclassified SS, was constructed. Families assigned to the polymorphic SI category were plotted multiple times to heuristically view the relative time of origination of different SS/SI phenotypes based on the divergence times of Wikström et al. (2001).
Additionally, using the information about the phylogenetic relationship of all angiosperm families, we used the information about the SI phenotype or, when unavailable, SS/SC classification of families, to reconstruct the ancestral states on an ultrametric tree based on the topology of Soltis et al. (2011). The terminal states used to designate a family's breeding systems were self-compatible, one of the four different SI phenotypes for homomorphic SI (stigmatic, stylar and ovarian and post-fertilization SS), heteromorphic, heteromorphic + SI, polymorphic, SS unclassified or unknown breeding system. The family designation assumes that a particular state in a family is homologous and ancestral to all species belonging to the family, as has been assumed in previous reconstructions of ancestral states at upper species level (Charlesworth, 1995; Allen and Hiscock, 2008; Igic et al., 2008). However, these assumptions are violated in designation of families as (a) polymorphic, because variation in the SS/SI phenotype within and between the families assigned to this category implies non-homologous traits and suggests de novo origination of SI within a particular family; (b) SS unclassified and (c) unknown, because these are pragmatic rather than biologically meaningful designations and neither homology nor ancestry could be assigned; and (d) the remaining states in which molecular basis controlling the SI reaction is unknown. The optimization of states was performed using unordered maximum parsimony, with the aid of Mesquite v. 2·74 software (Maddison and Maddison., 2010). A simulation study has shown that unordered parsimony may be an inappropriate model for reconstructing ancestral states when there are unequal transition rates between states and that incorrect reconstructions may occur when states have differential rates of speciation and extinction (Maddison, 2006). For the reasons listed above, the reconstruction of the ancestral states was employed for heuristic purposes only, to observe clustering of SC and some SS/SI phenotypes at upper levels of the families (not species) and not to estimate transition rates among states per se. Given the size of the final tree, the tree was divided into three sections: (1) the ANITA grade + monocots + Magnoliids, (2) the eudicots + core eudicots + Asterids and (3) the Rosids.
Absolute DRs in SS and SC lineages
The Kendall–Moran estimate of the family DR, rˆKM (Magallón and Sanderson, 2001), was estimated as: rˆKM = ln(n)/t where n = number of species in the family, which was obtained from the APG website (Stevens, 2010 onwards), and t = age of divergence of the family obtained from Wikström et al. (2001), Davies et al. (2004a) and the ages based on exponential and log-normal distribution of calibration points from Bell et al. (2010). The rˆKM was plotted against the time of divergence for all 230 families identified as harbouring SC, SS, heteromorphy (no evidence of SI), heteromorphy + SI, one of the four categories of homomorphic SI (stigmatic, stylar, ovarian or post-fertilization SS), or having multiple SS/SI phenotypes in the same family (polymorphic).
To test the hypothesis that families bearing SS/SI have higher absolute DRs than those harbouring SC, we performed three sets of ANOVA analyses (Sokal and Rolhf, 1995). In all cases, we conducted fixed effect ANOVAs using the Kendall–Moran estimate of family diversification rate rˆKM as the response variable and then tested for (a) the presence SS (two levels: SC and SS), (b) the type of SS (five levels: SC, heteromorphic SI, homomorphic SI, polymorphic and SS unclassified) or (c) the effect of the SS/SI phenotype (nine levels: SC, SS unclassified, stigmatic, stylar, ovarian, or post-fertilization SS, homomorphic SI, heteromorphic, heteromorphic + SI, and polymorphic) on angiosperm family DRs. For all analyses, the squared age of family divergence was used as a covariate to control for the effect of the origination time of the family since the DR of angiosperm families accelerates towards the present (see Fig. 5 in Results). The ANOVAs were repeated using all four estimates of family divergence age [Wikström et al. (2001), Davies et al. (2004a) and both of those from Bell et al. (2010)], and post-hoc Tukey HSD for unequal sample size tests were performed to identify which means were significantly different.
Fig. 5.

Family DR of the Kendall–Moran estimator (rˆKM) for 230 families identified as possessing self-compatibility (SC), possessing heteromorphic, or presenting self sterility unclassified (SS unclass) or one of six SI phenotypes: stigmatic, stylar, ovarian, post-fertilization SS, heteromorphic + SI (Het + SI) or as being polymorphic in the site of SI expression. MYBP = millions of years before present.
The designation of SC vs. SS differs in that for a family to be considered SC all members must be found to be self-compatible, while only one species is sufficient to designate a family as SS. This difference in classifying families could cause a bias in the DR analyses if families with small samples sizes were more likely to have low species richness (SR) and also be designated as SC. To test for the effects of the sample size and the designation of families as SC vs. SS on SR, an ANCOVA was performed using the presence of SS as fixed effect factor with two levels (SS and SC), and the proportional sample size as a covariate and the interaction of both terms on the species richness of the 230 families included in the analysis. The proportional sample size was estimated by dividing the number of species in which breeding system has been assessed in each family by the total number of species in the same family (information from Supplementary Data Appendix S2). The result of the ANCOVA showed that there was not a significant effect of the proportional sample size or the interaction of the proportional sample size and the presence of SS. Therefore we discarded this possible confounding effect as a source of variation influencing the DR analyses (Supplementary Data Table 1).
Table 1.
ANOVA results for the fixed-effect model of (A) presence of self-sterility, (B) types of self-sterility and (C) self-sterility/self-incompatibility (SS/SI) phenotype on the Kendall–Moran estimate of family DR using the squared age of divergence of the family as a covariate
| Effect | d.f. | MS effect | MS error | F | P |
|---|---|---|---|---|---|
| (A) Presence of self-sterility | |||||
| Wikström et al. (2001) | |||||
| Presence of self-sterility | 2, 227 | 0·0089 | 0·0006 | 16·00 | <0·0001 |
| Squared age of divergence of the family | 1, 227 | 0·0717 | 0·0006 | 128·14 | <0·0001 |
| Davies et al. (2004) | |||||
| Presence of self-sterility | 2, 227 | 0·0040 | 0·0003 | 11·32 | 0·0009 |
| Squared age of divergence of the family | 1, 227 | 0·0443 | 0·0003 | 126·76 | <0·0001 |
| Exponential Bell et al. (2004) | |||||
| Presence of self-sterility | 2, 203 | 0·0059 | 0·0005 | 10·62 | 0·0013 |
| Squared age of divergence of the family | 1, 203 | 0·0547 | 0·0005 | 98·57 | <0·0001 |
| Log-normal Bell et al. (2004) | |||||
| Presence of self-sterility | 2, 203 | 0·0050 | 0·0005 | 10·06 | 0·0018 |
| Squared age of divergence of the family | 1, 203 | 0·0479 | 0·0005 | 96·05 | <0·0001 |
| (B) Types of self-sterility | |||||
| Wikström et al. (2001) | |||||
| Types of self-sterility | 4, 224 | 0·0031 | 0·0006 | 5·69 | 0·0002 |
| Squared age of divergence of the family | 1, 224 | 0·0678 | 0·0006 | 123·06 | <0·0001 |
| Davies et al. (2004) | |||||
| Types of self-sterility | 4, 224 | 0·0015 | 0·0003 | 4·35 | 0·0021 |
| Squared age of divergence of the family | 1, 224 | 0·0418 | 0·0003 | 121·20 | <0·0001 |
| Exponential Bell et al. (2004) | |||||
| Types of self-sterility | 4, 200 | 0·0016 | 0·0006 | 2·90 | 0·023 |
| Squared age of divergence of the family | 1, 200 | 0·0546 | 0·0006 | 97·52 | <0·0001 |
| Log-normal Bell et al. (2004) | |||||
| Types of self-sterility | 4, 200 | 0·0014 | 0·0005 | 2·81 | 0·0268 |
| Squared age of divergence of the family | 1, 200 | 0·0478 | 0·0005 | 94·90 | <0·0001 |
| (C) Self-sterility/self-incompatibility | |||||
| Wikström et al. (2001) | |||||
| SS/SI phenotype | 8, 220 | 0·0019 | 0·0006 | 3·39 | 0·0011 |
| Squared age of divergence of the family | 1, 220 | 0·0683 | 0·0006 | 124·12 | <0·0001 |
| Davies et al. (2004) | |||||
| SS/SI phenotype | 8, 220 | 0·0010 | 0·0003 | 2·89 | 0·0045 |
| Squared age of divergence of the family | 1, 220 | 0·0419 | 0·0003 | 122·46 | <0·0001 |
| Exponential Bell et al. (2004) | |||||
| SS/SI phenotype | 8, 196 | 0·0011 | 0·0006 | 1·93 | 0·0577 |
| Squared age of divergence of the family | 1, 196 | 0·0545 | 0·0006 | 97·15 | <0·0001 |
| Log-normal Bell et al. (2004) | |||||
| SS/SI phenotype | 8, 196 | 0·0011 | 0·0005 | 2·68 | 0·0082 |
| Squared age of divergence of the family | 1, 196 | 0·0685 | 0·0005 | 171·82 | <0·0001 |
The analyses were performed on the Wikström et al. (2001), Davies et al. (2004) and exponential and log-normal Bell et al. (2010) estimates of the divergence age of families.
Relative DRs of SS and SC lineages
Because all forms of SS may lead to elevated DRs, families harbouring SS were treated equally and pooled to conduct sister group comparisons to test whether families bearing any form of SS have higher relative DRs than families bearing SC. To examine whether families with different types of SS have different relative DRs, a second series of sister comparisons was conducted in which families bearing SC were compared with those bearing (a) heteromorphic SI, (b) homomorphic SI, (c) polymorphic and (d) SS unclassified. Sister groups were identified for the Soltis et al. (2011) phylogeny and specific phylogenies for the monocots (Chase et al., 2006; Givnish et al., 2006; Graham et al., 2006), Poales (Givnish et al., 2010), Ericales (Schönenberger et al., 2005, 2010) and Brassicales (Hall et al., 2004) as follows: families designated as SC were located on the topologies, their sister families were paired with them and if the sister family was SC then the next oldest or youngest sister family or families were selected until the sister groups consisted of a SC/SS pair. Once identified, the number of species from each sister group was obtained from the APG website (Stevens, 2010 onwards). Subsequently, two sets of sister comparisons were made. For both analyses, the number of species in the SC clade was the total number of taxa; however, in clades with SS, we performed analyses based on both the total number of species in the family/clade and on the proportion of the species expected to be self-sterile since clades with more SS taxa may have higher DRs. The expected proportion of taxa in a family expected to be self-sterile was calculated simply as = (number of species) × (number of species examined in a family that are reported as having SS/total number of species examined in the family; see Supplementary Data Appendix S2 for data). The analyses based on the total number of species in a family tests whether clades per se differ in DRs (i.e whether the presence of SS but also other traits influence the DR of a clade); while the second estimate tests whether difference associated with SS per se (or closely correlated traits) influence family DRs (e.g. families with greater numbers of SI taxa will be more diverse). The latter test is more conservative (i.e. it can only bias the test to reject the null hypothesis).
For each comparison, the difference in (a) SR or (b) DR for each sister group was obtained following: (a) Barraclough et al. (1996) ln(xi)/ln(yi) where xi is the number of species in the taxa presenting a higher species richness and yi is the number of species in the taxa presenting a lower species richness; or (b) Isaac et al. (2003) [ln(xi) – ln(yi)]/ti where xi is the number of species in the family presenting a higher species richness, yi is the number of species in the family presenting a lower species richness and ti is the divergence age of the sister groups. For the Isaac et al. (2003) comparison, the divergence age of each sister group was obtained from Wikström et al. (2001), Davies et al. (2004a) and the exponential and log-normal estimates given in Bell et al. (2010). The test of DRs proposed by Isaac et al., (2003) gives proportionally greater weight to older families, making it a more conservative test, since it partially accounts for extrinsic factors influencing DRs. The difference for each comparison was then ordered and declared as negative if families bearing SC had higher SR (method a) or DR (method b) than those bearing SS and positive if the reverse was true. A Wilcoxon signed rank test was performed to test if the contrasts were significant (Vamosi and Vamosi, 2005).
RESULTS
Distribution and type of SS in angiosperm families
Of the 445 recognized angiosperm families, breeding system data were available for slightly more than half (230). Nevertheless, the number of families with unknown breeding system, SS, SI or SC were randomly distributed among the six major groups of angiosperms, (Fisher exact test, P = 0·0846; Fig. 2A). For the 230 families for which breeding system information was available, 66 families were exclusively found to have species expressing SC, and 164 families were found to have at least one member with SS. In total, of the 5609 species surveyed, 3285 were found to have SC and 2324 species SS or SI, suggesting that an estimated 59 % of hermaphroditic angiosperm taxa are SC and up to 41 % SS/SI. The categorization of families as having SS or SC was frequently derived from knowledge of only a small sample of the species representing a family (mode = 1·3 %, range 0·04–100 % of the species in a family; Supplementary Data Appendix S2), particularly for families with >500 species (mode = 0·27 %, range 0·04–12 % of the species in the family Supplementary Data Appendix S2). Nevertheless, this is the largest database available, to date, on the presence of SS in angiosperm taxa (Supplementary Data Appendix S2).
Fig. 2.

The number of families in each of the six major groups of angiosperms: ANITA grade, Magnoliids, monocots + Commelinids, eudicots + core eudicots–Asterids–Rosids, Asterids and Rosids, with different classifications of self-sterility. (A) Number of families in each phylogenetic group classified by their SS/SC status including unclassified families across all 445 families of angiosperms recognized by APG II (Stevens, 2010 onwards). (B) Number of families in each phylogenetic group classified by their SI phenotype for the 78 families for which the SI phenotype data are available. (C) Number of families across each phylogenetic group exhibiting different forms of genetic control of SI for the 27 families for which data are available.
Of the 164 families showing some level of SS, the SI phenotype was determined from microscopic examination in 78 families (62 families with homomorphic SI, nine families with homomorphic and heteromorphic SI, and seven families with heteromorphic SI) while 74 families were found to have evidence of SS, but the site of pollen-tube rejection remains unknown (Supplementary Data Appendix S2). Roughly equal numbers of families were found to have homomorphic SI occurring at the stigma, style, or ovary (14, 16 and 14, respectively; Fig. 2B and Supplementary Data Appendix S2), while five families were found to have post-fertilization SS. In total, 28 families were identified as having heteromorphy (Fig. 2C), in 12 of these families heteromorphy has been inferred from morphological data, and in seven SS has been shown (i.e. Het + SI; Fig. 2B), while, in nine, heterostyly co-occurs with another form of homomorphic SI (Supplementary Data Appendix S2). Polymorphic families were found to be more common than previously thought; we found studies reporting different sites of rejection of self-pollen in different species from the same family for 22 families (Fig. 2B): in 9, 12, 11 and 16 families, respectively, heterostyly, and homomorphic stigmatic, stylar and ovarian SI co-occurred with other SI phenotypes (Supplementary Data Appendix S2). However, the hypothesis that the proportion of families with different SI phenotypes differed among the six major groups of angiosperms could not be rejected (Fisher exact test, P = 0·3447), even though only stigmatic and ovarian SI have been observed in the ANITA (basal) grade, and only stigmatic and stylar inhibition have been reported in the eudicots (Fig. 2B). Information about the genetic control of homomorphic SI has been elucidated in only 27 families with gametophytic unifactorial SI being the most common form, while heteromorphy has been inferred from morphological dimorphism in anther and pistil length in a total of 28 families (Supplementary Data Appendix S2). The kind of genetic control of SI observed is also scattered among the six major groups of angiosperms, although no information about the genetic control of SI was available for species in the ANITA grade and magnoliids (Fig. 2C).
Time of origination of SI systems
Examination of the time of divergence of the 230 families for which information on breeding systems could be obtained showed that the oldest families harbour SC (Ceratophyllaceae, 140 mybp; Nelumbonaceae 125 mybp), stigmatic inhibition (Papaveraceae, 126 mybp) and polymorphic (stylar and ovarian) inhibition (Proteaceae, 108 mybp; Fig. 3 and Supplementary Data Appendix S2). Families with SC and stigmatic and ovarian SI diverge at relatively even intervals throughout angiosperm history, while those with heteromorphy + SI and post-fertilization inhibition first appeared in families whose crown ages are 87 and 81 mybp (Olacaceae and Grossulariaceae), respectively, and they tend to have younger diversification ages (Fig. 3 and Supplementary Data Appendix S2). A similar trend was found using the divergence age of families from Davies et al. (2004a) and Bell et al. (2010) (not shown).
Fig. 3.

Age of divergence (Wikström et al., 2001; MYBP = millions of years before present) of families categorized as having self-compatibility (SC), heteromorphic, or one of the following SS/SI phenotypes: stigmatic, stylar, or ovarian SI, post-fertilization SS, Heteromorphic + SI (Het + SI) and SS unclassified. When polymorphic expression of SS/SI (two or more sites of pollen tube inhibition have been noted in the same family), the age of divergence of the family was plotted multiple times to heuristically visualize the time of appearance of the SS/SI phenotype.
Reconstruction of ancestral SS systems in angiosperms
The ancestral state of SS for the 435 angiosperm families included in the Soltis et al. (2011) topology was equally parsimonious for the states unclassified SS, SC and unknown, at the root of the tree (Fig. 4). Most of the internal nodes were reconstructed as unknown; this is a logical consequence of the lack of information for slightly fewer than half of all families. Although there is evidently limited clustering of SS/SI phenotypes (excluding polymorphic and unknown states which do not represent single states), there are exceptions and this tree will hopefully be useful for researchers trying to elucidate the type or genetic basis of SI in individual families (Fig. 4).
Fig. 4.


Ancestral state reconstruction of self-sterility among 435 angiosperm families of (A) ANITA grade + Magnoliids+ monocots + Commelinids, (B) Eudicots + core Eudicots + Asterids and (C) Rosids sections using the phylogeny and calibration given in Soltis et al. (2011). Families were classified as possessing self-compatibility (SC), stigmatic, stylar, or ovarian SI, post-fertilization SS, or as having heteromorphic and heteromorphic + SI, or as being polymorphic because multiple types of SS/SI have been noted in the family. Families considered to be self-sterile but for which the SI has not been confirmed are classified as possessing self-sterility (SS unclassified), while those for which no breeding information is available are described as unknown. Divided internal nodes with different colours represent equivocal reconstructions in different states optimized by maximum parsimony.
Absolute DRs in SS and SC families
The distribution of absolute DRs of families with different forms of SS or SC across geological time shows that all early diverging families have very low DRs, while younger families (<50 mybp) have increasingly higher DRs as time progresses towards the present (Fig. 5). It is apparent that those families identified as bearing exclusively SC lineages tend to have lower DRs than those bearing SS/SI in all time periods (Fig. 5). Furthermore, it is apparent that several of the youngest families with the highest DRs have stigmatic SI (Fig. 5).
The ANOVA analyses showed that the presence (Table 1A), type (Table 1B) and phenotype (Table 1C) of SS/SI all had significant effects on family DR based on all four calibrations of the angiosperm family tree (for SS presence and type) or for two of them (for SI phenotype). The mean DRs of families with SS were on average approx.1·4 times higher than the mean DRs of families bearing SC across all four calibrations of the angiosperm tree (Fig. 6A). Examination of the effect of the type of SS, revealed that families with homomorphic SI and those having polymorphic bases to SI have significantly higher mean DRs than families with SC based on post-hoc Tukey tests (Fig. 6B–E), while the mean DR of families with heteromorphic SI and families with unclassified SS was similar to that of families with SC (Fig. 6B–E). A closer examination of the effect of DR of families based on SS/SI phenotype, revealed that families with stigmatic homomorphic SI and those with multiple SS/SI phenotypes in the same family (polymorphic) have significantly higher DRs than those bearing SC based on the Wikström et al. (2001) and Davies et al. (2004a) calibrations but not based on those of Bell et al. (2010), probably due to the smaller sample size (and thus higher standard errors) associated with the dataset based on the calibration of Bell et al. (2010) (Supplementary Data Fig. S1A–D).
Fig. 6.
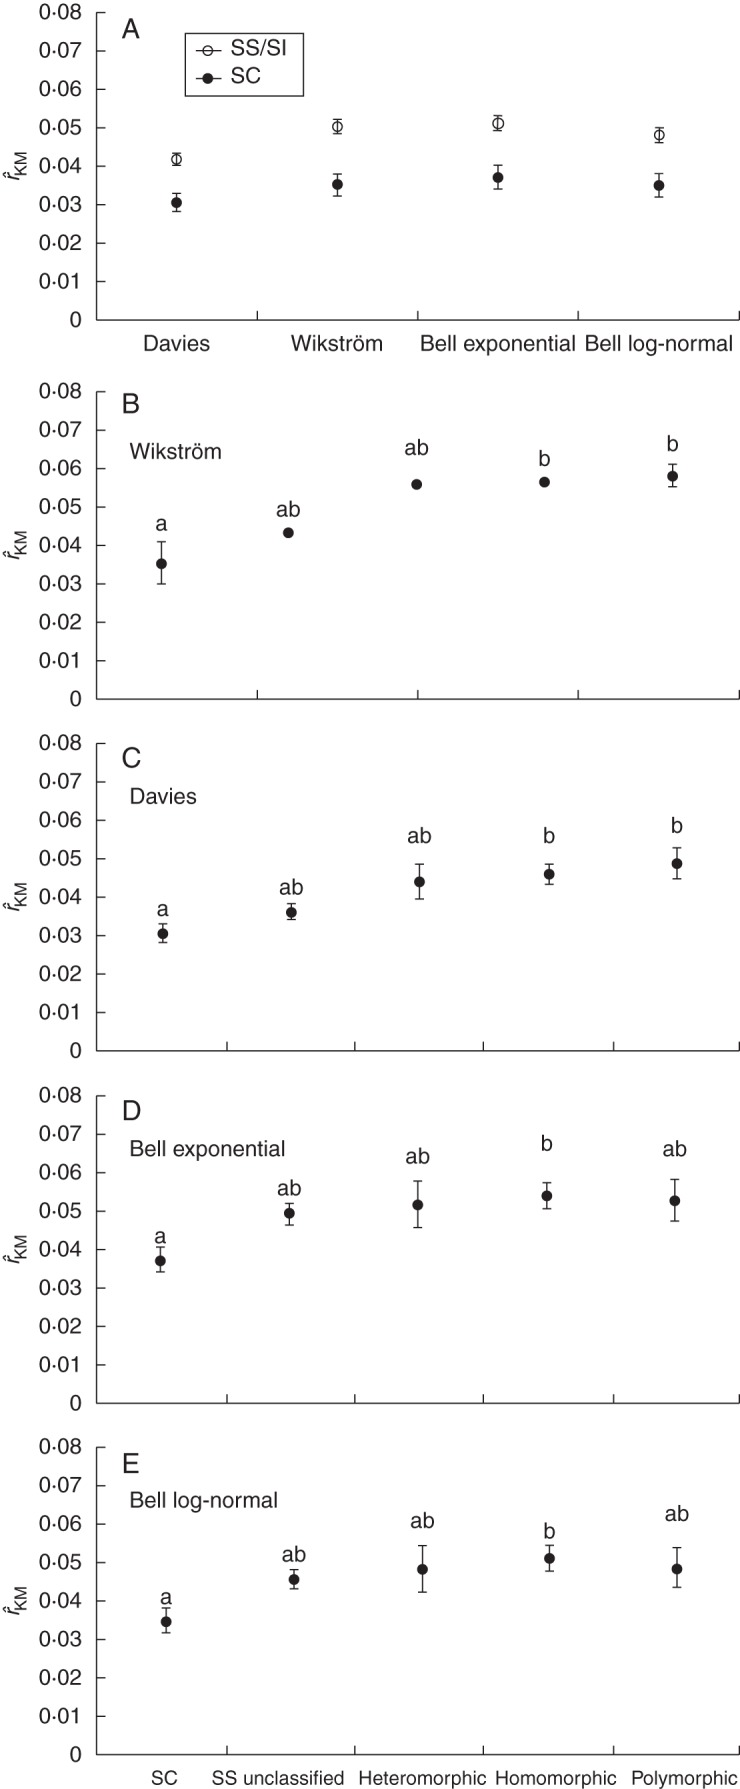
(A) Mean and standard error of the Kendall–Moran estimator of DR (rˆKM) in 164 and 66 families bearing SS/SI and SC, respectively, using the estimates of Wikström et al. (2001), Davies et al. (2004) and exponential and log-normal calibrations of Bell et al. (2010) for the divergence age of the families. Mean and standard error of Kendall–Moran estimator of DR (rˆKM) using the estimates of (B) Wikström et al. (2001), (C) Davies et al. (2004) and (D) exponential and (E) log-normal calibrations of Bell et al. (2010) for the divergence age of the 44 families bearing homomorphic SI, 19 with heteromorphy, 22 with polymorphic basis to SI, 74 families bearing SS unclassified species and for 66 families bearing SC. Means with different letters were found to be significantly different (Tukey HSD test, P < 0·05).
Relative DRs in SS and SC families
To conduct the sister-group analyses, many families were excluded from the analyses because (a) a sister with SC could not be found (127 sister groups) or (b) a family with SC was paired with a family with heteromorphic system (five sister groups) or unknown breeding status (28 sister groups). Thus, the final analysis was conducted on 38 sister groups and included 95 families (Supplementary Data Appendix S3) for which contrasts were performed between clades bearing SC vs. clades bearing SS including unclassified SS (18), or homomorphic SI in which rejection occurs at the stigma (three), style (five), ovary (four), or in multiple sites (eight).
Of the 38 sister pairs used for complete analyses, 29 were identified as having more taxa in the SI/SS compared with the SC clade based on the total number of species in the clade and 26 were found to be more species rich when the comparison was based on the estimated fraction of SS taxa in the clade (Fig. 7A, B; the families in each pair are listed in Supplementary Data Appendix S3). To assess the effect of particular SS/SI phenotypes, individual sister comparisons were performed. For the ten sister pairs included in the comparison of SC vs. homomorphic SI, six were identified as having more taxa in the SI clade based on either the total number of species in the clade or the estimated fraction of taxa with SI (Supplementary Data Fig. S2A, B and Appendix S3). For the comparison of SC vs. polymorphic, seven comparisons revealed more species in the SI clade when based on the total number of species and six of the eight had more species when the comparison was based on the estimated fraction of taxa with SI in the SI clade (Supplementary Data Fig. S3A, B and Appendix S3). Lastly, for the 18 sister groups comparing SC vs. unclassified SS, 14 and 12 clades, respectively, were identified as having more taxa in the SS clade based on the total number of species or the estimated fraction of taxa with SS in the SS clade (Supplementary Data Fig. S4A, B and Appendix S3).
Fig. 7.

Proportion of the total number of species in the sister-group pair bearing SC (black columns) versus (A) the total number of species in the sister clade with SS/SI (grey columns) or (B) the expected proportion of taxa with SS in the clade with SS/SI (grey columns) for each one of the 38 sister group comparisons inferred from the Soltis et al. (2011) topology (those for other comparisons performed are presented in Supplementary Data).
The significance of these differences in SR among sister groups was tested using Wilcoxon rank sign tests as were differences in DR, which were calculated using the times of divergence of each sister group based on each of the four angiosperm tree calibrations (Table 2). The Wilcoxon sign tests indicated that there is significantly higher SR and DR (based on all four calibrations) in groups with SS vs. SC (38 comparisons) regardless of whether the comparisons are made based on the total or estimated fraction of SS/SI taxa in the clade bearing SS/SI. It also showed that there is significantly higher SR and DR (based on all four calibrations) in groups with polymorphic vs. SC (eight comparisons) and when comparing SS unclassified vs. SC (18 comparisons), based on the total number of species in the clade with SS, but not on the estimated fraction with SS (Table 2). There was no difference in SR or DR for the comparison of homomorphic SI vs. SC sister groups (ten comparisons).
Table 2.
Statistics for the Wilcoxon signed rank test
| Total number of species |
Expected number of taxa with SS/SI |
||||||||||
|---|---|---|---|---|---|---|---|---|---|---|---|
| Barraclough et al. | Isaac et al. |
Barraclough et al. | Isaac et al. |
||||||||
| Dav | Wik | EBe | LBe | Dav | Wik | EBe | LBe | ||||
| W | –443 | –509 | –506 | –501 | –503 | –339 | –373 | –365 | –331 | –339 | |
| SC vs. SS | Z | –3·216 | –3·694 | –3·673 | –3·636 | –3·651 | –2·462 | –2·708 | –2·650 | –2·404 | –2·462 |
| P | 0·002 | <0·001 | <0·001 | 0·001 | 0·001 | 0·019 | 0·010 | 0·012 | 0·022 | 0·019 | |
| W | –17 | –23 | –21 | –25 | –25 | –5 | –19 | –19 | –19 | –19 | |
| SC vs. | Z | –0·892 | –1·198 | –1·096 | –1·300 | –1·300 | –0·280 | –0·994 | –0·994 | –0·994 | –0·994 |
| Homomorphic SI | P | 0·268 | 0·195 | 0·219 | 0·171 | 0·171 | 0·384 | 0·243 | 0·243 | 0·243 | 0·243 |
| W | –30 | –32 | –32 | –32 | –32 | –24 | –24 | –24 | –24 | –24 | |
| SC vs. | Z | –2·135 | –2·275 | –2·275 | –2·275 | –2·275 | –1·715 | –1·715 | –1·715 | –1·715 | –1·715 |
| Polymorphic | P exact | 0·025 | 0·025 | 0·025 | 0·025 | 0·025 | 0·060 | 0·060 | 0·060 | 0·060 | 0·060 |
| W | –119 | –129 | –123 | –119 | –121 | –87 | –85 | –79 | –63 | –63 | |
| SC vs. | Z | –2·602 | –2·820 | –2·689 | –2·602 | –2·646 | –1·905 | –1·862 | –1·731 | –1·383 | –1·383 |
| SS unclass | P | 0·014 | 0·007 | 0·011 | 0·014 | 0·012 | 0·065 | 0·071 | 0·089 | 0·153 | 0·153 |
W, Sum of ranks; Z, value; P, associated probability; P exact, exact probability for Wilcoxon signed rank test when n < 10) used to test the hypothesis that both species richness and DRs have been the same in self-compatible and sister clades. Significant values are highlighted in bold. Comparisons were based on the total number of taxa in clades with SC against both: (1) the total number of taxa in sister group or (2) the estimated number of species in the sister group expected to have SS (see text for details). Two contrast methods were used to analyse the data: that given in Barraclough et al. (1996) based on comparisons of species richness and that given in Isaac et al. (2003) based on DR {[ln(xi)/ln(yi)] and [log(xi) – log(yi)]/ti, respectively} using the estimates of Davies et al. (2004) (Dav) and Wikström et al. (2001) (Wik) and exponential and log-normal calibrations of Bell et al. (2010) (EBe and LBe, respectively) for the divergence age of the sister group (ti).
DISCUSSION
Distribution and type of SS in angiosperms families
The role of SS/SI in the evolution of angiosperms has been debated for a long time, particularly its role in the early diversification and radiation of flowering plants (Whitehouse, 1950; Stebbins, 1957, 1981; Pandey, 1960, 1969; Baker, 1966; Burger, 1981; Grant, 1981; Zavada and Taylor, 1986; Weller et al., 1995; Hiscock and Allen, 2008) and, more recently, its influence on angiosperm DRs (Heilbuth, 2000; Igic et al., 2006; Ferrer and Good-Avila, 2007; Goldberg et al., 2010). Here, we perform the first study to examine the role of SS/SI in the diversification of angiosperm families by using information about the MLE of family divergence age. In agreement with the findings of Allen and Hiscock (2008), who examined the distribution and ancestral state of SS/SI across angiosperm groups, we find that multiple SS/SI systems arose in early angiosperm evolution, that their distribution is relatively even and scattered across all the major angiosperm groups recognized by the AGP II (Stevens, 2010 onwards), and that the possible ancestral state for the angiosperm tree is equally parsimonious for the states SC/SS (their study) and/or unknown (our study). More importantly, our revision and analyses demonstrate the extensive diversity and abundance of different kinds of SS, particularly ovarian SI, and also show that families with SS, in particular homomorphic SI, have higher DRs than those without SS. Collectively the results of this research support earlier suggestions that SS/SI has promoted diversification in both early angiosperm evolution and the subsequent diversification of families (Whitehouse, 1950; Pandey, 1960; Zavada and Taylor, 1986; Allen and Hiscock, 2008).
Through a complete revision of existing databases, we find that 41 % of angiosperm taxa from the 230 angiosperm families for which breeding-system data were available have SS/SI phenotypes, a slightly higher estimate than that of 40 % by Igic et al. (2008). However, the species diversity of the 230 families for which breeding-system data exist far outweighs that of the 215 families with unknown breeding systems and accounts for 96 % of the total angiosperm species diversity (cf. family species-richness values given in Stevens, 2010 onwards). The species diversity of the extant 71 families presenting some form of homomorphic SI (stigmatic, stylar, ovarian, post-fertilization SS) is also tremendous accounting for approx. 156 116 species of flowering plants. Thus, if we assume that SS/SI was the ancestral state of the modern families in which it has been recorded, a minimum of 61 % of extant species of angiosperms are estimated to have originated from an SS/SI ancestor. If we further assume that the ancestor of the asterids and rosids (Superasteridae and Superrosidae sensu Moore et al., 2010) harboured gametophytic RNase-based SI, as shown by several authors (Igic and Kohn, 2001; Steinbachs and Holsinger, 2002; Vieira et al., 2008), this would suggest that a minimum of 98 % of extant species originated from an SS/SI ancestor.
Additionally, this review reveals that there are 22 families exhibiting potentially more than one SI system. Previous studies have not identified many instances of multiple SI systems within a single family (Charlesworth, 1985; Olmstead, 1989; Weller et al., 1995; Igic et al., 2008). The higher frequency reported here is caused, primarily, by the inclusion of LAS and by the change in status of several heteromorphic families: 15 of the polymorphic families harboured taxa with LAS (16 with ovarian or, in six instances, post-fertilization SS), and seven of them included families observed to have both heterostyly and ovarian SI. Previous studies have shown that heterostyly often co-occurs in families with homomorphic SI (Barrett and Shore, 2008; Cohen, 2010) but here we find that in addition to the occurrence of nine families exhibiting heterostyly co-occurring with other forms of SI, stigmatic and ovarian SI co-occur in 12 and 16 families with other types of SI as well, and five families exhibit at least four different systems. This suggests that de novo rates of origination of SI are higher than often assumed. SI is considered to be a complex trait whose appearance and the selective conditions favouring its fixation in populations considered unlikely. However, as observed by other authors (Allen and Hiscock, 2008; Igic et al., 2008), different forms of SI are widely distributed in angiosperms suggesting that rates of de novo appearance of SI are high. Thus rather than thinking of SI as a complex trait, it is perhaps better to visualize it as revealing the tremendous molecular cross-talk and protein–protein interactions involved in reproduction in plants (Dixit and Nasrallah, 2001; McClure and Franklin-Tong, 2006). Indeed a survey of the genetic backgrounds from which SI tends to arise suggests that SI has evolved from genes involved in fungal or bacterial defence, such as the RNase-based SI system in the Rosaceae/Solanaceae (Lee et al., 1992), or that it has arisen from different suites of genes involved in the pollen–pistil cross-talk essential for the growth of the pollen tube from the stigma to ovary. Since any of these points of male–female crosstalk could be usurped as gateways for self-non-self rejection, the diversity of SI systems is perhaps less surprising, especially given that the mature male gametophyte expresses >7000 genes (in Arabidopsis) during pollination/fertilization (Borg et al., 2009). The genes involved in self-non-self rejection in the Brassicaceae are those involved in the primary step of pollen grain adhesion and hydration at the stigmatic surface (Chapman and Goring, 2010; Hiscock and McInnis, 2003a, b), those involved in Papaver initially cause an influx of extracellular Ca2+ but subsequently this triggers a series of signalling pathways that cause cessation (programmed cell death) of pollen tube growth (Franklin-Tong, 2008) and, although the molecular mechanisms underlying LAS are unknown for many species, studies have identified a variety of cellular events at the micropyle, nucellus or in the developing embryo sac which are disrupted in taxa with LAS (Sage and Sampson, 2003). Thus, clearly all phases of the pollination/fertilization process are open to recruitment for involvement in self-non-self recognition.
Previous studies viewed the scattered appearance of SI among angiosperm families as evidence that SI was ancestral in the angiosperms (Nettancourt, 2001) whilst others interpret the same phenomena to frequent de novo origination of SI (Bateman, 1952). The results presented here agree with both of these interpretations. Multiple SI systems arose early in angiosperm history, but they have also arisen de novo many times: Igic et al. (2008) estimate that they have arisen at least 35 times and, although we did not estimate the number specifically here, simple deduction from the observation of 20 families with more than one SS/SI phenotype, and the scattered distribution of SS/SI phenotypes on the phylogenetic tree suggest that the number must be very high as discussed by other authors (Gibbs, 1986; Steinbachs and Holsinger, 2002; Weller et al., 1995; Allen and Hiscock, 2008). Our data also suggest an important role for LAS especially in old angiosperm families, as hypothesized by other authors (Seavey and Bawa, 1986; Sage and Sampson, 2003; Hiscock and Allen, 2008); ovarian SI was found in many old families and co-occurs with other SS/SI phenotypes more than any other form of SI. The high diversity of SI systems is also supported by the current, albeit limited, understanding of the diverse molecular bases underlying SI in angiosperm families. Different genetic bases to SSI are known in the Brassicaceae and Betulaceae from the rosids (Hampson et al., 1996) in the Asteraceae and Convolvulaceae from the asterids (Hiscock and McInnis, 2003a; Kowyama et al., 2008), multiple genetic bases are known for GSI in the Solanaceae/Rosaceae (which share the same system) versus the Campanulaceae, Papaveraceae and grasses (Franklin-Tong, 2008; Good-Avila et al., 2008; Langridge and Baumann, 2008) all of which have unique systems and for different families with heterostyly (McCubbin et al., 2006; Shore et al., 2006).
Absolute and relative DRs of SS lineages
Recent studies on the evolution of SI in the Solanaceae suggest that stylar SI is selected at the species level because it decreases the extinction rate of SI clades (Goldberg et al., 2010) even though SC clades maintain higher levels of speciation. If families bearing pre-zygotic SI have lower extinction rates (Takebayashi and Morrell, 2001; Goldberg et al., 2010), then we may observe an excess of old SI lineages. This is supported by the observation of low DRs in old SC families; indeed families bearing SC tended to have lower DRs across all time periods except in the recent past, supporting this hypothesis.
Indeed, we show that DRs are higher in SS, particularly SI lineages over broad taxonomic and evolutionary time-scales, as recently proposed by Wright and Barrett (2010). Based on the ANOVA analyses of the absolute DRs of families with SS/SI vs. SC, we find that families with any form of SS exhibited significantly higher DRs than those with SC. When the SS families were further divided by type, we found that the effect of elevated absolute DRs was significant only for families with homomorphic and polymorphic SI (i.e. not for families with hetermorphy + SI). When the dataset was further subdivided to include the effect of different SS/SI phenotypes, we found that only families in which rejection occurs at the stigma or in families with multiple forms of SS/SI (polymorphic) did we find a significant increase in DR compared with SC families. Since multi-allelic sporophytic SI is the most restrictive form of SI (and ensures the highest levels of outcrossing in the absence of dominance relationships among alleles), this suggests that the effect of SI on DRs may be more than just via its role in ensuring outcrossing. This view is in accord with a recent review by Barrett (2010) in which he proposes that the (repeated) evolution of heterostyly may lie more in their role to ensure successful pollen transfer in animal-pollinated taxa and secondarily to enforce outcrossing. If heterostyly has been selected predominantly to enhance pollinator-mediated pollen transfer, multi-allelic SI systems may be broadly selected because (a) they do prevent self-fertilization but (b) they also maintain larger effective population sizes, greater connectivity between geographically distant populations, and thereby allow greater opportunities for selection across broader geographic and temporal scales.
We also found that families harbouring prezygotic SI had higher relative DRs based on sister group comparisons. In a study designed to evaluate the effect of dioecy on species richness, Heilbuth (2000) used 22 sister-group comparisons and found that species richness was higher in SI lineages but that the difference was not significant based on a sign test. In our study, we included 38 sister groups and compared both the relative SR and the DR of SS/SI vs. SC clades; the Wilcoxon rank sign test showed that there was significantly greater SR and DR in SS/SI clades, using any of the four topologies/calibrations of the angiosperm tree and regardless of whether we based the comparison on the total number of taxa in the SS/SI clade or only the fraction expected to bear SS. When the sister comparisons were performed based on clades with SC vs. those with homomorphic SI, polymorphic or unclassified SS, we found that SR and DRs were significantly higher for polymorphic and unclassified SS, but only when the comparisons were based on the total number of species in the SS clade. The failure to find a significant effect with homomorphic SI was probably caused by the inclusion of a lower proportion of families with stigmatic inhibition, which were the families that displayed a higher mean DR in the ANOVA analysis. Collectively, this suggests that SI has a significant influence on angiosperm DRs but that other attributes of SI families, not surprisingly, also serve to increase DRs.
In this respect, it should be emphasized that any trait closely correlated with SS/SI, would also serve to increase the species richness of that clade/family. Given that there are strong ecological and life-history correlates of SS/SI, this needs to be addressed, and will be the subject of future studies. Indeed a survey of our dataset reveals that, although the most species-rich families often harbour SI systems, the estimated fraction of species with SI in these families is often intermediate to low. Thus if SI per se increases DRs, which it appears to do, the rate of loss of SI is also very high. Following from this, we propose that SI lineages have lower turnover rates, associated with their lowered probability of extinction, which helps them to persist through evolutionary time and leave a greater number of descendent lineages, many of which are SC. This suggests that SI has been an important component of diversification during angiosperm evolution both at micro- and macro-evolutionary scales.
CONCLUSIONS
Traditionally, SI is considered a complex trait that is more likely lost than gained, and phylogenetic analyses at the family level supports this view (Kohn et al., 1996; Schoen et al., 1997; Goodwillie, 1999; Igic et al., 2006; Ferrer and Good-Avila, 2007). As mentioned above, even though SI appears to be an important driver of diversification in angiosperm lineages, rates of the loss of SI are also high and important to the speciation process. Here, we show that families with SS/SI have higher average DRs than those without it. However, we also show that there is evidence of tremendous selection favouring de novo origination of SI, because multiple SS/SI phenotypes can occur in a single family, and because of the lack of clustering of SS/SI phenotypes on the angiosperm phylogenetic tree. How can this view of the complexity (improbability) of the S-locus be rectified with the macrophylogenetic and molecular evidence that entirely new SI machinery has evolved repeatedly in angiosperm history? The gain of SI only seems paradoxical if one supposes that SI systems arise from ‘nowhere’ to prevent self-fertilization. However, advances in our understanding of pollen–pistil interactions have revealed a plethora of molecules involved in enabling the growth of the pollen tube from the stigmatic surface to the ovules, many of which must be the target of selection (Swanson et al., 2004; Hiscock and Allen, 2008; Borg et al., 2009); and, very recently, the resilience and plasticity of the system has been shown in an experiment in which sporophytic SI was restored via recombination after the momentary loss of the system following polyploidization (Brennan and Hiscock, 2010). Therefore, the evolution of SI systems is more likely to be the story of the selective process that brings paired sets of these molecules to the forefront of determining the self/non-self gateway. We suggest that the high proportion of SI taxa in angiosperms is due not only to the higher DRs maintained by SI lineages, but also to the selective forces favouring the evolution of pre- and post-zygotic barriers to self-fertilization in flowering plants, the vast majority of which are hermaphroditic and favour outcrossing.
SUPPLEMENTARY DATA
Supplementary data are available online at ww.aob.oxfordjournals.org and consist of the following. Table S1: ANCOVA results for the fixed effect model of presence of self-sterility, proportional sample size and their interaction on species richness. Fig. S1: mean of Kendall–Moran estimator of DR (rˆKM) using the estimates of Wikström et al. (2001), Davies et al. (2004), exponential and log-normal Bell et al. (2010) calibrations. Figure S2: proportion of the total number of species in the sister-group pair bearing SC versus the total number of species in the sister clade with homomorphic SI clades or the expected proportion of taxa with SS in the clade with homomorphic SI for each one of the ten sister-group comparisons inferred from the Soltis et al. (2011) topology. Figure S3: proportion of the total number of species in the sister-group pair bearing SC versus the total number of species in the sister clade with polymorphic SI clades or the expected proportion of taxa with SS in the clade with polymorphic SI for each one of the eight sister-group comparisons inferred from the Soltis et al. (2011) topology. Figure S4: proportion of the total number of species in the sister-group pair bearing SC versus the total number of species in the sister clade with unclassified SS clades or the expected proportion of taxa with SS in the clade with unclassified SS for each one of the 18 sister-group comparisons inferred from the Soltis et al. (2011) topology. Appendix S1: Studies in which microscopic and genetic analysis has been conducted to elucidate the inhibition site and the genetic control of the pre-zygotic SI system by family according angiosperm phylogeny group classification. Appendix S2: families of Angiosperms presenting stigmatic SI inhibition, phylogenetic information, number of species (retrieved from APG II website; Stevens, 2010 onwards), age of divergence from Wikström et al. (2001), Davies et al. (2004) and exponential and log-normal Bell et al. (2010) calibrations. Appendix S3: sister groups used for the test of species richness in families bearing SC versus families bearing heteromorphic, homomorphic SI or (homomorphic) SS.
ACKNOWLEDGEMENTS
We thank Simon J. Hiscock, Xavier Vekemans, Stephen Weller, Naoki Takebayashi and two anonymous reviewers for reading an earlier version of this manuscript; and Sergey Yegorov for drawing Fig. 1 and for help with editing the manuscript. This work was supported by National Sciences and Engineering Research Counsil of Canada (Discovery Grant) to S.V.G., and by government of Canada (Post-doctoral research award) and Consejo Nacional de Ciencia y Tecnología de México (Repatriación grant) to M.M.F.
LITERATURE CITED
- Allen AM, Hiscock SJ. Evolution and phylogeny of self-incompatibility systems in angiosperms. In: Franklin-Tong VE, editor. Self-incompatibility in flowering plants. Berlin: Springer; 2008. [Google Scholar]
- Angiosperm Phylogeny Group. An update of the Angiosperm Phylogeny Group classification for the orders and families of flowering plants: APG III. Botanical Journal of the Linnean Society. 2009;161:105–121. [Google Scholar]
- Baker HG. Self-compatibility and establishment after ‘long-distance’ dispersal. Evolution. 1955;9:347–349. [Google Scholar]
- Baker HG. The evolution, functioning and breakdown of heteromorphic incompatibility systems.1. Plumbaginaceae. Evolution. 1966;20:349–368. doi: 10.1111/j.1558-5646.1966.tb03371.x. [DOI] [PubMed] [Google Scholar]
- Barraclough TG, Harvey PH, Nee S. Sexual selection and taxonomic diversity in passerine birds. Proceedings of the Royal Society of London. Series B: Biological Sciences. 1995;259:211–215. [Google Scholar]
- Barraclough TG, Harvey PH, Nee S. Rate of rbcl gene sequence evolution and species diversification in flowering plants (Angiosperms) Proceedings: Biological Sciences. 1996;263:589–591. [Google Scholar]
- Barrett SCH. Understanding plant reproductive diversity. Philosophical Transactions of the Royal Society B: Biological Sciences. 2010;365:99–109. doi: 10.1098/rstb.2009.0199. [DOI] [PMC free article] [PubMed] [Google Scholar]
- Barrett SCH, Shore JS. New insights on heterostyly: comparative biology, ecology and genetics. In: Franklin-Tong VE, editor. Self-incompatibility in flowering plants. Berlin: Springer; 2008. [Google Scholar]
- Bateman AJ. Self-incompatibility systems in angiosperms. 1. Theory. Heredity. 1952;6:285–310. [Google Scholar]
- Bell CD, Soltis DE, Soltis PS. The age and diversification of the angiosperms re-revisited. American Journal of Botany. 2010;97:1296–1303. doi: 10.3732/ajb.0900346. [DOI] [PubMed] [Google Scholar]
- Bertin RI, Newman CM. Dichogamy in angiosperms. The Botanical Review. 1993;59:112–152. [Google Scholar]
- Bittencourt NS, Semir J. Floral biology and late-acting self-incompatibility in Jacaranda racemosa (Bignoniaceae) Australian Journal of Botany. 2006;54:315–324. [Google Scholar]
- Borg M, Brownfield L, Twell D. Male gametophyte development: a molecular perspective. Journal of Experimental Botany. 2009;60:1465–1478. doi: 10.1093/jxb/ern355. [DOI] [PubMed] [Google Scholar]
- Brennan AC, Hiscock SJ. Expression and inheritance of sporophytic self-incompatibility in synthetic allohexaploid Senecio cambrensis (Asteraceae) New Phytologist. 2010;186:251–261. doi: 10.1111/j.1469-8137.2009.03082.x. [DOI] [PubMed] [Google Scholar]
- Brewbaker JL. Biology of the angiosperm pollen grain. Indian Journal of Genetic and Plant Breeding. 1959;19:121–133. [Google Scholar]
- Burger WC. Why are there so many kinds of flowering plants? BioScience. 1981;31:572–581. [Google Scholar]
- Chapman LA, Goring DR. Pollen–pistil interactions regulating successful fertilization in the Brassicaceae. Journal of Experimental Botany. 2010;61:1987–1999. doi: 10.1093/jxb/erq021. [DOI] [PubMed] [Google Scholar]
- Charlesworth D. Distribution of dioecy and self-incompatibility in angiosperms. In: Greenwood PJ, Slatkin M, editors. Evolution: essays in honour of John Maynard Smith. Cambridge: Cambridge University Press; 1985. [Google Scholar]
- Charlesworth D. Multi-allelic self-incompatibility polymorphisms in plants. BioEssays. 1995;17:31–38. [Google Scholar]
- Charlesworth D. Effects of inbreeding on the genetic diversity of populations. Philosophical Transactions of the Royal Society of London. Series B: Biological Sciences. 2003;358:1051–1070. doi: 10.1098/rstb.2003.1296. [DOI] [PMC free article] [PubMed] [Google Scholar]
- Chase MW, Fay MF, Devey DS, et al. Multigene analyses of monocot relationships: a summary. Aliso. 2006;22:65–73. [Google Scholar]
- Cohen JI. ‘A case to which no parallel exists’: the influence of Darwin's different forms of flowers. American Journal of Botany. 2010;97:701–716. doi: 10.3732/ajb.0900395. [DOI] [PubMed] [Google Scholar]
- Darwin C. Letter 395. To J.D. Hooker. Down, July 22nd, 1879. In: Darwin F, Seward AC, editors. More Letters of Charles Darwin. London: John Murray; 1903. [Google Scholar]
- Davies TJ, Barraclough TG, Chase MW, Soltis PS, Soltis DE, Savolainen V. Darwin's abominable mystery: insights from a supertree of the angiosperms. Proceedings of the National Academy of Sciences of the USA. 2004a;101:1904–1909. doi: 10.1073/pnas.0308127100. [DOI] [PMC free article] [PubMed] [Google Scholar]
- Davies TJ, Savolainen V, Chase MW, Moat J, Barraclough TG. Environmental energy and evolutionary rates in flowering plants. Proceedings of the Royal Society of London. Series B: Biological Sciences. 2004b;271:2195–2200. doi: 10.1098/rspb.2004.2849. [DOI] [PMC free article] [PubMed] [Google Scholar]
- Dial KP, Marzluff JM. Nonrandom diversification within taxonomic assemblages. Systematic Zoology. 1989;38:26–37. [Google Scholar]
- Dixit R, Nasrallah JB. Recognizing self in the self-incompatibility response. Plant Physiology. 2001;125:105–108. doi: 10.1104/pp.125.1.105. [DOI] [PMC free article] [PubMed] [Google Scholar]
- Dodd ME, Silvertown J, Chase MW. Phylogenetic analysis of trait evolution and species diversity variation among Angiosperm families. Evolution. 1999;53:732–744. doi: 10.1111/j.1558-5646.1999.tb05367.x. [DOI] [PubMed] [Google Scholar]
- East EM. The distribution of self-sterility in the flowering plants. Proceedings of the American Philosophical Society. 1940;82:449–518. [Google Scholar]
- Eriksson O, Bremer B. Pollination systems, dispersal modes, life forms, and diversification rates in Angiosperm families. Evolution. 1992;46:258–266. doi: 10.1111/j.1558-5646.1992.tb02000.x. [DOI] [PubMed] [Google Scholar]
- Erwin D, Anstey R. New approaches to speciation in the fossil record. New York, NY: Columbia University Press; 1995. [Google Scholar]
- Ferrer MM, Good-Avila SV. Macrophylogenetic analyses of the gain and loss of self-incompatibility in the Asteraceae. New Phytologist. 2007;173:401–414. doi: 10.1111/j.1469-8137.2006.01905.x. [DOI] [PubMed] [Google Scholar]
- FitzJohn RG, Maddison WP, Otto SP. Estimating trait-dependent speciation and extinction rates from incompletely resolved phylogenies. Systematic Biology. 2009;58:595–611. doi: 10.1093/sysbio/syp067. [DOI] [PubMed] [Google Scholar]
- Franklin-Tong VE. Self-Incompatibility in Papaver rhoeas: progress in understanding mechanisms involved in regulating self-incompatibility in Papaver. In: Franklin-Tong VE, editor. Self-incompatibility in flowering plants. Berlin: Springer; 2008. [Google Scholar]
- Ganders FR. The biology of heterostyly. New Zealand Journal of Botany. 1979;17:605–635. [Google Scholar]
- Gibbs PE. Do homomorphic and heteromorphic self-incompatibility systems have the same sporophytic mechanism? Plant Systematics and Evolution. 1986;154:285–323. [Google Scholar]
- Givnish TJ. Ecological constraints on the evolution of breeding systems in seed plants: dioecy and dispersal in Gymnosperms. Evolution. 1980;34:959–972. doi: 10.1111/j.1558-5646.1980.tb04034.x. [DOI] [PubMed] [Google Scholar]
- Givnish TJ, Fires JC, Graham SW, et al. Phylogenetic relationships of monocots based on the highly informative plastid gene ndhF: evidence for widespread concerted convergence. Aliso. 2006;22:28–51. [Google Scholar]
- Givnish TJ, Ames M, McNeal JR, et al. Assembling the tree of the Monocotyledons: plastome sequence phylogeny and evolution of Poales. Annals of the Missouri Botanical Garden. 2010;97:584–616. [Google Scholar]
- Goldberg EE, Kohn JR, Lande R, Robertson KA, Smith SA, Igić B. Species selection maintains self-incompatibility. Science. 2010;330:493–495. doi: 10.1126/science.1194513. [DOI] [PubMed] [Google Scholar]
- Good-Avila SV, Majumder D, Amos H, Stephenson AG. Characterization of self-incompatibility in Campanula rapunculoides (Campanulaceae) through genetic analyses and microscopy. Botany. 2008;86:1–13. [Google Scholar]
- Goodwillie C. Multiple origins of self-compatibility in Linanthus section leptosiphon (Polemoniaceae): phylogenetic evidence from internal-transcribed-spacer sequence data. Evolution. 1999;53:1387–1395. doi: 10.1111/j.1558-5646.1999.tb05403.x. [DOI] [PubMed] [Google Scholar]
- Graham SW, Zgurski JM, McPherson MA, et al. Robust inference of monocot deep phylogeny using an expanded multigene plastid data set. Aliso. 2006;22:3–21. [Google Scholar]
- Grant V. Plant speciation. New York, NY: Columbia University Press; 1981.. [Google Scholar]
- Guyer C, Slowinski JB. Adaptive radiation and the topology of large phylogenies. Evolution. 1993;47:253–263. doi: 10.1111/j.1558-5646.1993.tb01214.x. [DOI] [PubMed] [Google Scholar]
- Hall JC, Iltis HH, Sytsma KJ. Molecular phylogenetics of core Brassicales, placement of orphan genera Emblingia, Forchhammeria, Tirania, and character evolution. Systematic Botany. 2004;29:654–669. [Google Scholar]
- Hampson C, Coleman G, Azarenko A. Does the genome of Corylus avellana L. contain sequences homologous to the self-incompatibility gene of Brassica? Theoretical and Applied Genetics. 1996;93:759–764. doi: 10.1007/BF00224073. [DOI] [PubMed] [Google Scholar]
- Heard SB, Hauser DL. Key evolutionary innovations and their ecological mechanisms. Historical Biology. 1995;10:151–173. [Google Scholar]
- Heilbuth JC. Lower species richness in dioecious clades. The American Naturalist. 2000;156:221–241. doi: 10.1086/303389. [DOI] [PubMed] [Google Scholar]
- Hiscock SJ, Allen AM. Diverse cell signalling pathways regulate pollen–stigma interactions: the search for consensus. New Phytologist. 2008;179:286–317. doi: 10.1111/j.1469-8137.2008.02457.x. [DOI] [PubMed] [Google Scholar]
- Hiscock SJ, Kües U. Cellular and molecular mechanisms of sexual incompatibility in plants and fungi. International Review of Cytology. 1999;193:165–295. doi: 10.1016/s0074-7696(08)61781-7. [DOI] [PubMed] [Google Scholar]
- Hiscock SJ, McInnis SM. The diversity of self-incompatibility systems in flowering plants. Plant Biology (Stuttgart) 2003a;5:23–32. [Google Scholar]
- Hiscock SJ, McInnis SM. Pollen recognition and rejection during the sporophytic self-incompatibility response: Brassica and beyond. Trends in Plant Science. 2003b;12:606–613. doi: 10.1016/j.tplants.2003.10.007. [DOI] [PubMed] [Google Scholar]
- Hodges SA. Floral nectar spurs and diversification. International Journal of Plant Science. 1997;158:S81–S88. [Google Scholar]
- Hodges SA, Arnold ML. Spurring plant diversification: are floral nectar spurs a key innovation? Proceedings of the Royal Society of London B. 1995;262:343–348. [Google Scholar]
- Igic B, Kohn JR. Evolutionary relationships among self-incompatibility RNases. Proceedings of the National Academy of Sciences of the USA. 2001;98:13167–13171. doi: 10.1073/pnas.231386798. [DOI] [PMC free article] [PubMed] [Google Scholar]
- Igic B, Bohs L, Kohn JR. Ancient polymorphism reveals unidirectional breeding system shifts. Proceedings of the National Academy of Sciences of the USA. 2006;103:1359–1363. doi: 10.1073/pnas.0506283103. [DOI] [PMC free article] [PubMed] [Google Scholar]
- Igic B, Lande R, Kohn J. Loss of self-incompatibility and its evolutionary consequences. International Journal of Plant Sciences. 2008;169:93–104. [Google Scholar]
- Isaac NJB, Agapow P-M, Harvey PH, Purvis A. Phylogenetically nested comparisons for testing correlates of species richness: a simulation study of continuous variables. Evolution. 2003;57:18–26. doi: 10.1111/j.0014-3820.2003.tb00212.x. [DOI] [PubMed] [Google Scholar]
- Jablonski D. Scale and hierarchy in macroevolution. Palaentology. 2007;50:87–109. [Google Scholar]
- Kadereit JW, Griebeler EM, Comes HP. Quaternary diversification in European alpine plants: pattern and process. Philosophical Transactions of the Royal Society of London. Series B: Biological Sciences. 2004;359:265–274. doi: 10.1098/rstb.2003.1389. [DOI] [PMC free article] [PubMed] [Google Scholar]
- Kay KM, Voelckel C, Yang JY, Hufford KM, Kaska DD, Hodges SA. Floral characters and species diversification. In: Harder LD, Barrett SCH, editors. Ecology and evolution of flowers. Oxford: Oxford University Press; 2008. [Google Scholar]
- Kohn JR, Graham SW, Morton B, Doyle JJ, Barrett SCH. Reconstruction of the evolution of reproductive characters in Pontederiaceae using phylogenetic evidence from chloroplast DNA restriction-site variation. Evolution. 1996;50:1454–1469. doi: 10.1111/j.1558-5646.1996.tb03919.x. [DOI] [PubMed] [Google Scholar]
- Kowyama Y, Tsuchiya T, Kakeda K. Molecular genetics of sporophytic self-incompatibility in Ipomoea; a member of the Convolvulaceae. In: Franklin-Tong VE, editor. Self-incompatibility in flowering plants. Berlin: Springe; 2008. [Google Scholar]
- Kubo K-i, Entani T, Takara A, et al. Collaborative non-self recognition system in S-RNase–based self-incompatibility. Science. 2010;330:796–799. doi: 10.1126/science.1195243. [DOI] [PubMed] [Google Scholar]
- Langridge P, Baumann U. Self-incompatibility in the grasses. In: Franklin-Tong VE, editor. Berlin: Springer; 2008. Self-incompatibility in flowering plants. [Google Scholar]
- Lee H-S, Singh A, Kao T-h. RNase X2, a pistil-specific ribonuclease from Petunia inflata, shares sequence similarity with solanaceous S proteins. Plant Molecular Biology. 1992;20:1131–1141. doi: 10.1007/BF00028899. [DOI] [PubMed] [Google Scholar]
- Li X, Paech N, Nield J, Hayman D, Langridge P. Self-incompatibility in the grasses: evolutionary relationship of the S gene from Phalaris coerulescens to homologous sequences in other grasses. Plant Molecular Biology. 1997;34:223–232. doi: 10.1023/a:1005802327900. [DOI] [PubMed] [Google Scholar]
- Lundqvist A. Complex self-incompatibility systems in angiosperms. Proceedings of the Royal Society of London. Series B Biological Sciences. 1975;188:235–245. [Google Scholar]
- McClure B, Franklin-Tong V. Gametophytic self-incompatibility: understanding the cellular mechanisms involved in ‘self’ pollen tube inhibition. Planta. 2006;224:233–245. doi: 10.1007/s00425-006-0284-2. [DOI] [PubMed] [Google Scholar]
- McCubbin A, Lee C, Hetrick A. Identification of genes showing differential expression between morphs in developing flowers of Primula vulgaris. Sexual Plant Reproduction. 2006;19:63–72. [Google Scholar]
- Maddison WP. Confounding asymmetries in evolutionary diversification and character change. Evolution. 2006;60:1743–1746. [PubMed] [Google Scholar]
- Maddison WP, Maddison DR. Mesquite: a modular system for evolutionary analysis. 2·73. 2010 [Google Scholar]
- Magallón S, Sanderson MJ. Absolute diversification rates in angiosperm clades. Evolution. 2001;55:1762–1780. doi: 10.1111/j.0014-3820.2001.tb00826.x. [DOI] [PubMed] [Google Scholar]
- Mathews S, Donoghue MJ. The root of angiosperm phylogeny inferred from duplicate phytochrome genes. Science. 1999;286:947–950. doi: 10.1126/science.286.5441.947. [DOI] [PubMed] [Google Scholar]
- Moore MJ, Soltis PS, Bell CD, Burleigh JG, Soltis DE. Phylogenetic analysis of 83 plastid genes further resolves the early diversification of eudicots. Proceedings of the National Academy of Sciences. 2010;107:4623–4628. doi: 10.1073/pnas.0907801107. [DOI] [PMC free article] [PubMed] [Google Scholar]
- Nee S, Barraclough T, Harvey P. Temporal changes in biodiversity: detecting patterns and identifying causes. In: Gaston K, editor. Biodiversity. Oxford: Oxford University Press; 1996. [Google Scholar]
- Nettancourt D. Incompatibility and incongruity in wild and cultivated plants. Berlin: Springer-Verlag; 2001.. [Google Scholar]
- Niklas KJ. The evolutionary biology of plants. Chicago, IL: Chicago University Press; 1997.. [Google Scholar]
- Olmstead RG. The origin and function of self-incompatibility in flowering plants. Sexual Plant Reproduction. 1989;2:127–136. [Google Scholar]
- Pandey KK. Evolution of gametophytic and sporophytic systems of self-incompatibility in angiosperms. Evolution. 1960;14:98–115. [Google Scholar]
- Pandey KK. Elements of the S-gene complex. V. Interspecific cross-compatibility relationships and theory of the evolution of the S complex. Genetica. 1969;V40:447–474. [Google Scholar]
- Purvis A. Using interspecies phylogenies to test macroevolutionary hypotheses. In: Harvey PH, Brown AJL, Smith JM, Nee S, editors. New uses for new phylogenies. Oxford: Oxford University Press; 1996. [Google Scholar]
- Rabosky DL. Extinction rates should not be estimated from molecular phylogenies. Evolution. 2010;64:1816–1824. doi: 10.1111/j.1558-5646.2009.00926.x. [DOI] [PubMed] [Google Scholar]
- Raup DM, Sepkoski JJ. Periodicity of extinctions in the geologic past. Proceedings of the National Academy of Sciences of the USA. 1984;81:801–805. doi: 10.1073/pnas.81.3.801. [DOI] [PMC free article] [PubMed] [Google Scholar]
- Ricklefs RE, Renner SS. Species richness within families of flowering plants. Evolution. 1994;48:1619–1636. doi: 10.1111/j.1558-5646.1994.tb02200.x. [DOI] [PubMed] [Google Scholar]
- Routley MB, Bertin RI, Husband BC. Correlated evolution of dichogamy and self-incompatibility: a phylogenetic perspective. International Journal of Plant Science. 2004;165:983–993. [Google Scholar]
- Ruiz-Zapata T, Arroyo MTK. Plant reproductive ecology of a secondary deciduous tropical forest in Venezuela. Biotropica. 1978;10:221–230. [Google Scholar]
- Sage TL, Sampson FB. Evidence for ovarian self-incompatibility as a cause of self-sterility in the relictual woody angiosperm, Pseudowintera axillaris (Winteraceae) Annals of Botany. 2003;91:807–816. doi: 10.1093/aob/mcg085. [DOI] [PMC free article] [PubMed] [Google Scholar]
- Sage TL, Price MV, Waser NM. Self-sterility in Ipomopsis aggregata (Polemoniaceae) is due to prezygotic ovule degeneration. American Jorunal of Botany. 2006;93:254–262. doi: 10.3732/ajb.93.2.254. [DOI] [PubMed] [Google Scholar]
- Sargent R. Floral symmetry affects speciation rates in angiosperms. Proceedings of the Royal Society B: Biological Sciences. 2004;271:603–608. doi: 10.1098/rspb.2003.2644. [DOI] [PMC free article] [PubMed] [Google Scholar]
- Schierup MH, Vekemans X, Charlesworth D. The effect of subdivision on variation at multi-allelic loci under balancing selection. Genetical Reserch Cambridge. 2000;76:51–62. doi: 10.1017/s0016672300004535. [DOI] [PubMed] [Google Scholar]
- Schoen DJ, Johnston MO, L'Heureux A-M, Marsolais JV. Evolutionary history of the mating system in Amsinckia (Boraginaceae) Evolution. 1997;51:1090–1099. doi: 10.1111/j.1558-5646.1997.tb03956.x. [DOI] [PubMed] [Google Scholar]
- Schönenberger J, Anderberg AA, Sytsma KJ. Molecular phylogenetics and patterns of floral evolution in the Ericales. International Journal of Plant Sciences. 2005;166:265–288. [Google Scholar]
- Schönenberger J, von Balthazar M, Sytsma KJ. Diversity and evolution of floral structure among early diverging lineages in the Ericales. Philosophical Transactions of the Royal Society B: Biological Sciences. 2010;365:437–448. doi: 10.1098/rstb.2009.0247. [DOI] [PMC free article] [PubMed] [Google Scholar]
- Seavey S, Bawa K. Late-acting self-incompatibility in angiosperms. The Botanical Review. 1986;52:195–219. [Google Scholar]
- Shore JS, Arbo MM, Fernández A. Breeding system variation, genetics and evolution in the Turneraceae. New Phytologist. 2006;171:539–551. doi: 10.1111/j.1469-8137.2006.01807.x. [DOI] [PubMed] [Google Scholar]
- Sims HJ, McConway KJ. Nonstocahstic variation of species-level diversification rates within Angiosperms. Evolution. 2003;57:460–479. doi: 10.1111/j.0014-3820.2003.tb01538.x. [DOI] [PubMed] [Google Scholar]
- Slowinski JB, Guyer C. Testing whether certain traits have caused amplified diversification: an improved method based on a model of random speciation and extinction. The American Naturalist. 1993;142:1019–1024. doi: 10.1086/285586. [DOI] [PubMed] [Google Scholar]
- Sokal RR, Rolhf FJ. Biometry. New York, NY: W.H. Freedman and Co; 1995.. [Google Scholar]
- Soltis DE, Soltis PS, Chase MW, et al. Angiosperm phylogeny inferred from 18S rDNA, rbcL, and atpB sequences. Botanical Journal of the Linnean Society. 2000;133:381–461. [Google Scholar]
- Soltis DE, Smith SA, Cellinese N, et al. Angiosperm phylogeny: 17 genes, 640 taxa. American Journal of Botany. 2011;98:704–730. doi: 10.3732/ajb.1000404. [DOI] [PubMed] [Google Scholar]
- Soltis PS, Endress PK, Chase MW, Soltis DE. Phylogeny and evolution of angiosperms. Sunderland, MA: Sinauer Associates; 2005.. [Google Scholar]
- Stanley S. Macroevolution pattern and process. Baltimore, MA: John Hopkins University Press; 1979.. [Google Scholar]
- Stebbins GL. Self fertilization and population variability in the higher plants. The American Naturalist. 1957;91:337–354. [Google Scholar]
- Stebbins GL. Why are there so many species of flowering plants? BioScience. 1981;31:573–577. [Google Scholar]
- Steinbachs JE, Holsinger KE. S-RNase-mediated gametophytic self-incompatibility is ancestral in Eudicots. Molecular Biology and Evolution. 2002;19:825–829. doi: 10.1093/oxfordjournals.molbev.a004139. [DOI] [PubMed] [Google Scholar]
- Stevens PF. onwards. Angiosperm Phylogeny Website. Version 9, June 2008 [and more or less continuously updated since] 2010 http://www.mobot.org/MOBOT/research/APweb/ ) [Google Scholar]
- Swanson R, Edlund AF, Preuss D. Species specificity in pollen–pistil interactions. Annual Review of Genetics. 2004;38:793–818. doi: 10.1146/annurev.genet.38.072902.092356. [DOI] [PubMed] [Google Scholar]
- Takebayashi N, Morrell PL. Is self-fertilization an evolutionary dead end? Revisiting an old hypothesis with genetic theories and a macroevolutionary approach. American Journal of Botany. 2001;88:1143–1150. [PubMed] [Google Scholar]
- Vamosi SM, Vamosi JC. Endless tests: guidelines for analysing non-nested sister-group comparisons. Evolutionary Ecology Research. 2005;7:567–579. [Google Scholar]
- Vieira J, Fonseca N, Vieira C. An S-RNase -based gametophytic self-incompatibility system evolved only once in Eudicots. Journal of Molecular Evolution. 2008;67:179–190. doi: 10.1007/s00239-008-9137-x. [DOI] [PubMed] [Google Scholar]
- Weller SG, Donoghue MJ, Charlesworth D. The evolution of self-incompatibility in flowering plants: a phylogenetic approach. In: Hoch PC, Stephenson AG, editors. Experimental and molecular approaches to plant biosystematics. St. Louis, MO: Missouri Botanical Garden; 1995. [Google Scholar]
- Whitehouse HK. Multiple-allelomorph incompatibility of pollen and style in the evolution of the angiosperms. Annals of Botany. 1950;14:198–216. [Google Scholar]
- Wikström N, Savolainen V, Chase MW. Evolution of the angiosperms: calibrating the family tree. Proceedings of the Royal Society of London Series B. 2001;268:2211–2220. doi: 10.1098/rspb.2001.1782. [DOI] [PMC free article] [PubMed] [Google Scholar]
- Wikström N, Savolainen V, Chase MW. Angiosperm divergence times: congruence and incongruence between fossils and sequence divergence estimates. In: Donoghue PCJ, Smith MP, editors. Telling the evolutionary time. New York, NY: Routledge; 2003. [Google Scholar]
- Wing SL, Boucher LD. Ecological aspects of the Cretaceous flowering plant radiation. Annual Review of Earth and Planetary Sciences. 1998;26:379–421. [Google Scholar]
- Wright S. The distribution of self-incompatibility alleles in populations. Evolution. 1964;18:609–619. [Google Scholar]
- Wright SI, Barrett SCH. The long-term benefits of self-rejection. Science. 2010;330:459–460. doi: 10.1126/science.1198063. [DOI] [PubMed] [Google Scholar]
- Wright SI, Ness RW, Foxe JP, Barrett SCH. Genomic consequences of outcrossing and selfing in plants. International Journal of Plant Sciences. 2008;169:105–118. [Google Scholar]
- Zavada MS, Taylor TN. The role of self-incompatibility and sexual selection in the gymnosperm-angiosperm transition: a hypothesis. The American Naturalist. 1986;128:538–550. [Google Scholar]
- Zink RM, Slowinski JB. Evidence from molecular systematics for decreased avian diversification in the pleistocene epoch. Proceedings of the National Academy of Sciences of the USA. 1995;92:5832–5835. doi: 10.1073/pnas.92.13.5832. [DOI] [PMC free article] [PubMed] [Google Scholar]
Associated Data
This section collects any data citations, data availability statements, or supplementary materials included in this article.