

Abstract
Drebrin A, an actin-binding protein, is a key regulatory element in synaptic plasticity of neuronal dendrites. Understanding how drebrin binds and remodels F-actin is important for a functional analysis of their interactions. Conventionally, molecular models for protein-protein interactions use binding parameters derived from bulk solution measurements with limited spatial resolution, and the inherent assumption of homogeneous binding sites. In the case of actin filaments, their structural and dynamic states—as well as local changes in those states—may influence their binding parameters and interaction cooperativity. Here, we probed the structural remodeling of single actin filaments and the binding cooperativity of DrebrinA1-300 –F–actin using AFM imaging. We show direct evidence of DrebrinA1-300-induced cooperative changes in the helical structure of F-actin and observe the binding cooperativity of drebrin to F-actin with nanometer resolution. The data confirm at the in vitro molecular level that variations in the F-actin helical structure can be modulated by cooperative binding of actin-binding proteins.
Introduction
Drebrin A is a key regulatory actin-binding protein (ABP) of neuron dendrites (1). Drebrin-F-actin complexes are known to play a critical role in synaptic plasticity and cognition (2). Reduced drebrin levels are associated with Alzheimer's and Down syndrome (3). Understanding how drebrin binds to F-actin and influences the structure and conformation of the bound and unbound actin segments can reveal fundamental aspects of drebrin interactions and drebrin-induced remodeling of actin filaments.
Cooperativity of binding and filaments' remodeling are important aspects of actin regulation by several ABPs (4,5). Measurements of cooperativity rely typically on fitting solution-binding data to the Hill equation (6), to obtain the cooperativity coefficient. In case of all-or-none binding, the Hill cooperativity coefficient reflects the binding stoichiometry; in all other cases, it provides fundamental information about intramolecular interactions (7,8). In bulk studies, individual macromolecules within an ensemble are assumed to be identical. As shown recently by single-molecule methods, such an assumption results in underestimation of cooperativity in the presence of molecular heterogeneity (9).
Molecular models of F-actin assume well-defined filaments possessing a homogeneous rodlike structure. Further, these models assume actin as an infinitely cooperative lattice with n sites that exist in either fully bound or unbound states. However, there is abundant evidence to suggest polymorphic states of F-actin and variations in the helical twist of the filament (10–12). Moreover, different structures of the filament have been reported for its complexes with ABPs (4). Analyzing the role of substructural heterogeneity in F-actin in the binding cooperativity of ABPs is critical for deriving accurate molecular models of actin interactions. Conventional solution experiments have insufficient resolution and are unable to detect single-filament-level changes in helical periodicity or conformation upon drebrin or other ABPs binding (13–15).
The interplay of structural and conformational changes in F-actin induced by ABPs, and their possible binding cooperativity can be investigated by atomic force microscopy (AFM) approaches. Here, we took advantage of the resolution of AFM to detect drebrin-binding assemblies (cluster size) at the single-filament level and to analyze the changes in helical periodicity of drebrin-bound and -unbound regions.
Materials and Methods
Protein preparation
Skeletal actin was purified according to Spudich and Watt (16). Yeast actin mutant A167C/C374A was purified as described in Grintsevich et al. (13) and labeled with acrylodan at 1:3 (protein/label) molar ratio at 4°C for 5–6 h. Drb1-300 construct was expressed and purified as previously described in Grintsevich et al. (13).
Protein labeling
Drb1-300KCK was created by introducing DNA sequence corresponding to Lys-Cys-Lys, into the Drb1-300 construct, employing the QuikChange Kit (Stratagene, La Jolla, CA). The expression and purification scheme was essentially the same as for Drb1-300 construct. Drb1-300KCK was labeled with Cy3-maleimide fluorescent dye as described in Quinlan et al. (17). In brief, twofold molar excess of Cy3 dye was added to the purified Drb1-300KCK in the labeling buffer (10 mM HEPES, pH 7, 50 mM KCl, 50 μM TCEP). The reaction was carried out for 10 min at the room temperature (RT) and stopped with 10 mM dithreitol (DTT). Labeled protein was dialyzed against buffer D (5 mM Tris, pH 8, 100 mM KCl, and 1 mM DTT) overnight at 4°C, then run through a 0.5 ml Zeba Spin Desalting Column (Thermo Fisher Scientific, Waltham, MA) and stored in buffer D supplemented with 0.25 mM TCEP. Protein concentration was determined by Bradford assay using bovine serum albumin as a standard. The extent of Cy3 incorporation was determined under denaturing conditions (7.5 M urea) using ε550 = 150,000 M−1 cm−1 (GE Healthcare, Little Chalfont, Buckinghamshire, UK). The extent of labeling was estimated ∼120%. The retained function of Drb1-300KCK-Cy3 construct was confirmed in cosedimentation assays.
Cosedimentation assays with Drb1-300KCK-Cy3
Ca-ATP-G-actin was converted to Mg-G-actin by addition of 10× Mg/EGTA mix followed by 2–3 min incubation at RT. Polymerization was initiated by addition 1/10 (V/V) of the 10× KM2EH buffer (final concentrations: 10 mM HEPES, pH 7.5, 2 mM MgCl2, 0.4 mM EGTA, 50 mM KCl) and was carried out for 1 h at RT. Actin filaments were stabilized with Alexa488-phalloidin and used for total internal reflection fluorescence (TIRF) microscopy imaging and cosedimentation assays. For cosedimentation assays, Drb1-300KCK-Cy3 at different concentrations was incubated with Alexa488-phalloidin-F-actin for ∼20 min at RT, and then centrifuged at 312,500 × g for 20 min, at 4°C, in a TLA-100 rotor (Beckman Coulter, Brea, CA). Samples' handling and gel sodium-dodecyl sulfate analysis was carried out as previously described in Grintsevich et al. (13).
TIRF microscopy
Alexa488-phalloidin-F-actin (0.9 μM) was mixed with 0.28 μM Drb1-300KCK-Cy3, then diluted to 2.3 nM into KM2EH and immediately immobilized on poly-L-lysine coverslips. The buffer was supplemented with 100 mM DTT to prevent the photobleaching. The resulting images were filtered using the softwares SPIP (Image Metrology, Hørsholm, Denmark) and ImageJ (National Institutes of Health, Bethesda, MD) to minimize the background.
AFM imaging of actin filaments
Mg-ATP-G-actin was polymerized by addition of 2 mM MgCl2 (1 h, RT). F-actin and Drb1-300 were mixed briefly in a dilution buffer (10 mM Tris, pH 8, 100 mM KCl, 2 mM MgCl2, 1 mM DTT, and 0.2 mM ATP) at different molar ratios. Drb1-300 was allowed to bind F-actin in solution and was then imaged by AFM on mica substrates under ambient conditions. A quantity of 5.0 μL of the solution was added to freshly cleaved mica substrates, incubated for 1 min, and gently rinsed with dilution buffer three times (to remove unbound protein) and allowed to air-dry. Dimension 5000 AFM (Bruker AXS, Madison, WI) under tapping mode was used to image actin samples with OTESP probes (Bruker AXS). Topographic height images were recorded at 1024 × 1024 pixels at 1 Hz. To confirm the analysis of drebrin-induced changes in undecorated segments of F-actin and the length estimates of such altered segments, we verified that these changes are independent of the number of surface washes after adsorption of proteins to mica.
AFM image processing
Images were flattened and plane-fitted by using the microscope's analysis software (SPIP Ver. 5.3.2; Image Metrology). The surface height was determined using histogram function and was subtracted from the measured height of actin- or drebrin-bound actin, before volume determination. The filaments were then detected individually using the grain analysis function. The density slice selects the pixels above the surface that represent the filament section to be analyzed. The image analysis function scans the image, and detects all of the highlighted segments within the density slice and generates height and area information. Height and width measures of bare- versus drebrin-bound filaments were used as reference to detect drebrin-decorated and -undecorated regions along the filaments. Individual helixes were measured using Fourier transform of isolated filament sections for assessing conformational change-spread in neighboring helix. Bare actin filaments were always imaged simultaneously as controls along with drebrin-decorated filaments to avoid any artifacts in helix measurements due to tip variations. Bare F-actin was measured to yield helical repeat (36 ± 2 nm), height (1.8 ± 1.1 nm), and width (20 ± 1.1 nm) of the filament. The drebrin-bound F-actin regions appear higher (2.4 ± 0.1 nm) and wider (40.0 ± 0.4 nm). The frequency histograms of the helix were plotted in Origin Ver. 8.0 (OriginLab, Northampton, MA). Average values are reported as mean ± SD.
Results
Cooperative binding of Drb1-300 construct to actin
As we reported earlier, Drb1-300 represents the actin-binding core of a drebrin molecule and its affinity to α-actin is close to that of full-length protein (Fig. 1 A). To assess the binding of Drb1-300 to actin filaments, we used several solution-based approaches, such as high-speed cosedimentation (13), titration of acrylodan-labeled yeast actin mutant A167C/C374A (sensitive to the drebrin binding), and Cy3 labeling of Drb1-300-KCK mutant (to enable UV-based drebrin detection on sodium-dodecyl sulfate gels; data not shown). Analysis of binding isotherms revealed small but persistent deviations from hyperbolic profiles that can arise from cooperative binding of Drb1-300 to actin (Fig. 1 B). This called for further investigation of the drebrin-actin-binding cooperativity. Several cooperativity models have been formulated for analyzing binding of ligands to a macromolecule containing multiple and identical interaction sites, such as the Hill equation and nearest-neighbor cooperativity model that was successfully applied to the binding of cofilin to actin filaments (18).
Figure 1.

(A) Schematic representation of domain organization of different drebrin A constructs. N and C denote the N- or the C-terminus of protein sequences. Actin-binding domain (ABD); ADF homology domain (DrADF). (B) Solution indication of Drb1-300 binding cooperativity. Changes in fluorescence of acrylodan-labeled A167C/C374A yeast actin mutant upon Drb1-300 binding. Fluorescence in the absence of Drb1-300 was offset to 0. Binding isotherm shows deviation from hyperbolic profile at low Drb1-300 binding densities (range of total concentrations of Drb1-300 is between 0 and 0.2 μM) (inset).
Several factors complicate the choice of a suitable model for fitting our solution-binding data: 1), Structural plasticity of F-actin argues against absolute homogeneity of all drebrin-interacting sites within filament (12). 2), At the binding stoichiometry 3:1 (actin/drebrin), potential overlap of the binding sites should be taken into consideration. 3), Potential propagation of cooperative effects impacting other binding sites over some distance within the filament would make nearest-neighbor cooperativity model less suitable (18). 4), Interaction between neighboring drebrin molecules bound to actin filament was never examined and cannot be ruled out. Considering these limitations, we chose to probe for drebrin-binding cooperativity at a single-filament level. Our goal was to confirm by direct observation (TIRF microscopy) the cooperative binding of Drb1-300 to actin that was suggested by bulk solution measurements. If confirmed, the follow-up goal was to gain insight into drebrin clustering and its effect on the undecorated F-actin regions by high-resolution AFM.
Drb1-300 molecular fragment associated with F-actin binding and remodeling
Our biochemical data on several drebrin constructs (13,19) revealed that the binding affinity of Drb1-300 to F-actin is very close to that of full-length drebrin A (Kapp = 0.2 and 0.12 μM, respectively). Also, because of identical sequence 1–300 in all three drebrin isoforms (E, A, sA), the exploration of morphological changes in F-actin upon Drb1-300 interaction should help to clarify potential differences (if any) in F-actin remodeling among the different drebrin isoforms.
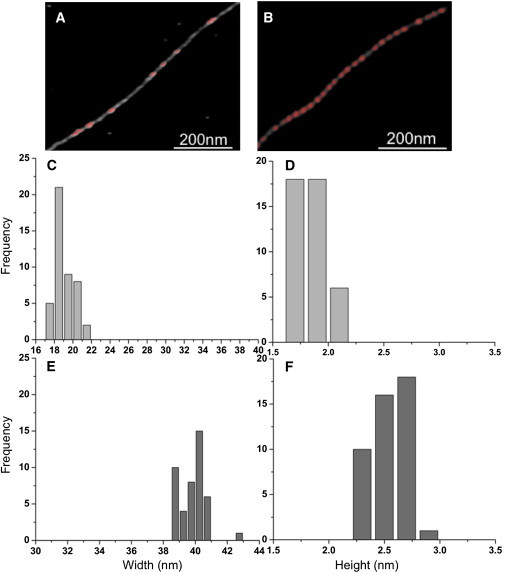
Tapping mode AFM (20), is an emerging powerful tool for imaging bio-molecules with sub-nanometer resolution (21–23), bionanoparticles (24), DNA-protein complexes, etc. (25). Here, we used AFM imaging to quantitatively analyze the effects of drebrin binding on F-actin's structural and mechanical features at the single filament level. Fig. 2, A–C, shows Drb1-300 decoration of the actin filaments for an actin: drebrin mole ratio of 2:1. Drb1-300 bound actin filaments show similar contiguous “pearl necklace” morphology as observed for full-length drebrin A. The measured helical pitch of single filaments 40 ± 1.2 nm (n = 50 filaments) (Fig. 2 D) was found to be identical to the periodicity shown by F-actin with full-length drebrin A bound it (helical periodicity 40 ± 0.8 nm) (19). The observed height (2.4 ± 0.1 nm) and width (40 ± 0.4 nm) for Drb1-300 bound actin filaments (Fig. 2, E and F) was consistent with the reduced mass of the Drb1-300 molecule compared to full-length drebrin. Thus, the observed structural and mechanical remodeling of F-actin induced by Drb1-300 provided direct single filament based evidence that the Drb1-300 fragment of drebrin is indeed responsible for F-actin binding and remodeling.
Figure 2.

Drb1-300 induces the same structural remodeling of F-actin as the full-length drebrin A. AFM analysis of Drb1-300 binding to F-actin (1:1 ratio). (A) AFM topographic image of Drb1-300 decoration of actin filaments. (B) Single Drb1-300 decoration of actin filament. (C) Zoomed in view of a single decorated actin filament. (D) Line profile of a decorated filament segment (indicated by a straight line in panel C). (E and F) Width and height of drebrin-bound filament are observed in cross-sectional profiles.
TIRF microscopy and AFM indicate Drb1-300 clustering on actin filaments
To image Drb1-300 binding to actin filaments, we first employed two-color TIRF microscopy. Our images revealed a clusterlike attachment of Drb1-300KCK construct labeled with Cy3-maleimide to Alexa 488-stabilized actin filaments, confirming the cooperative interactions between Drb1-300 and F-actin (Fig. 3). Typical individual actin filaments with clusters of drebrin bound along them are shown in Fig. 3, B–D.
Figure 3.
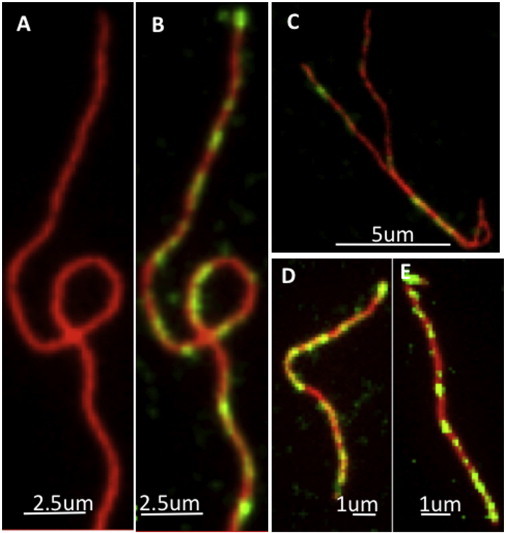
TIRF microscopy images showing Drb1-300KCK-Cy3 (0.28 μM) binding in clusters to Alexa Fluor 488 phalloidin-stabilized actin filaments (0.9 μM) after immediate dilution into F-buffer. (A) Zoomed-in images of actin filament and (B) F-actin with Drb1-300, showing clusters of drebrin bound along the filament. (C–E) Individual actin filaments with clusters of drebrin bound to them.
Because of the low resolution achieved in TIRF measurements, a more detailed analysis of nanoscale drebrin binding and F-actin modulation at the single filament level was pursued via AFM imaging of Drb1-300-F-actin complexes. At 1:1 Drb1-300:actin mole ratio, actin filaments were observed to be fully decorated with drebrin whereas at a lower Drb1-300:actin ratio only few short (<100 nm in length) drebrin bound regions were detected. The binding cooperativity of Drb1-300–F-actin was demonstrated via analysis of AFM images obtained for actin filaments partially decorated with Drb1-300 at the optimized mole ratio of 1:3 drebrin/actin. Under sub-saturating conditions, Drb1-300 exhibited a unique assembly of clearly resolved Drb1-300 clusters (∼40–120-nm long, marked by arrows in Fig. 4 A along the single filament structure with intermittent unbound regions. A segment of that filament is imaged at high resolution in Fig. 4 B.
Figure 4.

AFM images of F-actin decorated at subsaturating ratios with Drb1-300 (3:1 ratio) reveal its cooperative binding along individual filaments. (A) Single filament decorated partially by Drb1-300 clusters (arrows). (B) Nanometer resolution of segment of filament shown in panel A. (C and D) Examples of single filaments with both drebrin-decorated and -undecorated regions. Frequency and length of (E) individual Drb1-300-decorated actin filaments segments. (F) Individual undecorated filament segments measured from AFM images of the filaments (>n = 50 filaments scanned).
Noncontiguous Drb1-300 bound (decorated) regions on actin filaments with segments containing drebrin free (undecorated) gaps were analyzed as well. Drb1-300 bound regions appear as distinct large clusters (2.4-nm high; 40-nm wide) in contrast to thin bare F-actin regions. Some typical binding clusters decorating single actin filaments are shown in Fig. 4, C and D. The size of Drb1-300 clusters on F-actin depends on the binding density and the extent of cooperativity. Fig. 4 E shows length of individual drebrin bound segments (nm) with an average cluster size (total number of segments, n = 239) of 107.3 ± 5.3 nm obtained from analysis of 50 filaments. Considering that the helical pitch of drebrin bound F-actin is modified from 36 to ∼40 nm, the average cluster size corresponds to ∼2.6 F-actin helical repeats. In contrast to that, the mean unbound F-actin or gap size (n = 185) of 121.6 ± 7.6 nm (Fig. 4 F) corresponds to ∼3.4 or 3 F-actin helical repeats, assuming the length of helical pitch equals to 36 or 40 nm, respectively.
Conformational change spread: Drb1-300 binding affects unbound segments of F-actin
We tested next whether binding of drebrin to F-actin influences the helical structure of neighboring unbound F-actin regions. F-actin (unbound) first and second neighboring helical periodicities (Fig. 5) were measured from Fourier transform of nanometer resolution AFM images (Fig. 5 A). The helical parameters determined for first (Fig. 5 B) and second (Fig. 5 C) unbound segments indicate distinct propagation of a change in F-actin periodicity (∼40nm) beyond the Drb1-300 bound sites. The changed pitch is clearly distinct from the 36-nm pitch of unbound F-actin helix in the absence of any neighboring drebrin cluster (n = 25). We found that the pitch increase in drebrin neighboring-unbound F-actin helix propagates over up to two helical repeats of F-actin (Fig. 5). Analysis of unbound regions on F-actin next to clusters of full-length drebrin (19) reveals similar changes in helical pitch (i.e., 40 nm) to those observed for Drb1-300 (19).
Figure 5.

Drb1-300 binding results in propagation of helical periodicity change in F-actin. (Inset) First (−), second (=), and third (≡) bare F-actin helical repeats that are located next to the drebrin-bound actin region. These images were obtained with partially decorated Drb1-300 F-actin (3:1 ratio) showing both drebrin-bound and bare segments of a filament. Actin filaments have normal or undertwisted conformations depending on their binding of Drb1-300 and/or proximity to the Drb1-300 bound segment. (A–C) Frequency of individual F-actin helix repeats (crossover distances) measured in the Drb1-300 unbound (gap) regions for the first-, second-, and third-closest helical repeat neighbors (next to the bound segments) respectively.
Discussion
Structural and cooperative changes in F-actin induced by Drb binding
Electron microscopy (EM) is currently the main source of structural information on F-actin complexes with ABPs. Recently, reconstruction of filaments obtained by acquisition of many low-dose images from cryo-electron microscopy (cryo-EM) has proven to be very powerful in elucidating F-actin architecture (14,15) and capable of revealing details at resolutions up to 3.5–4 Å (26,27). Cryo-EM is especially useful in analyzing F-actin structures with uniform helical symmetry. It produces the average structure for the entire actin filaments population, but does not reveal easily the heterogeneity of individual helix changes. More advanced applications of cryo-EM (14,28) can identify populations of different F-actin structures, but do not analyze individual filaments. In this study, AFM imaging was used successfully to quantitatively analyze the effects of drebrin binding on F-actin's structural and mechanical features at the single-filament level.
Such information cannot be derived from our TIRF experiments, which have limited spatial resolution (∼300 nm)—insufficient to measure the size of the actin-bound protein cluster and the resulting structural changes in F-actin. Although AFM technique has not been applied yet to study binding cooperativity of protein-protein interactions, it enabled us to determine the size of drebrin clusters bound to F-actin, not resolved by other biochemical or biophysical techniques. AFM imaging of F-actin decorated with Drb1-300 at low stoichiometric ratios provides direct experimental evidence, at the single-filament level, that Drb1-300 binds to F-actin in nanoscale clusters of preferentially 40- and 80-nm size (Fig. 4 E and Fig. 6). Thus, there is a high probability that drebrin binding occurs preferentially in clusters of one or two helical repeats.
Figure 6.
Pattern of drebrin clusters bound to actin filament. Actin filament backbone is in gray and the bound drebrin clusters are in red. (A) Filament with few bound clusters (low density) and (B) high bound clusters (high density). The criteria for determining drebrin-bound or bare F-actin regions are based on the measured dimensions of F-actin (height and width). (C and E) Differences in width. (D and F) Differences in height of -unbound and drebrin-bound regions of partially decorated F-actin.
At substoichiometric ratios, the density of such clusters is reduced (Fig. 6). The fact that under such conditions filaments do not appear either fully decorated or bare, but instead are decorated with drebrin clusters of different size, indicates that its binding cooperativity to actin is not very strong. An important aspect of protein interactions with F-actin that requires better understanding is the inherent influence of heterogeneity in F-actin substructure on binding cooperativity of ABPs. In this study, we have measured the changes in helical periodicity of F-actin upon drebrin binding and the propagation of its binding effects within the filament. AFM shows that drebrin binding induces helical changes in F-actin in both the directly occupied and the unbound regions, i.e., it reveals the propagation of the drebrin-induced structural changes to the adjacent, unbound regions on the filaments.
There is abundant previous evidence for cooperative binding of ABPs to F-actin and the propagation of their effects along the filaments. Cooperative binding of cofilin to F-actin and the propagation of the resulting change in actin has been shown by several methods (12,18,29,30). Similarly, gelsolin has been reported to have long-range effects on actin filaments, altering their torsional rigidity, affinity for cofilin, and other parameters. Our work on Drb1-300 interactions with actin goes beyond those previous studies in providing unique unaveraged experimental information on the remodeling of ABP occupied and unoccupied regions of F-actin at the single-filaments level.
Conclusions
1), Employing AFM imaging of individual filaments, we show, for the first time to our knowledge, the cooperativity of F-actin-drebrin interaction. 2), We showed directly the propagation of drebrin-induced conformational changes in actin filaments from decorated to bare F-actin regions. This may affect a subset of ABPs recruited to the drebrin-bound F-actin, contributing to the unique properties of neuronal cytoskeleton. 3), Using Drb1-300 construct we clarified the domain requirements for drebrin-induced conformational changes in F-actin. Our results suggest that all three drebrin isoforms (drebrin A, sA, and E) may induce the same type of actin remodeling.
Acknowledgments
We acknowledge the use of atomic force microscopy at the Nano and Pico Characterization Laboratory at the California NanoSystems Institute.
Support from the California NanoSystems Institute (to S.S.), the United States Public Health Service GM 077190 (to E.R.), and the Ministry of Education, Culture, Sports, Science and Technology WPI Program: International Center for Materials Nanoarchitectonics (MANA), Japan (to J.K.G.) is acknowledged.
Contributor Information
Shivani Sharma, Email: sharmas@ucla.edu.
James K. Gimzewski, Email: gim@chem.ucla.edu.
References
- 1.Lin Y.C., Koleske A.J. Mechanisms of synapse and dendrite maintenance and their disruption in psychiatric and neurodegenerative disorders. Annu. Rev. Neurosci. 2010;33:349–378. doi: 10.1146/annurev-neuro-060909-153204. [DOI] [PMC free article] [PubMed] [Google Scholar]
- 2.Hotulainen P., Hoogenraad C.C. Actin in dendritic spines: connecting dynamics to function. J. Cell Biol. 2010;189:619–629. doi: 10.1083/jcb.201003008. [DOI] [PMC free article] [PubMed] [Google Scholar]
- 3.Kojima N., Shirao T. Synaptic dysfunction and disruption of postsynaptic drebrin-actin complex: a study of neurological disorders accompanied by cognitive deficits. Neurosci. Res. 2007;58:1–5. doi: 10.1016/j.neures.2007.02.003. [DOI] [PubMed] [Google Scholar]
- 4.McGough A., Pope B., Weeds A. Cofilin changes the twist of F-actin: implications for actin filament dynamics and cellular function. J. Cell Biol. 1997;138:771–781. doi: 10.1083/jcb.138.4.771. [DOI] [PMC free article] [PubMed] [Google Scholar]
- 5.Isambert H., Venier P., Carlier M.F. Flexibility of actin filaments derived from thermal fluctuations. Effect of bound nucleotide, phalloidin, and muscle regulatory proteins. J. Biol. Chem. 1995;270:11437–11444. doi: 10.1074/jbc.270.19.11437. [DOI] [PubMed] [Google Scholar]
- 6.Hill A.V. The possible effects of the aggregation of the molecules of hemoglobin on its dissociation curves. J. Physiol. 1910;40:i–vii. [Google Scholar]
- 7.Weiss J.N. The Hill equation revisited: uses and misuses. FASEB J. 1997;11:835–841. [PubMed] [Google Scholar]
- 8.Wyman J., Jr. Linked functions and reciprocal effects in hemoglobin: a second look. Adv. Protein Chem. 1964;19:223–286. doi: 10.1016/s0065-3233(08)60190-4. [DOI] [PubMed] [Google Scholar]
- 9.Solomatin S.V., Greenfeld M., Herschlag D. Implications of molecular heterogeneity for the cooperativity of biological macromolecules. Nat. Struct. Mol. Biol. 2011;18:732–734. doi: 10.1038/nsmb.2052. [DOI] [PMC free article] [PubMed] [Google Scholar]
- 10.Trachtenberg S., Stokes D., DeRosier D. Actin and flagellar filaments: two helical structures with variable twist. Ann. N. Y. Acad. Sci. 1986;483:88–99. doi: 10.1111/j.1749-6632.1986.tb34500.x. [DOI] [PubMed] [Google Scholar]
- 11.Reisler E., Egelman E.H. Actin structure and function: what we still do not understand. J. Biol. Chem. 2007;282:36133–36137. doi: 10.1074/jbc.R700030200. [DOI] [PubMed] [Google Scholar]
- 12.Galkin V.E., Orlova A., Egelman E.H. Structural polymorphism in F-actin. Nat. Struct. Mol. Biol. 2010;17:1318–1323. doi: 10.1038/nsmb.1930. [DOI] [PMC free article] [PubMed] [Google Scholar]
- 13.Grintsevich E.E., Galkin V.E., Reisler E. Mapping of drebrin binding site on F-actin. J. Mol. Biol. 2010;398:542–554. doi: 10.1016/j.jmb.2010.03.039. [DOI] [PMC free article] [PubMed] [Google Scholar]
- 14.Galkin V.E., Orlova A., Egelman E.H. High-resolution cryo-EM structure of the F-actin-fimbrin/plastin ABD2 complex. Proc. Natl. Acad. Sci. USA. 2008;105:1494–1498. doi: 10.1073/pnas.0708667105. [DOI] [PMC free article] [PubMed] [Google Scholar]
- 15.Volkmann N., Amann K.J., Hanein D. Structure of Arp2/3 complex in its activated state and in actin filament branch junctions. Science. 2001;293:2456–2459. doi: 10.1126/science.1063025. [DOI] [PubMed] [Google Scholar]
- 16.Spudich J.A., Watt S. The regulation of rabbit skeletal muscle contraction. I. Biochemical studies of the interaction of the tropomyosin-troponin complex with actin and the proteolytic fragments of myosin. J. Biol. Chem. 1971;246:4866–4871. [PubMed] [Google Scholar]
- 17.Quinlan M.E., Hilgert S., Kerkhoff E. Regulatory interactions between two actin nucleators, Spire and Cappuccino. J. Cell Biol. 2007;179:117–128. doi: 10.1083/jcb.200706196. [DOI] [PMC free article] [PubMed] [Google Scholar]
- 18.De La Cruz E.M. Cofilin binding to muscle and non-muscle actin filaments: isoform-dependent cooperative interactions. J. Mol. Biol. 2005;346:557–564. doi: 10.1016/j.jmb.2004.11.065. [DOI] [PubMed] [Google Scholar]
- 19.Sharma S., Grintsevich E.E., Gimzewski J.K. Atomic force microscopy reveals drebrin induced remodeling of f-actin with subnanometer resolution. Nano Lett. 2011;11:825–827. doi: 10.1021/nl104159v. [DOI] [PMC free article] [PubMed] [Google Scholar]
- 20.Binnig G., Quate C.F., Gerber C. Atomic force microscope. Phys. Rev. Lett. 1986;56:930–933. doi: 10.1103/PhysRevLett.56.930. [DOI] [PubMed] [Google Scholar]
- 21.Radmacher M., Tillmann R.W., Gaub H.E. From molecules to cells: imaging soft samples with the atomic force microscope. Science. 1992;257:1900–1905. doi: 10.1126/science.1411505. [DOI] [PubMed] [Google Scholar]
- 22.Müller D.J., Schabert F.A., Engel A. Imaging purple membranes in aqueous solutions at sub-nanometer resolution by atomic force microscopy. Biophys. J. 1995;68:1681–1686. doi: 10.1016/S0006-3495(95)80345-0. [DOI] [PMC free article] [PubMed] [Google Scholar]
- 23.Hansma H.G., Hoh J.H. Biomolecular imaging with the atomic force microscope. Annu. Rev. Biophys. Biomol. Struct. 1994;23:115–139. doi: 10.1146/annurev.bb.23.060194.000555. [DOI] [PubMed] [Google Scholar]
- 24.Sharma S., Rasool H.I., Gimzewski J.K. Structural-mechanical characterization of nanoparticle exosomes in human saliva, using correlative AFM, FESEM, and force spectroscopy. ACS Nano. 2010;4:1921–1926. doi: 10.1021/nn901824n. [DOI] [PMC free article] [PubMed] [Google Scholar]
- 25.Bustamante C., Vesenka J., Keller R. Circular DNA molecules imaged in air by scanning force microscopy. Biochemistry. 1992;31:22–26. doi: 10.1021/bi00116a005. [DOI] [PubMed] [Google Scholar]
- 26.Murakami K., Yasunaga T., Wakabayashi T. Structural basis for actin assembly, activation of ATP hydrolysis, and delayed phosphate release. Cell. 2010;143:275–287. doi: 10.1016/j.cell.2010.09.034. [DOI] [PubMed] [Google Scholar]
- 27.Oda T., Iwasa M., Narita A. The nature of the globular- to fibrous-actin transition. Nature. 2009;457:441–445. doi: 10.1038/nature07685. [DOI] [PubMed] [Google Scholar]
- 28.Voss N.R., Potter C.S., Carragher B. Software tools for molecular microscopy: an open-text Wikibook. Methods Enzymol. 2010;482:381–392. doi: 10.1016/S0076-6879(10)82016-6. [DOI] [PubMed] [Google Scholar]
- 29.Pavlov D., Muhlrad A., Reisler E. Actin filament severing by cofilin. J. Mol. Biol. 2007;365:1350–1358. doi: 10.1016/j.jmb.2006.10.102. [DOI] [PMC free article] [PubMed] [Google Scholar]
- 30.Bobkov A.A., Muhlrad A., Reisler E. Cooperative effects of cofilin (ADF) on actin structure suggest allosteric mechanism of cofilin function. J. Mol. Biol. 2006;356:325–334. doi: 10.1016/j.jmb.2005.11.072. [DOI] [PubMed] [Google Scholar]